Market Alert: Bitcoin’s $81K Support Zone Could Decide Its Next Big Move
01 Januar 2025 - 12:00AM
NEWSBTC
As Bitcoin continues to slowly decline in price, the asset appears
to be moving closer to a key psychological level. With uncertainty
surrounding the continuation of Bitcoin’s current trend,
speculation remains divided on whether the crypto asset is
preparing for another upward breakout or entering a phase of
correction. Recent on-chain data suggests that specific metrics,
such as the realized price for short-term holders, are providing
essential insights into the market’s behavior and potential future
direction. Related Reading: Bitcoin’s Key SOPR Metric Holds Steady:
Are Long-Term Holders Eyeing Higher Prices? Key Support Level
Identified at $81,000 In an analysis recently uploaded on the
CryptoQuant QuickTake platform, an analyst known as Shayan BTC
revealed that the realized price metric, particularly for the 1-3
month UTXO (Unspent Transaction Output) age band, serves as a
critical indicator for assessing investor sentiment among newer
market participants. This metric represents the average purchase
price of Bitcoin for those who acquired the asset within the last
one to three months. A sustained price above this level typically
signals bullish momentum, suggesting that recent buyers are
confident in holding their positions despite prevailing market
volatility. Conversely, if Bitcoin’s price drops below this level,
it may indicate potential selling pressure as these short-term
holders attempt to limit their losses. According to Shayan, the
realized price for Bitcoin’s 1-3 month holder cohort currently
stands at $81,000. This level is seen as a vital support zone,
acting as a “psychological and technical defense” line for both
short-term and long-term investors. Historically, when Bitcoin’s
price remains above this threshold, it indicates a resilient market
sentiment where recent buyers demonstrate confidence in the asset’s
future price potential. On the flip side, a price drop below the
$81,000 mark could lead to increased selling activity, primarily
driven by short-term holders looking to exit their positions to
minimize potential losses. Such a scenario would likely add
downward pressure to the market, potentially triggering broader
sell-offs. Bitcoin Market Performance Bitcoin has so far given
investors a boring holiday season with its lackluster performance.
Particularly ever since the past weeks towards the middle of
December, Bitcoin has fallen below the $100,000 price mark and has
remained below it with little to no upward movement. Over the past
two weeks, Bitcoin has now dropped by 10.9%.2% as it remains below
the $100,000 price mark. However, its past day performance
has been quite interesting. Over this period, BTC has seen a sudden
increase of 4% to a current trading price of $95,519, at the time
of writing. Interestingly, despite this sudden surge, this price
mark puts Bitcoin at a roughly 11.9% decrease away from its
all-time high of $108,135 registered in the middle of December.
Featured image created with DALL-E, Chart from TradingView
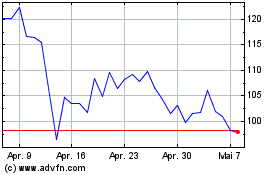
Quant (COIN:QNTUSD)
Historical Stock Chart
Von Dez 2024 bis Jan 2025

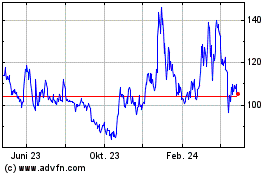
Quant (COIN:QNTUSD)
Historical Stock Chart
Von Jan 2024 bis Jan 2025
