false
0001821825
0001821825
2024-02-15
2024-02-15
iso4217:USD
xbrli:shares
iso4217:USD
xbrli:shares
UNITED STATES
SECURITIES AND EXCHANGE COMMISSION
Washington, D.C. 20549
FORM 8-K
CURRENT REPORT
Pursuant to Section 13 or 15(d) of the Securities
Exchange Act of 1934
Date of Report
(Date of earliest event reported): February 15, 2024
Organon &
Co.
(Exact name of registrant
as specified in its charter)
| Delaware |
|
001-40235 |
|
46-4838035 |
| (State or other jurisdiction of |
|
(Commission File Number) |
|
(I.R.S. Employer Identification
No.) |
| incorporation) |
|
|
|
|
| |
|
|
|
|
30 Hudson Street, Floor 33,
Jersey City, NJ |
|
|
|
07302 |
| (Address and principal executive offices) |
|
|
|
(Zip Code) |
| Registrant’s telephone number, including area code: (551) 430-6900 |
Check the appropriate box below if the Form 8-K filing is intended
to simultaneously satisfy the filing obligation of the registrant under any of the following provisions:
| ¨ | Written communications pursuant to Rule 425 under the Securities
Act (17 CFR 230.425) |
| ¨ | Soliciting material pursuant to Rule 14a-12 under the Exchange
Act (17 CFR 240.14a-12) |
| ¨ | Pre-commencement communications pursuant to Rule 14d-2(b) under
the Exchange Act (17 CFR 240.14d-2(b)) |
| ¨ | Pre-commencement communications pursuant to Rule 13e-4(c) under
the Exchange Act (17 CFR 240.13e-4(c)) |
Securities registered pursuant to Section 12(b) of the Act:
| Title of each class |
|
Trading Symbol(s) |
|
Name of
each exchange on which registered |
| Common Stock, par value $0.01 per share |
|
OGN |
|
NYSE |
Indicate by check mark whether the registrant is an emerging growth
company as defined in Rule 405 of the Securities Act of 1933 (§230.405 of this chapter) or Rule 12b-2 of the Securities Exchange
Act of 1934 (§240.12b-2 of this chapter).
Emerging growth company ¨
If an emerging growth company, indicate by check mark if the registrant
has elected not to use the extended transition period for complying with any new or revised financial accounting standards provided pursuant
to Section 13(a) of the Exchange Act. ¨
| Item 2.02 |
Results of Operations and Financial Condition. |
On February 15, 2024, Organon & Co.
(the “Company”) issued a press release (the “Earnings Release”) regarding its results for the quarter
and full year ended December 31, 2023. The Earnings Release is included as Exhibit 99.1 to this report.
The information contained in this Item 2.02, including
Exhibit 99.1 attached hereto, is considered to be “furnished” and shall not be deemed “filed” for purposes
of Section 18 of the Securities Exchange Act of 1934, as amended (the “Exchange Act”), or otherwise subject to
liability under that Section. The information in this Current Report shall not be incorporated by reference into any filing or other document
pursuant to the Securities Act of 1933, as amended (the “Securities Act”) or the Exchange Act, except as shall be expressly
set forth by specific reference in such filing or document. The release contains forward-looking statements regarding the Company and
includes a cautionary statement identifying important factors that could cause actual results to differ materially from those anticipated.
| Item 7.01 |
Regulation FD Disclosure. |
In connection with the conference call announced
in the Earnings Release, on February 15, 2024, the Company made available the Company Information Presentation relating to its financial
results for the quarter and full year ended December 31, 2023. The Company Information Presentation may be accessed within the investor
relations section of the Company’s website, https://www.organon.com. A copy of the Company Information Presentation is attached
hereto as Exhibit 99.2 and is incorporated herein by reference.
The information in this Item 7.01, including Exhibit 99.2
attached hereto, is considered to be “furnished” and shall not be deemed “filed” for purposes of Section 18
of the Exchange Act or otherwise subject to liability under that Section. The information in this Current Report shall not be incorporated
by reference into any filing or other document pursuant to the Securities Act or the Exchange Act, except as shall be expressly set forth
by specific reference in such filing or document. The Company Information Presentation contains forward-looking statements regarding the
Company and includes a cautionary statement identifying important factors that could cause actual results to differ materially from those
anticipated.
| Item 9.01 | Financial Statements and Exhibits. |
SIGNATURES
Pursuant to the requirements of
the Securities Exchange Act of 1934, the Registrant has duly caused this report to be signed on its behalf by the undersigned, hereunto
duly authorized.
| |
Organon & Co. |
| |
|
| |
By: |
/s/ Matthew Walsh |
| |
|
Name: |
Matthew Walsh |
| |
|
Title: |
Chief Financial Officer |
Dated: February 15, 2024
Exhibit 99.1

| Media Contacts: |
Karissa Peer |
Investor Contacts: |
Jennifer Halchak |
| |
(614) 314-8094 |
|
(201)
275-2711 |
| |
Kate Vossen |
|
Alex Arzeno |
| |
(732) 675-8448 |
|
(203) 550-3972 |
Organon Reports
Results for the Fourth Quarter and Full Year Ended December 31, 2023
| · | Full
year 2023 revenue of $6.3 billion, up 1% as-reported and 3% at constant currency |
| · | Full
year 2023 diluted earnings per share of $3.99 and non-GAAP Adjusted diluted earnings per
share of $4.14 |
| · | Full
year 2023 Adjusted EBITDA of $1.9 billion, representing a 31.0% Adjusted EBITDA margin |
| · | Full
year 2024 financial guidance ranges provided; full year revenue range of $6.2 billion to
$6.5 billion and Adjusted EBITDA margin in the range of 31.0% to 33.0% |
Jersey City, N.J., February 15,
2024 – Organon (NYSE: OGN) today announced its results for the fourth quarter and full year ended December 31, 2023.
"As we move into 2024, our priorities
are to deliver our third year of constant currency revenue growth and to achieve a stable to improving Adjusted EBITDA margin. Delivering
this financial profile is key for us to be able to continue advancing on our mission of a healthier every day for every woman. There’s
a tremendous opportunity in women’s health to address significant unmet needs and we are well positioned at the forefront of that
effort."
Fourth Quarter 2023 Revenue
| in $ millions | |
Q4
2023 | | |
Q4
2022 | | |
VPY | | |
VPY
ex-FX | |
| Women’s Health | |
$ | 465 | | |
$ | 433 | | |
| 7 | % | |
| 8 | % |
| Biosimilars | |
| 199 | | |
| 134 | | |
| 49 | % | |
| 48 | % |
| Established Brands | |
| 915 | | |
| 888 | | |
| 3 | % | |
| 3 | % |
| Other (1) | |
| 19 | | |
| 30 | | |
| (37 | )% | |
| (42 | )% |
| Revenues | |
$ | 1,598 | | |
$ | 1,485 | | |
| 8 | % | |
| 8 | % |
(1) Other includes manufacturing
sales to Merck & Co., Inc., Rahway, NJ, USA and other third parties.
For the fourth quarter of 2023, total
revenue was $1,598 million, an increase of 8% on an as-reported basis as well as excluding impact of foreign currency (ex-FX), compared
with the fourth quarter of 2022.
Women’s Health revenue increased
7% on an as-reported basis, and increased 8% ex-FX in the fourth quarter of 2023 compared with the fourth quarter of 2022 driven primarily
by strong growth in the company's fertility products, particularly Follistim AQ® (follitropin
beta injection). Follistim grew 63% ex-FX in the fourth quarter due to a one-time buy-in as a result of the exit of the
Interim Operating Model ("IOM") in the United States, increased demand in the U.S. that was largely tied to onboarding a new
customer, as well as volume recovery in China tied to fertility patients returning to clinics following abating COVID-19 concerns. The
Women's Health franchise also benefited from strong performance of oral contraceptives Marvelon™ (ethinylestradiol, desogestrel)
and Mercilon™ (ethinylestradiol, desogestrel) which was driven in part by the reacquisition of rights in selected territories
in Southeast Asia and China during 2022, as well as continued uptake of the Jada® system. Performance was partially offset
by a 3% ex-FX decline in Nexplanon® (etonogestrel implant) primarily related to customer buying patterns associated with the
company's decision to forgo its normal Nexplanon list-price increase in 2023, as well as a 12% ex-FX decrease in NuvaRing®
(etonogestrel/ethinyl estradiol vaginal ring) which continues to be impacted by generic competition.
Biosimilars
revenue increased 49% on an as-reported basis and increased 48% ex-FX in the fourth quarter of 2023, compared with the fourth quarter
of 2022 primarily driven by Ontruzant® (trastuzumab-dttb), which grew 76% ex-FX and benefited from favorable timing of tender
phasing in Brazil, and Renflexis® (infliximab-abda), which grew 28% ex-FX primarily due to U.S. strong volume growth. Revenue
of Hadlima™ (adalimumab-bwwd) more than doubled in the fourth quarter of 2023 compared with the fourth quarter of 2022 as
a result of continued uptake since its July 2023 launch in the U.S.
Established
Brands revenue increased 3% as-reported and 3% ex-FX in the fourth quarter of 2023 despite the impacts of Volume Based Procurement (VBP)
initiatives and a challenging operating environment in China. Growth
in the quarter was driven by a 13% ex-FX increase in the respiratory portfolio. In the cardiovascular portfolio, continued growth in
Atozet™ (ezetimibe and atorvastatin calcium) partially offset a decline in Cozaar®/Hyzaar®
(losartan) products which are subject to ongoing generic competition.
Fourth Quarter 2023 Profitability
| in $ millions, except per share amounts | |
Q4
2023 | | |
Q4
2022 | | |
VPY | |
| Revenues | |
$ | 1,598 | | |
$ | 1,485 | | |
| 8 | % |
| Cost of sales | |
| 683 | | |
| 594 | | |
| 15 | % |
| Gross profit | |
| 915 | | |
| 891 | | |
| 3 | % |
| Non-GAAP Adjusted gross profit (1) | |
| 964 | | |
| 937 | | |
| 3 | % |
| Adjusted EBITDA (1,2) | |
| 449 | | |
| 380 | | |
| 18 | % |
| Net income | |
| 546 | | |
| 108 | | |
| 406 | % |
| Non-GAAP Adjusted net income (1) | |
| 226 | | |
| 208 | | |
| 9 | % |
| Diluted Earnings per Share (EPS) | |
| 2.13 | | |
| 0.42 | | |
| 407 | % |
| Non-GAAP Adjusted diluted EPS (1) | |
| 0.88 | | |
| 0.81 | | |
| 9 | % |
| Acquired in-process research & development (IPR&D)
and milestones | |
| — | | |
| — | | |
| — | |
| Per share impact to diluted EPS from acquired IPR&D
and milestones | |
| — | | |
| — | | |
| — | |
| | |
Q4
2023 | | |
Q4
2022 | |
|
|
|
|
| Gross margin | |
| 57.3 | % | |
| 60.0 | % |
|
|
|
|
| Non-GAAP Adjusted gross margin
(1) | |
| 60.3 | % | |
| 63.1 | % |
|
|
|
|
| Adjusted EBITDA margin (1,
2) | |
| 28.1 | % | |
| 25.6 | % |
|
|
|
|
| (1) | See Tables 4 and 5 for reconciliations
of GAAP to non-GAAP financial measures |
| (2) | Adjusted EBITDA and Adjusted
EBITDA margin include no acquired IPR&D in the fourth quarter 2022 nor the fourth quarter
2023 |
Gross margin was 57.3% as-reported and
60.3% on an adjusted basis in the fourth quarter of 2023 compared with 60.0% as-reported and 63.1% on an adjusted basis in the fourth
quarter of 2022. Unfavorable foreign exchange translation and to a lesser extent, product mix more than offset a favorable year-over-year
comparison to the fourth quarter 2022 when the company took a market action on certain injectable steroid products.
Adjusted EBITDA
margin was 28.1% in the fourth quarter of 2023 compared
with 25.6% in the fourth quarter of 2022 primarily due to lower year-over-year operating expenses and lower loss on foreign exchange
translation attributable to the year-over-year comparison of the amount of the company's Euro-denominated debt covered under a net investment
hedge program.
Net income for the fourth quarter of
2023 was $546 million, or $2.13 per diluted share, compared with $108 million, or $0.42 per diluted share, in the fourth quarter of 2022.
Non-GAAP Adjusted net income was $226 million, or $0.88 per diluted share, compared with $208 million, or $0.81 per diluted share, in
2022. Reported GAAP net income for the fourth quarter includes a net $476 million tax benefit resulting from the termination of a Swiss
tax arrangement.
Revenues
| in $ millions | |
FY
2023 | | |
FY
2022 | | |
VPY | | |
VPY
ex-FX | |
| Women’s Health | |
$ | 1,702 | | |
$ | 1,673 | | |
| 2 | % | |
| 3 | % |
| Biosimilars | |
| 593 | | |
| 481 | | |
| 23 | % | |
| 24 | % |
| Established Brands | |
| 3,847 | | |
| 3,874 | | |
| (1 | )% | |
| 2 | % |
| Other(1) | |
| 121 | | |
| 146 | | |
| (17 | )% | |
| (19 | )% |
| Revenue | |
$ | 6,263 | | |
$ | 6,174 | | |
| 1 | % | |
| 3 | % |
(1) Other
includes manufacturing sales to Merck & Co., Inc., Rahway, NJ, USA.
Total revenue was $6.3 billion for full
year 2023, an increase of 1% as-reported and an increase of 3% ex-FX, compared with the full year 2022.
Women’s Health revenue increased
2% as-reported and 3% ex-FX for full year 2023 compared with 2022. Strong growth in the company's fertility portfolio, which was up 9%
ex-FX for the full year, a 24% ex-FX increase in oral contraceptives Marvelon/Mercilon and continued uptake of the Jada System,
were the strongest revenue contributors to the Women’s Health franchise in 2023. Together these factors more than offset an 11%
ex-FX decline in NuvaRing, which continues to be impacted by generic competition. Modest growth of Nexplanon of 1% ex-FX
for the full year reflects the impact of the limited participation of a tender in Mexico and customer buying patterns associated with
the company's decision to forgo its normal list price increase for Nexplanon in 2023.
Biosimilars revenue increased 23% as-reported
and 24% ex-FX for full year 2023 compared with 2022, driven primarily by continued demand growth in the U.S. and Canada for Renflexis
and favorable phasing of tenders in Brazil and increased demand for Ontruzant, partially offset by competitive pressures in
Europe.
Revenue for Established Brands declined
1% as-reported and increased 2% ex-FX for the full year 2023 despite VBP initiatives and a challenging operating environment in China
as well as supply interruptions of certain of the company's injectable steroid products stemming from the market action taken earlier
in the year. Performance was driven by 2% growth in volume across the portfolio, partially offset by 1% price pressure. The
company expects flat performance in the Established Brands franchise for full year 2024 on an ex-FX basis.
Full Year 2023 Profitability
| in $ millions, except per share amounts | |
2023 | | |
2022 | | |
VPY | |
| Revenues | |
$ | 6,263 | | |
$ | 6,174 | | |
| 1 | % |
| Cost of sales | |
| 2,515 | | |
| 2,294 | | |
| 10 | % |
| Gross profit | |
| 3,748 | | |
| 3,880 | | |
| (3 | )% |
| Non-GAAP Adjusted gross profit (1) | |
| 3,930 | | |
| 4,058 | | |
| (3 | )% |
| Adjusted EBITDA (1,2) | |
| 1,944 | | |
| 2,085 | | |
| (7 | )% |
| Net income | |
| 1,023 | | |
| 917 | | |
| 12 | % |
| Non-GAAP Adjusted net income (1) | |
| 1,061 | | |
| 1,284 | | |
| (17 | )% |
| Diluted Earnings per Share (EPS) | |
| 3.99 | | |
| 3.59 | | |
| 11 | % |
| Non-GAAP Adjusted diluted EPS (1) | |
| 4.14 | | |
| 5.03 | | |
| (18 | )% |
| Acquired in-process research & development (IPR&D)
and milestones | |
| 8 | | |
| 107 | | |
| (93 | )% |
| Per share impact to diluted EPS from acquired IPR&D
and milestones | |
| (0.03 | ) | |
| (0.33 | ) | |
| (91 | )% |
| | |
2023 | | |
2022 | |
|
|
|
|
| Gross margin | |
| 59.8 | % | |
| 62.8 | % |
|
|
|
|
| Non-GAAP Adjusted gross margin
(1) | |
| 62.7 | % | |
| 65.7 | % |
|
|
|
|
| Adjusted EBITDA margin (1,
2) | |
| 31.0 | % | |
| 33.8 | % |
|
|
|
|
| (1) | See Tables 4 and 5 for reconciliations
of GAAP to non-GAAP financial measures |
| (2) | Adjusted EBITDA and Adjusted
EBITDA margin include $8 million in 2023 and $107 million in 2022 related to acquired IPR&D
and milestones |
Gross margin was 59.8% as-reported and
62.7% on an adjusted basis for full year 2023 compared with 62.8% as-reported and 65.7% on an adjusted basis for full year 2022. The
year-over-year decrease in Adjusted gross margin reflects higher cost of sales due to foreign exchange translation and product mix, and
to a lesser extent, higher employee-related and distribution-related costs.
Adjusted EBITDA margin was 31.0% for
the full year 2023 compared with 33.8% for the full year 2022. The year-over-year decrease was primarily a result of a lower Adjusted
gross margin. Higher selling and promotional costs were mostly offset by lower total research and development spend, which includes in-process
research and development (IPR&D).
Net income for 2023 was $1.0 billion,
or $3.99 per diluted share, compared with $917 million, or $3.59 per diluted share in 2022. Non-GAAP Adjusted net income was $1.1 billion
or $4.14 per diluted share, compared with $1.3 billion, or $5.03 per diluted share in 2022. The year-over-year decline in net income
was primarily due to higher interest expense due to increased interest rates, and accelerated amortization of capitalized financing costs
associated with voluntary prepayments on the company’s U.S. dollar-denominated term loan.
Capital Allocation
Today, Organon’s Board of Directors
declared a quarterly dividend of $0.28 for each issued and outstanding share of the company's common stock. The
dividend is payable on March 14, 2024, to stockholders of record at the close of business on February 26,
2024.
As of December 31, 2023, cash and
cash equivalents were $693 million, and debt was $8.8 billion.
Full Year Guidance
Organon does not provide GAAP financial
measures on a forward-looking basis because the company cannot predict with reasonable certainty and without unreasonable effort, the
ultimate outcome of legal proceedings, unusual gains and losses, the occurrence of matters creating GAAP tax impacts, and acquisition-related
expenses. These items are uncertain, depend on various factors, and could be material to Organon’s results computed in accordance
with GAAP.
Full year 2024 financial guidance is
presented below on a non-GAAP basis. For full year 2024, Organon expects constant currency revenue growth in the low-single-digit range
and expects stable to improving Adjusted EBITDA margin, which Organon expects to achieve, in part, through operating expense management.
| | |
2024
Full Year Guidance |
| Revenues | |
$6.2B-$6.5B |
| Adjusted gross margin | |
61.0% - 63.0% |
| SG&A | |
$1.5B - $1.7B |
| R&D (excluding IPR&D) | |
$400M - $500M |
| Adjusted EBITDA
margin | |
31.0% - 33.0% |
| Interest | |
~$520M |
| Depreciation | |
~$130M |
| Effective non-GAAP tax rate | |
18.5% - 20.5% |
| Fully diluted weighted average shares outstanding | |
~259M |
Webcast Information
Organon will host a conference call
at 8:30 a.m. Eastern Time today to discuss its fourth quarter and full year 2023 financial results. To listen to the event and
view the presentation slides via webcast, join from the Organon Investor Relations website
at https://www.organon.com/investor-relations/events-and-presentations/. A replay of the webcast will be available
approximately two hours after the conclusion of the live event on the company’s website. Institutional investors and analysts
interested in participating in the call must register in advance by clicking on this link: https://conferencingportals.com/event/VfCOQYEG
Following registration, participants
will receive a confirmation email containing details on how to join the conference call, including dial-in information and a unique passcode
and registrant ID. Pre-registration will allow participants to bypass an operator and be placed directly into the call.
About Organon
Organon is a global healthcare company
formed to focus on improving the health of women throughout their lives. Organon offers more than 60 medicines and products in women’s
health in addition to a growing biosimilars business and a large franchise of established medicines across a range of therapeutic areas.
Organon’s existing products produce strong cash flows that support investments in innovation and future growth opportunities in
women’s health and biosimilars. In addition, Organon is pursuing opportunities to collaborate with biopharmaceutical innovators
looking to commercialize their products by leveraging its scale and presence in fast growing international markets.
Organon has a global footprint with
significant scale and geographic reach, world-class commercial capabilities, and approximately 10,000 employees with headquarters located
in Jersey City, New Jersey.
For more information, visit http://www.organon.com and connect
with us on LinkedIn, Instagram, X (formerly known as Twitter) and Facebook.
Cautionary Note Regarding Non-GAAP
Financial Measures
This press release contains “non-GAAP
financial measures,” which are financial measures that either exclude or include amounts that are correspondingly not excluded
or included in the most directly comparable measures calculated and presented in accordance with U.S. generally accepted accounting principles
(“GAAP”). Specifically, the company makes use of the non-GAAP financial measures Adjusted EBITDA, Adjusted gross margin,
Adjusted gross profit, Adjusted net income, and Adjusted diluted EPS, which are not recognized terms under GAAP and are presented only
as a supplement to the company’s GAAP financial statements. This press release also provides certain measures that exclude the
impact of foreign exchange. We calculate foreign exchange by converting our current-period local currency financial results using the
prior period average currency rates and comparing these adjusted amounts to our current-period results. The company believes that these
non-GAAP financial measures help to enhance an understanding of the company’s financial performance. However, the presentation
of these measures has limitations as an analytical tool and should not be considered in isolation, or as a substitute for the company’s
results as reported under GAAP. Because not all companies use identical calculations, the presentations of these non-GAAP measures may
not be comparable to other similarly titled measures of other companies. You should refer to Table 4 and Table 5 of this press release
for relevant definitions and reconciliations of non-GAAP financial measures contained herein to the most directly comparable GAAP measures.
In addition, the company’s full-year 2024 guidance measures (other
than revenue) are provided on a non-GAAP basis because the company is unable to reasonably predict certain items contained in the GAAP
measures. Such items include, but are not limited to, acquisition related expenses, restructuring and related expenses, stock-based compensation,
the ultimate outcome of legal proceedings, unusual gains and losses, the occurrence of matters creating GAAP tax impacts and other items
not reflective of the company's ongoing operations.
The company uses non-GAAP financial measures in its operational and
financial decision making and believes that it is useful to exclude certain items in order to focus on what it regards to be a more meaningful
representation of the underlying operating performance of the business.
Cautionary Note Regarding Forward-Looking Statements
Except for historical information, this press release includes “forward-looking
statements” within the meaning of the safe harbor provisions of the U.S. Private Securities Litigation Reform Act of 1995, including,
but not limited to, statements about management’s expectations about Organon’s future financial performance and prospects,
including full-year 2024 guidance estimates and predictions regarding other financial information and metrics, and franchise and product
performance and strategy expectations for future periods. Forward-looking statements may be identified by words such as "foresees"
“expects,” “intends,” “anticipates,” “plans,” “believes,” “seeks,”
“estimates,” “will” or words of similar meaning. These statements are based upon the current beliefs and expectations
of the company’s management and are subject to significant risks and uncertainties. If underlying assumptions prove inaccurate or
risks or uncertainties materialize, actual results may differ materially from those set forth in the forward-looking statements.
Risks and uncertainties include, but are not limited to, an inability
to fully execute on our product development and commercialization plans within the United States or internationally; an inability to adapt
to the industry-wide trend toward highly discounted channels; changes in tax laws or other tax guidance that could adversely affect our
cash tax liability, effective tax rates, and results of operations and lead to greater audit scrutiny; an inability to execute on our
business development strategy or realize the benefits of our planned acquisitions; efficacy, safety, or other quality concerns with respect
to marketed products, including market actions such as recalls, withdrawals, or declining sales; political and social pressures, or regulatory
developments, that adversely impact demand for, availability of, or patient access to contraception or fertility products; general economic
factors, including recessionary pressures, interest rate and currency exchange rate fluctuations; general industry conditions and competition;
the impact of pharmaceutical industry regulation and health care legislation in the United States and internationally; global trends toward
health care cost containment; technological advances; new products and patents attained by competitors; the impact of higher selling and
promotional costs; any failure by Organon to obtain an additional period of market exclusivity in the United States for Nexplanon subsequent
to the expiration of certain key patents in 2027; challenges inherent in new product development, including obtaining regulatory approval;
the company’s ability to accurately predict its future financial results and performance; manufacturing difficulties or delays;
financial instability of international economies and sovereign risk; difficulties developing and sustaining relationships with commercial
counterparties; dependence on the effectiveness of the company’s patents and other protections for innovative products; and the
exposure to litigation, including patent litigation, and/or regulatory actions.
The company undertakes no obligation to publicly update any forward-looking
statement, whether as a result of new information, future events or otherwise. Additional factors that could cause results to differ materially
from those described in the forward-looking statements can be found in the company’s filings with the Securities and Exchange Commission
("SEC"), including the company’s most recent Annual Report on Form 10-K and subsequent SEC filings, available at
the SEC’s Internet site (www.sec.gov).
TABLE 1
Organon & Co.
Condensed Consolidated Statement of Income
(Unaudited, $ in millions except shares in thousands
and per share amounts)
| | |
Three Months Ended
December 31, | | |
Year Ended
December 31, | |
| | |
2023 | | |
2022 | | |
2023 | | |
2022 | |
| Revenues | |
$ | 1,598 | | |
$ | 1,485 | | |
$ | 6,263 | | |
$ | 6,174 | |
| Costs, Expenses and Other | |
| | | |
| | | |
| | | |
| | |
| Cost of sales | |
| 683 | | |
| 594 | | |
| 2,515 | | |
| 2,294 | |
| Selling, general and administrative | |
| 469 | | |
| 470 | | |
| 1,893 | | |
| 1,704 | |
| Research and development | |
| 134 | | |
| 142 | | |
| 528 | | |
| 471 | |
| Acquired in-process research and development and milestones | |
| — | | |
| — | | |
| 8 | | |
| 107 | |
| Restructuring costs | |
| 58 | | |
| 17 | | |
| 62 | | |
| 28 | |
| Interest expense | |
| 129 | | |
| 119 | | |
| 527 | | |
| 422 | |
| Exchange losses | |
| 17 | | |
| 32 | | |
| 42 | | |
| 11 | |
| Other expense, net | |
| 4 | | |
| — | | |
| 15 | | |
| 15 | |
| | |
| 1,494 | | |
| 1,374 | | |
| 5,590 | | |
| 5,052 | |
| Income Before Income Taxes | |
| 104 | | |
| 111 | | |
| 673 | | |
| 1,122 | |
| Taxes on income | |
| (442 | ) | |
| 3 | | |
| (350 | ) | |
| 205 | |
| Net Income | |
| 546 | | |
| 108 | | |
| 1,023 | | |
| 917 | |
| | |
| | | |
| | | |
| | | |
| | |
| Earnings per Share: | |
| | | |
| | | |
| | | |
| | |
| Basic | |
$ | 2.14 | | |
$ | 0.42 | | |
$ | 4.01 | | |
$ | 3.61 | |
| Diluted | |
$ | 2.13 | | |
$ | 0.42 | | |
$ | 3.99 | | |
$ | 3.59 | |
| | |
| | | |
| | | |
| | | |
| | |
| Weighted Average Shares Outstanding: | |
| | | |
| | | |
| | | |
| | |
| Basic | |
| 255,617 | | |
| 254,367 | | |
| 255,239 | | |
| 254,082 | |
| Diluted | |
| 256,590 | | |
| 255,390 | | |
| 256,270 | | |
| 255,169 | |
TABLE 2
Organon & Co.
Sales by top products
(Unaudited, $ in millions)
| | |
Three Months
Ended December 31, | | |
Year Ended
December 31, | |
| | |
2023 | | |
2022 | | |
2023 | | |
2022 | |
| | |
U.S. | | |
Int’l | | |
Total | | |
U.S. | | |
Int’l | | |
Total | | |
U.S. | | |
Int’l | | |
Total | | |
U.S. | | |
Int’l | | |
Total | |
| Women’s Health | |
| | | |
| | | |
| | | |
| | | |
| | | |
| | | |
| | | |
| | | |
| | | |
| | | |
| | | |
| | |
| Nexplanon/Implanon NXT | |
$ | 154 | | |
$ | 76 | | |
$ | 231 | | |
$ | 172 | | |
$ | 67 | | |
$ | 239 | | |
$ | 572 | | |
$ | 257 | | |
$ | 830 | | |
$ | 573 | | |
$ | 261 | | |
$ | 834 | |
| Follistim AQ | |
| 51 | | |
| 31 | | |
| 83 | | |
| 26 | | |
| 25 | | |
| 50 | | |
| 125 | | |
| 136 | | |
| 262 | | |
| 105 | | |
| 124 | | |
| 229 | |
| NuvaRing | |
| 16 | | |
| 19 | | |
| 35 | | |
| 21 | | |
| 20 | | |
| 40 | | |
| 66 | | |
| 86 | | |
| 152 | | |
| 85 | | |
| 88 | | |
| 173 | |
| Ganirelix Acetate Injection | |
| 4 | | |
| 18 | | |
| 22 | | |
| 6 | | |
| 20 | | |
| 25 | | |
| 19 | | |
| 91 | | |
| 110 | | |
| 26 | | |
| 97 | | |
| 123 | |
| Marvelon/Mercilon | |
| — | | |
| 37 | | |
| 37 | | |
| — | | |
| 24 | | |
| 24 | | |
| — | | |
| 134 | | |
| 134 | | |
| — | | |
| 110 | | |
| 110 | |
| Jada | |
| 13 | | |
| — | | |
| 13 | | |
| 8 | | |
| — | | |
| 8 | | |
| 43 | | |
| — | | |
| 43 | | |
| 20 | | |
| — | | |
| 20 | |
| Other Women's Health (1) | |
| 20 | | |
| 26 | | |
| 44 | | |
| 22 | | |
| 24 | | |
| 46 | | |
| 72 | | |
| 101 | | |
| 171 | | |
| 90 | | |
| 94 | | |
| 184 | |
| Biosimilars | |
| | | |
| | | |
| | | |
| | | |
| | | |
| | | |
| | | |
| | | |
| | | |
| | | |
| | | |
| | |
| Renflexis | |
| 63 | | |
| 14 | | |
| 77 | | |
| 51 | | |
| 9 | | |
| 60 | | |
| 234 | | |
| 43 | | |
| 278 | | |
| 196 | | |
| 30 | | |
| 226 | |
| Ontruzant | |
| 10 | | |
| 52 | | |
| 62 | | |
| 13 | | |
| 22 | | |
| 35 | | |
| 46 | | |
| 109 | | |
| 155 | | |
| 48 | | |
| 74 | | |
| 122 | |
| Brenzys | |
| — | | |
| 28 | | |
| 28 | | |
| — | | |
| 23 | | |
| 23 | | |
| — | | |
| 73 | | |
| 73 | | |
| — | | |
| 75 | | |
| 75 | |
| Aybintio | |
| — | | |
| 9 | | |
| 9 | | |
| — | | |
| 10 | | |
| 10 | | |
| — | | |
| 43 | | |
| 43 | | |
| — | | |
| 39 | | |
| 39 | |
| Hadlima | |
| 15 | | |
| 8 | | |
| 23 | | |
| — | | |
| 6 | | |
| 6 | | |
| 17 | | |
| 26 | | |
| 44 | | |
| — | | |
| 19 | | |
| 19 | |
| Established Brands | |
| | | |
| | | |
| | | |
| | | |
| | | |
| | | |
| | | |
| | | |
| | | |
| | | |
| | | |
| | |
| Cardiovascular | |
| | | |
| | | |
| | | |
| | | |
| | | |
| | | |
| | | |
| | | |
| | | |
| | | |
| | | |
| | |
| Zetia | |
| 3 | | |
| 65 | | |
| 67 | | |
| 1 | | |
| 70 | | |
| 71 | | |
| 8 | | |
| 299 | | |
| 306 | | |
| 8 | | |
| 350 | | |
| 357 | |
| Vytorin | |
| 1 | | |
| 28 | | |
| 29 | | |
| 1 | | |
| 25 | | |
| 26 | | |
| 6 | | |
| 124 | | |
| 129 | | |
| 8 | | |
| 123 | | |
| 130 | |
| Atozet | |
| — | | |
| 122 | | |
| 122 | | |
| — | | |
| 107 | | |
| 107 | | |
| — | | |
| 519 | | |
| 519 | | |
| — | | |
| 457 | | |
| 457 | |
| Rosuzet | |
| — | | |
| 18 | | |
| 18 | | |
| — | | |
| 16 | | |
| 16 | | |
| — | | |
| 70 | | |
| 70 | | |
| — | | |
| 71 | | |
| 71 | |
| Cozaar/Hyzaar | |
| 2 | | |
| 55 | | |
| 57 | | |
| 2 | | |
| 66 | | |
| 68 | | |
| 10 | | |
| 272 | | |
| 281 | | |
| 13 | | |
| 310 | | |
| 323 | |
| Other Cardiovascular (1) | |
| — | | |
| 28 | | |
| 29 | | |
| 1 | | |
| 39 | | |
| 40 | | |
| 2 | | |
| 151 | | |
| 155 | | |
| 3 | | |
| 156 | | |
| 159 | |
| Respiratory | |
| | | |
| | | |
| | | |
| | | |
| | | |
| | | |
| | | |
| | | |
| | | |
| | | |
| | | |
| | |
| Singulair | |
| 2 | | |
| 111 | | |
| 114 | | |
| 3 | | |
| 92 | | |
| 95 | | |
| 11 | | |
| 393 | | |
| 404 | | |
| 11 | | |
| 400 | | |
| 411 | |
| Nasonex | |
| — | | |
| 65 | | |
| 65 | | |
| — | | |
| 56 | | |
| 56 | | |
| — | | |
| 252 | | |
| 253 | | |
| 10 | | |
| 229 | | |
| 238 | |
| Dulera | |
| 40 | | |
| 10 | | |
| 50 | | |
| 42 | | |
| 10 | | |
| 52 | | |
| 156 | | |
| 38 | | |
| 194 | | |
| 140 | | |
| 40 | | |
| 180 | |
| Clarinex | |
| 1 | | |
| 29 | | |
| 30 | | |
| 2 | | |
| 25 | | |
| 27 | | |
| 5 | | |
| 132 | | |
| 136 | | |
| 4 | | |
| 121 | | |
| 125 | |
| Other Respiratory (1) | |
| 8 | | |
| 8 | | |
| 15 | | |
| 12 | | |
| 5 | | |
| 17 | | |
| 49 | | |
| 28 | | |
| 77 | | |
| 46 | | |
| 36 | | |
| 83 | |
| Non-Opioid Pain, Bone and | |
| | | |
| | | |
| | | |
| | | |
| | | |
| | | |
| | | |
| | | |
| | | |
| | | |
| | | |
| | |
| Arcoxia | |
| — | | |
| 51 | | |
| 51 | | |
| — | | |
| 56 | | |
| 56 | | |
| — | | |
| 257 | | |
| 257 | | |
| — | | |
| 241 | | |
| 241 | |
| Fosamax | |
| — | | |
| 35 | | |
| 36 | | |
| 2 | | |
| 34 | | |
| 36 | | |
| 3 | | |
| 156 | | |
| 159 | | |
| 4 | | |
| 148 | | |
| 152 | |
| Diprospan | |
| — | | |
| 33 | | |
| 33 | | |
| — | | |
| 31 | | |
| 31 | | |
| — | | |
| 91 | | |
| 91 | | |
| — | | |
| 122 | | |
| 122 | |
| Other Non-Opioid Pain, Bone and Dermatology (1) | |
| 4 | | |
| 64 | | |
| 67 | | |
| 5 | | |
| 56 | | |
| 62 | | |
| 14 | | |
| 261 | | |
| 275 | | |
| 15 | | |
| 257 | | |
| 273 | |
| Other | |
| | | |
| | | |
| | | |
| | | |
| | | |
| | | |
| | | |
| | | |
| | | |
| | | |
| | | |
| | |
| Proscar | |
| — | | |
| 20 | | |
| 20 | | |
| — | | |
| 23 | | |
| 24 | | |
| 1 | | |
| 96 | | |
| 97 | | |
| 1 | | |
| 99 | | |
| 101 | |
| Propecia | |
| 2 | | |
| 31 | | |
| 33 | | |
| 2 | | |
| 28 | | |
| 30 | | |
| 7 | | |
| 118 | | |
| 125 | | |
| 7 | | |
| 118 | | |
| 125 | |
| Other (1) | |
| 1 | | |
| 78 | | |
| 79 | | |
| 3 | | |
| 72 | | |
| 75 | | |
| 13 | | |
| 308 | | |
| 319 | | |
| 24 | | |
| 302 | | |
| 326 | |
| Other (2) | |
| 1 | | |
| 18 | | |
| 19 | | |
| (1 | ) | |
| 30 | | |
| 30 | | |
| (1 | ) | |
| 121 | | |
| 121 | | |
| — | | |
| 146 | | |
| 146 | |
| Revenues | |
$ | 411 | | |
$ | 1,187 | | |
$ | 1,598 | | |
$ | 394 | | |
$ | 1,091 | | |
$ | 1,485 | | |
$ | 1,478 | | |
$ | 4,785 | | |
$ | 6,263 | | |
$ | 1,437 | | |
$ | 4,737 | | |
$ | 6,174 | |
Totals may
not foot due to rounding. Trademarks appearing above in italics are trademarks of, or are used under license by, the Organon group of
companies.
| (1) | Includes sales of products not listed separately. Revenues
from Jada were previously reported as part of Other Women's Health. Revenue from an arrangement for the sale of generic etonogestrel/ethinyl
estradiol vaginal ring is included in Other Women's Health. |
| (2) | Other includes manufacturing sales to Merck & Co., Inc.,
Rahway, NJ, USA and other third parties. |
TABLE 3
Organon & Co.
Sales by geographic area
(Unaudited, $ in millions)
| | |
Three Months Ended
December 31, | | |
Year Ended
December 31, | |
| | |
2023 | | |
2022 | | |
2023 | | |
2022 | |
| Europe and Canada | |
$ | 414 | | |
$ | 389 | | |
$ | 1,673 | | |
$ | 1,631 | |
| United States | |
| 411 | | |
| 394 | | |
| 1,478 | | |
| 1,437 | |
| Asia Pacific and Japan | |
| 261 | | |
| 256 | | |
| 1,129 | | |
| 1,143 | |
| China | |
| 203 | | |
| 196 | | |
| 864 | | |
| 917 | |
| Latin America, Middle East, Russia, and Africa | |
| 279 | | |
| 230 | | |
| 965 | | |
| 895 | |
| Other (1) | |
| 30 | | |
| 20 | | |
| 154 | | |
| 151 | |
| Revenues | |
$ | 1,598 | | |
$ | 1,485 | | |
$ | 6,263 | | |
$ | 6,174 | |
(1) Other
includes manufacturing sales to Merck & Co., Inc., Rahway, NJ, USA and other third parties.
TABLE 4
Reconciliation of GAAP Reported to Non-GAAP
Adjusted Information
(Unaudited, $ in millions except per share amounts)
| | |
Three Months Ended December 31, 2023 | |
| | |
GAAP | | |
Spin related
Costs(1) | | |
Restructuring | | |
Stock-based
Compensation | | |
Amortization | | |
Other(2) | | |
Non-GAAP
Adjusted | |
| Revenues | |
$ | 1,598 | | |
| | | |
| | | |
| | | |
| | | |
| | | |
$ | 1,598 | |
| Cost of sales | |
| 683 | | |
| (17 | ) | |
| — | | |
| (4 | ) | |
| (28 | ) | |
| — | | |
| 634 | |
| Gross profit | |
| 915 | | |
| | | |
| | | |
| | | |
| | | |
| | | |
| 964 | |
| Gross margin | |
| 57.3 | % | |
| | | |
| | | |
| | | |
| | | |
| | | |
| 60.3 | % |
| | |
| | | |
| | | |
| | | |
| | | |
| | | |
| | | |
| | |
| Selling, general and administrative | |
| 469 | | |
| (47 | ) | |
| — | | |
| (18 | ) | |
| — | | |
| (3 | ) | |
| 401 | |
| Research and development | |
| 134 | | |
| (2 | ) | |
| — | | |
| (5 | ) | |
| — | | |
| — | | |
| 127 | |
| Acquired in-process research and development and milestones | |
| — | | |
| — | | |
| — | | |
| — | | |
| — | | |
| — | | |
| — | |
| Restructuring costs | |
| 58 | | |
| — | | |
| (58 | ) | |
| — | | |
| — | | |
| — | | |
| — | |
| Interest expense | |
| 129 | | |
| — | | |
| — | | |
| — | | |
| — | | |
| — | | |
| 129 | |
| Exchange losses | |
| 17 | | |
| — | | |
| — | | |
| — | | |
| — | | |
| — | | |
| 17 | |
| Other expense (income), net | |
| 4 | | |
| (4 | ) | |
| — | | |
| — | | |
| — | | |
| — | | |
| — | |
| | |
| 1,494 | | |
| | | |
| | | |
| | | |
| | | |
| | | |
| 1,308 | |
| Income before income taxes | |
| 104 | | |
| | | |
| | | |
| | | |
| | | |
| | | |
| 290 | |
| Taxes on income | |
| (442 | ) | |
| 7 | | |
| 12 | | |
| 5 | | |
| 5 | | |
| 477 | | |
| 64 | |
| Net income | |
$ | 546 | | |
| | | |
| | | |
| | | |
| | | |
| | | |
$ | 226 | |
| | |
| | | |
| | | |
| | | |
| | | |
| | | |
| | | |
| | |
| Earnings per share - Diluted | |
$ | 2.13 | | |
| | | |
| | | |
| | | |
| | | |
| | | |
$ | 0.88 | |
(1) One-time spin-related costs includes
costs from the separation of Merck & Co., Inc., Rahway, NJ, US.
(2) Other costs primarily includes a tax benefit resulting
from the termination of a Swiss tax arrangement and one-time costs related to inventory step-up adjustments and legal reserves.
| | |
Three Months Ended December 31, 2022 | |
| | |
GAAP | | |
Spin related
Costs(1) | | |
Restructuring | | |
Stock-based
Compensation | | |
Amortization | | |
Other(2) | | |
Non-GAAP
Adjusted | |
| Revenues | |
$ | 1,485 | | |
| | | |
| | | |
| | | |
| | | |
| | | |
$ | 1,485 | |
| Cost of sales | |
| 594 | | |
| (7 | ) | |
| — | | |
| (4 | ) | |
| (28 | ) | |
| (7 | ) | |
| 548 | |
| Gross profit | |
| 891 | | |
| | | |
| | | |
| | | |
| | | |
| | | |
| 937 | |
| Gross margin | |
| 60.0 | % | |
| | | |
| | | |
| | | |
| | | |
| | | |
| 63.1 | % |
| | |
| | | |
| | | |
| | | |
| | | |
| | | |
| | | |
| | |
| Selling, general and administrative | |
| 470 | | |
| (36 | ) | |
| — | | |
| (16 | ) | |
| — | | |
| (4 | ) | |
| 414 | |
| Research and development | |
| 142 | | |
| (3 | ) | |
| — | | |
| (3 | ) | |
| — | | |
| (1 | ) | |
| 135 | |
| Acquired in-process research and development and milestones | |
| — | | |
| — | | |
| — | | |
| — | | |
| — | | |
| — | | |
| — | |
| Restructuring costs | |
| 17 | | |
| — | | |
| (17 | ) | |
| — | | |
| — | | |
| — | | |
| — | |
| Interest expense | |
| 119 | | |
| — | | |
| — | | |
| — | | |
| — | | |
| — | | |
| 119 | |
| Exchange losses | |
| 32 | | |
| — | | |
| — | | |
| — | | |
| — | | |
| — | | |
| 32 | |
| Other expense (income), net | |
| — | | |
| (3 | ) | |
| — | | |
| — | | |
| — | | |
| 3 | | |
| — | |
| | |
| 1,374 | | |
| | | |
| | | |
| | | |
| | | |
| | | |
| 1,248 | |
| Income before income taxes | |
| 111 | | |
| | | |
| | | |
| | | |
| | | |
| | | |
| 237 | |
| Taxes on income | |
| 3 | | |
| 12 | | |
| 4 | | |
| 6 | | |
| 4 | | |
| — | | |
| 29 | |
| Net income | |
$ | 108 | | |
| | | |
| | | |
| | | |
| | | |
| | | |
$ | 208 | |
| | |
| | | |
| | | |
| | | |
| | | |
| | | |
| | | |
| | |
| Earnings per share - Diluted | |
$ | 0.42 | | |
| | | |
| | | |
| | | |
| | | |
| | | |
$ | 0.81 | |
(1) One-time spin-related costs includes
costs from the separation of Merck & Co., Inc., Rahway, NJ, US.
(2) Other costs primarily includes one-time
costs related to inventory step-up adjustments and legal reserves.
Table 4 (continued)
Reconciliation of GAAP Reported to Non-GAAP
Adjusted Information
(Unaudited, $ in millions except per share amounts)
| | |
Year Ended December 31, 2023 | |
| | |
GAAP | | |
Spin related
Costs(1) | | |
Restructuring | | |
Stock-based
Compensation | | |
Amortization | | |
Other(2) | | |
Non-GAAP
Adjusted | |
| Revenues | |
$ | 6,263 | | |
| | | |
| | | |
| | | |
| | | |
| | | |
$ | 6,263 | |
| Cost of sales | |
| 2,515 | | |
| (47 | ) | |
| — | | |
| (17 | ) | |
| (116 | ) | |
| (2 | ) | |
| 2,333 | |
| Gross profit | |
| 3,748 | | |
| | | |
| | | |
| | | |
| | | |
| | | |
| 3,930 | |
| Gross margin | |
| 59.8 | % | |
| | | |
| | | |
| | | |
| | | |
| | | |
| 62.7 | % |
| | |
| | | |
| | | |
| | | |
| | | |
| | | |
| | | |
| | |
| Selling, general and administrative | |
| 1,893 | | |
| (178 | ) | |
| — | | |
| (68 | ) | |
| — | | |
| (91 | ) | |
| 1,556 | |
| Research and development | |
| 528 | | |
| (12 | ) | |
| — | | |
| (16 | ) | |
| — | | |
| — | | |
| 500 | |
| Acquired in-process research and development and milestones | |
| 8 | | |
| — | | |
| — | | |
| — | | |
| — | | |
| — | | |
| 8 | |
| Restructuring costs | |
| 62 | | |
| — | | |
| (62 | ) | |
| — | | |
| — | | |
| — | | |
| — | |
| Interest expense | |
| 527 | | |
| — | | |
| — | | |
| — | | |
| — | | |
| — | | |
| 527 | |
| Exchange losses | |
| 42 | | |
| — | | |
| — | | |
| — | | |
| — | | |
| — | | |
| 42 | |
| Other expense (income), net | |
| 15 | | |
| (17 | ) | |
| — | | |
| — | | |
| — | | |
| — | | |
| (2 | ) |
| | |
| 5,590 | | |
| | | |
| | | |
| | | |
| | | |
| | | |
| 4,964 | |
| Income before income taxes | |
| 673 | | |
| | | |
| | | |
| | | |
| | | |
| | | |
| 1,299 | |
| Taxes on income | |
| (350 | ) | |
| 49 | | |
| 13 | | |
| 17 | | |
| 21 | | |
| 488 | | |
| 238 | |
| Net income | |
$ | 1,023 | | |
| | | |
| | | |
| | | |
| | | |
| | | |
$ | 1,061 | |
| | |
| | | |
| | | |
| | | |
| | | |
| | | |
| | | |
| | |
| Earnings per share - Diluted | |
$ | 3.99 | | |
| | | |
| | | |
| | | |
| | | |
| | | |
$ | 4.14 | |
(1) One-time spin-related costs includes
costs from the separation of Merck & Co., Inc., Rahway, NJ, US.
(2) Other costs primarily includes a tax
benefit resulting from the termination of a Swiss tax arrangement and one-time costs related to inventory step-up adjustments and legal
reserves.
| | |
Year Ended December 31, 2022 | |
| | |
GAAP | | |
Spin related Costs(1) | | |
Restructuring | | |
Stock-based Compensation | | |
Amortization | | |
Other(2) | | |
Non-GAAP Adjusted | |
| Revenues | |
$ | 6,174 | | |
| | | |
| | | |
| | | |
| | | |
| | | |
$ | 6,174 | |
| Cost of sales | |
| 2,294 | | |
| (25 | ) | |
| — | | |
| (13 | ) | |
| (116 | ) | |
| (24 | ) | |
| 2,116 | |
| Gross profit | |
| 3,880 | | |
| | | |
| | | |
| | | |
| | | |
| | | |
| 4,058 | |
| Gross margin | |
| 62.8 | % | |
| | | |
| | | |
| | | |
| | | |
| | | |
| 65.7 | % |
| | |
| | | |
| | | |
| | | |
| | | |
| | | |
| | | |
| | |
| Selling, general and administrative | |
| 1,704 | | |
| (122 | ) | |
| — | | |
| (51 | ) | |
| — | | |
| (21 | ) | |
| 1,510 | |
| Research and development | |
| 471 | | |
| (11 | ) | |
| — | | |
| (11 | ) | |
| — | | |
| (3 | ) | |
| 446 | |
| Acquired in-process research and development and milestones | |
| 107 | | |
| — | | |
| — | | |
| — | | |
| — | | |
| — | | |
| 107 | |
| Restructuring costs | |
| 28 | | |
| — | | |
| (28 | ) | |
| — | | |
| — | | |
| — | | |
| — | |
| Interest expense | |
| 422 | | |
| — | | |
| — | | |
| — | | |
| — | | |
| — | | |
| 422 | |
| Exchange losses | |
| 11 | | |
| — | | |
| — | | |
| — | | |
| — | | |
| — | | |
| 11 | |
| Other expense (income), net | |
| 15 | | |
| (23 | ) | |
| — | | |
| — | | |
| — | | |
| 3 | | |
| (5 | ) |
| | |
| 5,052 | | |
| | | |
| | | |
| | | |
| | | |
| | | |
| 4,607 | |
| Income before income taxes | |
| 1,122 | | |
| | | |
| | | |
| | | |
| | | |
| | | |
| 1,567 | |
| Taxes on income | |
| 205 | | |
| 36 | | |
| 6 | | |
| 13 | | |
| 19 | | |
| 4 | | |
| 283 | |
| Net income | |
$ | 917 | | |
| | | |
| | | |
| | | |
| | | |
| | | |
$ | 1,284 | |
| | |
| | | |
| | | |
| | | |
| | | |
| | | |
| | | |
| | |
| Earnings per share - Diluted | |
$ | 3.59 | | |
| | | |
| | | |
| | | |
| | | |
| | | |
$ | 5.03 | |
(1) One-time spin-related costs includes
costs from the separation of Merck & Co., Inc., Rahway, NJ, US.
(2) Other costs primarily includes one-time
costs related to inventory step-up adjustments, impairment charges and legal reserves.
TABLE 5
Organon & Co.
Reconciliation of GAAP Income Before Income
Taxes to Adjusted EBITDA
(Unaudited, $ in millions)
| | |
Three Months Ended
December 31, | | |
Year Ended
December 31, | |
| | |
2023 | | |
2022 | | |
2023 | | |
2022 | |
| Income before income taxes | |
$ | 104 | | |
$ | 111 | | |
$ | 673 | | |
$ | 1,122 | |
| Depreciation (1) | |
| 30 | | |
| 24 | | |
| 118 | | |
| 96 | |
| Amortization | |
| 28 | | |
| 28 | | |
| 116 | | |
| 116 | |
| Interest expense | |
| 129 | | |
| 119 | | |
| 527 | | |
| 422 | |
| EBITDA | |
$ | 291 | | |
$ | 282 | | |
$ | 1,434 | | |
$ | 1,756 | |
| Restructuring costs | |
| 58 | | |
| 17 | | |
| 62 | | |
| 28 | |
| One-time costs (2) | |
| 73 | | |
| 58 | | |
| 347 | | |
| 226 | |
| Stock-based compensation | |
| 27 | | |
| 23 | | |
| 101 | | |
| 75 | |
| Adjusted EBITDA | |
$ | 449 | | |
$ | 380 | | |
$ | 1,944 | | |
$ | 2,085 | |
| Adjusted EBITDA margin | |
| 28.1 | % | |
| 25.6 | % | |
| 31.0 | % | |
| 33.8 | % |
(1) Excludes accelerated depreciation
included in one-time costs.
(2) One-time costs primarily include costs
incurred in connection with the spin-off of Organon, inventory step-up adjustments, impairment charges and legal reserves.
Exhibit 99.2

[Organon] Confidential Fourth Quarter and Full Year 2023 Earnings Organon

[Organon] Confidential Disclaimer statement Cautionary Note Regarding Forward - Looking Statements Except for historical information, this presentation includes “forward - looking statements” within the meaning of the safe harbo r provisions of the U.S. Private Securities Litigation Reform Act of 1995, including, but not limited to, statements about management’s expectations about Organon’s future financial performance and pr osp ects, including full - year 2024 guidance estimates and predictions regarding other financial information and metrics, franchise and product performance and strategy expectations for future per iod s. Forward - looking statements may be identified by words such "foresees," “expects,” “intends,” “anticipates,” “plans,” “believes,” “seeks,” “estimates,” "would," "potentially," "intends, " " seeks," "will" or words of similar meaning. These statements are based upon the current beliefs and expectations of the company’s management and are subject to significant risks and uncertainties. If under lyi ng assumptions prove inaccurate or risks or uncertainties materialize, actual results may differ materially from those set forth in the forward - looking statements. Risks and uncertainties include, but are not limited to, an inability to fully execute on our product development and commerc ial ization plans within the United States or internationally; an inability to adapt to the industry - wide trend toward highly discounted channels; changes in tax laws or other tax guidance which could adversely af fect our cash tax liability, effective tax rates, and results of operations and lead to greater audit scrutiny; an inability to execute on our business development strategy or realize the benefits of o ur planned acquisitions; efficacy, safety, or other quality concerns with respect to marketed products, including market actions such as recalls, withdrawals, or declining sales; political and social pressur es, or regulatory developments, that adversely impact demand for, availability of, or patient access to contraception or fertility products; general economic factors, including recessionary pressures, in ter est rate and currency exchange rate fluctuations; general industry conditions and competition; the impact of pharmaceutical industry regulation and health care legislation in the United States and intern ati onally; global trends toward health care cost containment; technological advances; new products and patents attained by competitors; the impact of higher selling and promotional costs; any failure b y O rganon to obtain an additional period of market exclusivity in the United States for Nexplanon subsequent to the expiration of certain key patents in 2027; challenges inherent in new product developm ent , including obtaining regulatory approval; the company’s ability to accurately predict its future financial results and performance; manufacturing difficulties or delays; financial instability of international economies and sovereign risk; difficulties developing and sustaining relationships with commercial counterparties; dependence on the effectiveness of the company’s patents and other protections for innovative products; and the exposure to litigation, including patent litigation, and/or regulatory actions. The company undertakes no obligation to publicly update any forward - looking statement, whether as a result of new information, f uture events or otherwise. Additional factors that could cause results to differ materially from those described in the forward - looking statements can be found in the company’s filings with the Securiti es and Exchange Commission ("SEC"), including the company’s most recent Annual Report on Form 10 - K and subsequent SEC filings, available at the SEC’s Internet site ( www.sec.gov ). See Slides 22 - 27 of this presentation for a reconciliation of non - GAAP measures. 2

[Organon] Confidential Disclaimer statement, cont. Cautionary Note Regarding Non - GAAP Financial Measures This presentation contains “non - GAAP financial measures,” which are financial measures that either exclude or include amounts th at are correspondingly not excluded or included in the most directly comparable measures calculated and presented in accordance with U.S. generally accepted accounting principles (“GAAP”). Speci fic ally, the company makes use of the non - GAAP financial measures Adjusted EBITDA, Adjusted gross margin, Adjusted gross profit, Adjusted net income, and Adjusted diluted EPS, which are not r eco gnized terms under GAAP and are presented only as a supplement to the company’s GAAP financial statements. This presentation also provides certain measures that exclude the impact of foreign exc hange. We calculate foreign exchange by converting our current - period local currency financial results using the prior period average currency rates and comparing these adjusted amounts to ou r current - period results. The company believes that these non - GAAP financial measures help to enhance an understanding of the company’s financial performance. However, the presentation of thes e m easures has limitations as an analytical tool and should not be considered in isolation, or as a substitute for the company’s results as reported under GAAP. Because not all companies use i den tical calculations, the presentations of these non - GAAP measures may not be comparable to other similarly titled measures of other companies. You should refer to Slides 22 - 27 of this press releas e for relevant definitions and reconciliations of non - GAAP financial measures contained herein to the most directly comparable GAAP measures. In addition, the company’s full - year 2024 guidance measures (other than revenue) are provided on a non - GAAP basis because the co mpany is unable to reasonably predict certain items contained in the GAAP measures. Such items include, but are not limited to, acquisition related expenses, restructuring and related expens es, stock - based compensation, the ultimate outcome of legal proceedings, unusual gains and losses, the occurrence of matters creating GAAP tax impacts and other items not reflective of the company's on going operations. The company uses non - GAAP financial measures in its operational and financial decision making, and believes that it is useful to exclude certain items in order to focus on what it regards to be a more meaningful representation of the underlying operating performance of the business. 3

[Organon] Confidential Full Year 2023 highlights 4 • Revenue of $6.3 billion, up 3% ex - FX ◦ All three franchises contributed to growth • Adjusted EBITDA of $1.9 billion • Diluted EPS of $3.99, Adjusted Diluted EPS of $4.14 • 2024 expected to represent third consecutive year of revenue growth ex - FX; expect stable to improving Adjusted EBITDA margins for full year 2024 See Slides 22 - 27 of this presentation for a reconciliation of non - GAAP measures.

[Organon] Confidential Women's Health • Fertility grew 9% ex - FX for full year 2023 • Jada more than doubled revenue ex - FX • Nexplanon positioned for strong 2024 • Recent launch of Xaciato • Franchise grew 24% ex - FX for FY 2023 • Double digit growth in both Renflexis and Ontruzant in 2023 • Hadlima leads all Humira* biosimilars • Revenue up 2% ex - FX for full year 2023 • Licensing agreement for migraine assets in Europe • Expect to achieve flat performance in 2024 5 Established Brands Biosimilars Women's Health * Humira is a trademark registered in the United States in the name of AbbVie Biotechnology Ltd.

[Organon] Confidential Durability of Established Brands Expanding manufacturing Stemming price erosion Durability and diversity of brands LCM / entrepreneurial focus Established Brands 6 Q1 Q2 Q3 Q4

[Organon] Confidential 7 Multiple market opportunities to drive continued stabilization across franchise Key Themes & Highlights New market launches of existing products Over 30 unique opportunities identified since spin and in progress, across 20 plus markets covering all regions – LAMERA, APJ, EUCAN, China, US Product indication expansions New channels & go - to - market models New pack size launches Clone, second brand & white box product launches Investment in select brands & leveraging brand equity

[Organon] Confidential Solid performance across all geographies $ mil Q4 - 23 Q4 - 22 Actual VPY Ex - FX VPY FY 2023 FY 2022 Actual VPY Ex - FX VPY Europe and Canada 414 389 6% 1% 1,673 1,631 3% 2% United States 411 394 4% 4% 1,478 1,437 3% 3% Asia Pacific and Japan 261 256 2% 3% 1,129 1,143 (1)% 3% China 203 196 4% 4% 864 917 (6)% (1)% Latin America, Middle East, Russia and Africa 279 230 21% 29% 965 895 8% 13% Other (1) 30 20 53% 45% 154 151 2% — % Total Revenues 1,598 1,485 8% 8% 6,263 6,174 1% 3% 8 (1) Other includes manufacturing sales to Merck & Co., Inc., Rahway, NJ, USA and other third parties.

[Organon] Confidential ~ + 8% reported and ex - FX $ mil 9 Q4 2024 revenue: strong volume growth more than offset LOE and VBP impact (1) LOE = Loss of Exclusivity (2) VBP = Volume Based Procurement (3) Other includes manufacturing sales to Merck & Co., Inc., Rahway, NJ, USA and other third parties (3) (1) (2) ~ ~ ~ ~ ~ ~ $1,598

[Organon] Confidential +1.4% reported +3.3% ex - FX $ mil 10 FY 2024 revenue: strong volume growth offset LOE, VBP and pricing (1) LOE = Loss of Exclusivity (2) VBP = Volume Based Procurement (3) Other includes manufacturing sales to Merck & Co., Inc., Rahway, NJ, USA and other third parties (3) (1) (2) FX ~(190) bps headwind to growth for FY ~ ~ ~ ~ 420 ~ ~

[Organon] Confidential Women’s Health Women’s Health Revenues $ mil Q4 - 23 Q4 - 22 Act VPY Ex - FX VPY FY 2023 FY 2022 Act VPY Ex - FX VPY Nexplanon ® (contraception) 231 239 (4)% (3)% 830 834 (1)% 1% NuvaRing ® (contraception) 35 40 (14)% (12)% 152 173 (12)% (11)% Marvelon Œ / Mercilon Œ (contraception) 37 24 51% 51% 134 110 22% 24% Follistim ® (fertility) 83 50 64% 63% 262 229 14% 16% Ganirelix Acetate Injection (fertility) 22 25 (15)% (14)% 110 123 (10)% (8)% Jada ® (device) 13 8 56% 56% 43 20 113% 113% Other Women's Health products 44 46 1% (1)% 171 184 (7)% (6)% Total Women's Health 465 433 7% 8% 1,702 1,673 2% 3% 11 • Growth in Fertility, Marvelon/Mercilon , Jada offset generic competition for NuvaRing • Modest contribution from Nexplanon driven by one - time headwinds Totals may not foot due to rounding . Trademarks appearing above in italics are trademarks of, or are used under license by, the Organon group of companies .

[Organon] Confidential Biosimilars Biosimilars Revenues $ mil Q4 - 23 Q4 - 22 Act VPY Ex - FX VPY FY 2023 FY 2022 Act VPY Ex - FX VPY Renflexis ® 77 60 28% 28% 278 226 23% 24% Ontruzant ® 62 35 78% 76% 155 122 28% 27% Brenzys Œ 28 23 20% 20% 73 75 (2)% 1% Aybintio Œ 9 10 (11)% (17)% 43 39 10% 8% Hadlima Œ 23 6 NM NM 44 19 125% 130% Biosimilars 199 134 49% 48% 593 481 23% 24% 12 • Second year of double - digit revenue growth • Renflexis grew for 6th consecutive year, Ontruzant benefited from favorable timing of tenders • Hadlima uptake continues following U.S. launch Totals may not foot due to rounding . Trademarks appearing above in italics are trademarks of, or are used under license by, the Organon group of companies .

[Organon] Confidential Established Brands Established Brands Revenues $ mil Q4 - 23 Q4 - 22 Act VPY Ex - FX VPY FY 2023 FY 2022 Act VPY Ex - FX VPY Cardiovascular 322 328 (2)% (4)% 1,460 1,498 (3)% (1)% Respiratory 274 247 11% 13% 1,064 1,037 3% 6% Non - Opioid Pain, Bone & Derm 187 185 1% 3% 782 788 (1)% 2% Other 133 128 4% 2% 541 552 (2)% 1% Total Est. Brands 915 888 3% 3% 3,847 3,874 (1)% 2% 13 • Ex - FX growth of 2% for full - year 2023 despite headwinds in China • Volume growth continues to outpace price pressure Totals may not foot due to rounding .

[Organon] Confidential Gross Margin drove profitability variance All numbers presented on non - GAAP basis (1) Q4 - 23 Q4 - 22 Actual VPY FY 2023 FY 2022 Actual VPY Revenue 1,598 1,485 8% 6,263 6,174 1% Cost of sales 634 548 16% 2,333 2,116 10% Adjusted Gross profit 964 937 3% 3,930 4,058 (3)% Selling, general and administrative 401 414 (3)% 1,556 1,510 3% R&D 127 135 (6)% 500 446 12% Acquired IPR&D and milestones — — — 8 107 (93)% Total research and development including IPR&D 127 135 (6)% 508 553 (8)% Adjusted EBITDA 449 380 18% 1,944 2,085 (7)% Adjusted diluted EPS 0.88 0.81 8% 4.14 5.03 (18)% Per share impact to diluted EPS from acquired IPR&D and milestones — — — (0.03) (0.33) (91)% Adjusted Gross margin 60.3% 63.1% 62.7% 65.7% Adjusted EBITDA margin 28.1% 25.6% 31.0% 33.8% 14 (1) See Slides 22 - 27 of this presentation for a reconciliation of non - GAAP measures to their respective GAAP measures.

[Organon] Confidential Significant improvement in working capital in Q4 FY 2023 close to $1 billion free cash flow before one - time, spin - related costs 15 (1) Free cash flow represents net cash flows provided by operating activities plus capital expenditures, acquired in - process researc h and development, and the effect of exchange rate changes on cash and cash equivalents. (USD millions) Q1 Q2 Q3 Q4 2023 Adjusted EBITDA $518 $530 $447 $449 $1,944 Less: Net cash interest expense (65) (179) (68) (184) (496) Less: Cash taxes (61) (29) (55) 10 (135) Less: Change in net working capital (207) (233) (52) 267 (225) Less: CapEx (23) (33) (37) (55) (148) Free Cash Flow Before One Time Costs $162 $56 $235 $487 $940 Less: One time spin - related costs (82) (94) (77) (91) (344) Less: Other one - time costs* 0 0 0 (35) (35) Free Cash Flow (1) $80 $(38) $158 $362 $562 *Represents the first installment pertaining to the settlement of the Microspherix litigation.

[Organon] Confidential 16 Bank covenant (*) net leverage ratio ~4.1x Voluntary debt repayments of $450M since spin $ mil Dec 2021 Dec 2022 Mar 2023 Jun 2023 Sept 2023 Dec 2023 Cash and cash equivalents 737 706 459 326 414 693 Gross Debt (1) 9,134 8,913 8,711 8,730 8,654 8,760 Net Debt (1) 8,397 8,207 8,252 8,404 8,240 8,067 (*) The definition of net debt in the company's credit agreement excludes unamortized fees but includes capitalized lease ob lig ations. Additionally, the LTM EBITDA calculation excludes acquired IPR&D and milestone charges. (1) Debt figures are net of discounts and unamortized fees of $124 million, $105 million, $97 million, $93 million, $87 milli on and $84 million as of December 31, 2021, December 31, 2022, March 31, 2023, June 30, 2023, September 30, 2023, and December 31, 2023, respectively.

[Organon] Confidential 2024 expected to be third consecutive year of revenue growth at constant currency $ mil 17 (1) LOE = Loss of Exclusivity (2) VBP = Value Based Pricing (3) Other includes manufacturing sales to Merck & Co., Inc., Rahway, NJ, USA and other third parties (1) (2) (3) ~(1.0%) to +3.8% reported, ~0.6% to +4.6% growth at constant currency Fx~(80) - (160) bps headwind to growth in 2024 ~ ~ ~ ~ ~ ~ $6,200 - $6,500
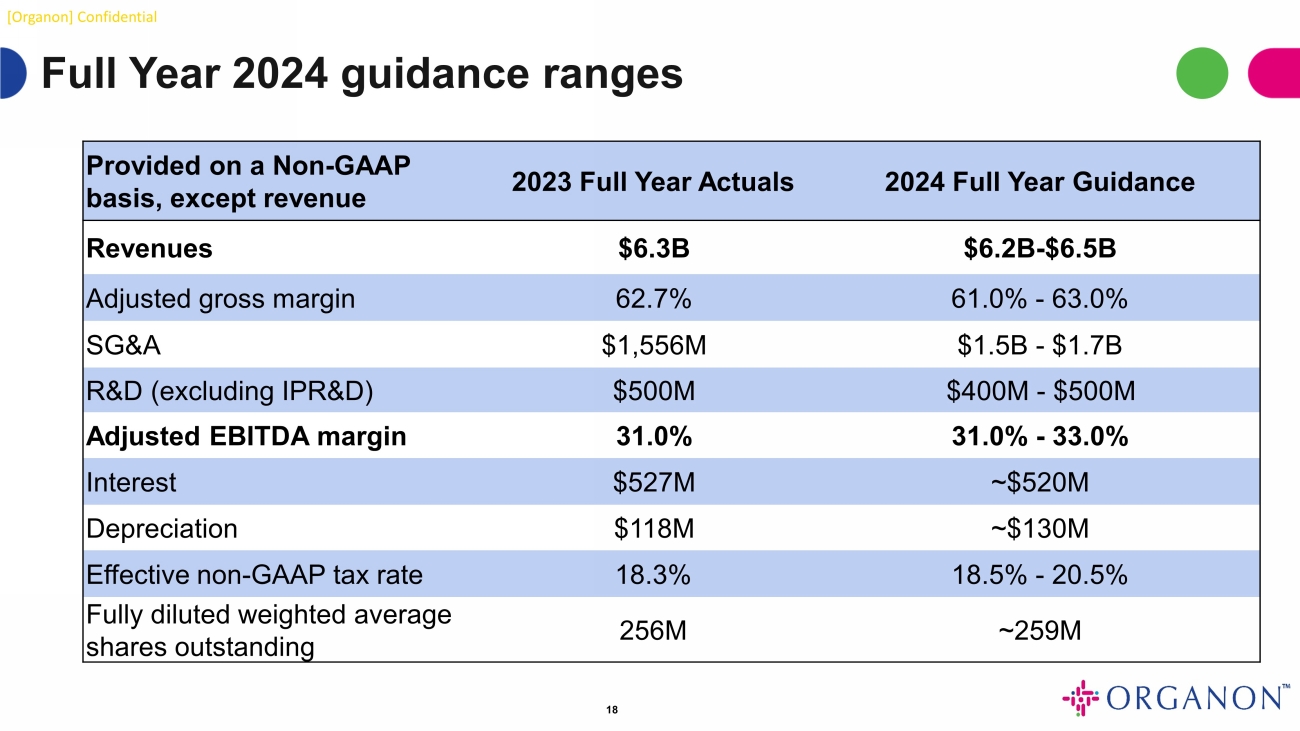
[Organon] Confidential Full Year 2024 guidance ranges 18 Provided on a Non - GAAP basis, except revenue 2023 Full Year Actuals 2024 Full Year Guidance Revenues $6.3B $6.2B - $6.5B Adjusted gross margin 62.7% 61.0% - 63.0% SG&A $1,556M $1.5B - $1.7B R&D (excluding IPR&D) $500M $400M - $500M Adjusted EBITDA margin 31.0% 31.0% - 33.0% Interest $527M ~$520M Depreciation $118M ~$130M Effective non - GAAP tax rate 18.3% 18.5% - 20.5% Fully diluted weighted average shares outstanding 256M ~259M

[Organon] Confidential Q&A

[Organon] Confidential Appendix

[Organon] Confidential Franchise performance $ mil Q4 - 2023 Q4 - 2022 Actual VPY Ex - FX VPY FY 2023 FY 2022 Actual VPY Ex - FX VPY Women’s Health 465 433 7% 8% 1,702 1,673 2% 3% Biosimilars 199 134 49% 48% 593 481 23% 24% Est. Brands 915 888 3% 3% 3,847 3,874 (1)% 2% Other (1) 19 30 (37)% (42)% 121 146 (17)% (19)% Total Revenues 1,598 1,485 8% 8% 6,263 6,174 1% 3% (1) Other includes manufacturing sales to Merck & Co., Inc., Rahway, NJ, USA and other third parties. 21

[Organon] Confidential Reconciliation of GAAP Reported to Non - GAAP Adjusted Information 22 Three Months Ended December 31, 2023 Unaudited, $ in millions except per share amounts GAAP Spin related Costs (1) Restructuring Stock - based Compensation Amortization Other (2) Non - GAAP Adjusted Revenues $ 1,598 $ 1,598 Cost of sales 683 (17) — (4) (28) — 634 Gross profit 915 964 Gross margin 57.3 % 60.3 % Selling, general and administrative 469 (47) — (18) — (3) 401 Research and development 134 (2) — (5) — — 127 Restructuring costs 58 — (58) — — — — Interest expense 129 — — — — — 129 Exchange losses 17 — — — — — 17 Other expense (income), net 4 (4) — — — — — 1,494 1,308 Income before income taxes 104 290 Taxes on income (442) 7 12 5 5 477 64 Net income $ 546 $ 226 Earnings per share - Diluted $ 2.13 $ 0.88 ( 1 ) One - time spin - related costs includes costs from the separation of Merck & Co . , Inc . , Rahway, NJ, US . (2) Other costs primarily includes a tax benefit resulting from the termination of a Swiss tax arrangement and one - time costs re lated to inventory step - up adjustments and legal reserves.

[Organon] Confidential Reconciliation of GAAP Reported to Non - GAAP Adjusted Information 23 Year Ended December 31, 2023 Unaudited, $ in millions except per share amounts GAAP Spin related Costs (1) Restructuring Stock - based Compensation Amortization Other (2) Non - GAAP Adjusted Revenues $ 6,263 $ 6,263 Cost of sales 2,515 (47) — (17) (116) (2) 2,333 Gross profit 3,748 3,930 Gross margin 59.8 % 62.7 % Selling, general and administrative 1,893 (178) — (68) — (91) 1,556 Research and development 528 (12) — (16) — — 500 Acquired in - process research and development and milestones 8 — — — — — 8 Restructuring costs 62 — (62) — — — — Interest expense 527 — — — — — 527 Exchange losses 42 — — — — — 42 Other expense (income), net 15 (17) — — — — (2) 5,590 4,964 Income before income taxes 673 1,299 Taxes on income (350) 49 13 17 21 488 238 Net income $ 1,023 $ 1,061 Earnings per share - Diluted $ 3.99 $ 4.14 ( 1 ) One - time spin - related costs includes costs from the separation of Merck & Co . , Inc . , Rahway, NJ, US . ( 2 ) Other costs primarily includes a tax benefit resulting from the termination of a Swiss tax arrangement and one - time costs related to inventory step - up adjustments and legal reserves .

[Organon] Confidential Reconciliation of GAAP Reported to Non - GAAP Adjusted Information 24 Three Months Ended December 31, 2022 Unaudited, $ in millions except per share amounts GAAP Spin related Costs (1) Restructuring Stock - based Compensation Amortization Other (2) Non - GAAP Adjusted Revenues $ 1,485 $ 1,485 Cost of sales 594 (7) — (4) (28) (7) 548 Gross profit 891 937 Gross margin 60.0 % 63.1 % Selling, general and administrative 470 (36) — (16) — (4) 414 Research and development 142 (3) — (3) — (1) 135 Restructuring costs 17 — (17) — — — — Interest expense 119 — — — — — 119 Exchange losses 32 — — — — — 32 Other expense (income), net — (3) — — — 3 — 1,374 1,248 Income before income taxes 111 237 Taxes on income 3 12 4 6 4 — 29 Net income $ 108 $ 208 Earnings per share - Diluted $ 0.42 $ 0.81 ( 1 ) One - time spin - related costs includes costs from the separation of Merck & Co . , Inc . , Rahway, NJ, US . ( 2 ) Other costs primarily includes one - time costs related to inventory step - up adjustments and legal reserves .

[Organon] Confidential Reconciliation of GAAP Reported to Non - GAAP Adjusted Information 25 Year Ended December 31, 2022 Unaudited, $ in millions except per share amounts GAAP Spin related Costs (1) Restructuring Stock - based Compensation Amortization Other (2) Non - GAAP Adjusted Revenues $ 6,174 $ 6,174 Cost of sales 2,294 (25) — (13) (116) (24) 2,116 Gross profit 3,880 4,058 Gross margin 62.8 % 65.7 % Selling, general and administrative 1,704 (122) — (51) — (21) 1,510 Research and development 471 (11) — (11) — (3) 446 Acquired in - process research and development and milestones 107 — — — — — 107 Restructuring costs 28 — (28) — — — — Interest expense 422 — — — — — 422 Exchange losses 11 — — — — — 11 Other expense (income), net 15 (23) — — — 3 (5) 5,052 4,607 Income before income taxes 1,122 1,567 Taxes on income 205 36 6 13 19 4 283 Net income $ 917 $ 1,284 Earnings per share - Diluted $ 3.59 $ 5.03 ( 1 ) One - time spin - related costs includes costs from the separation of Merck & Co . , Inc . , Rahway, NJ, US . ( 2 ) Other costs primarily includes one - time costs related to inventory step - up adjustments, impairment charges and legal reserves .

[Organon] Confidential Income before income taxes to Adjusted EBITDA Unaudited, $ in millions Q4 - 2023 Q4 - 2022 Income before income taxes 104 111 Depreciation (1) 30 24 Amortization 28 28 Interest expense 129 119 EBITDA 291 282 Restructuring costs 58 17 One - time costs (2) 73 58 Stock - based compensation 27 23 Adjusted EBITDA 449 380 Adjusted EBITDA margin 28.1 % 25.6 % 26 ( 1 ) Excludes accelerated depreciation included in one - time costs . ( 2 ) One - time costs primarily include costs incurred in connection with the spin - off of Organon, inventory step up adjustments and legal reserves .

[Organon] Confidential Income before income taxes to Adjusted EBITDA Unaudited, $ in millions FY 2023 FY 2022 Income before income taxes 673 1,122 Depreciation (1) 118 96 Amortization 116 116 Interest expense 527 422 EBITDA 1,434 1,756 Restructuring costs 62 28 One - time costs (2) 347 226 Stock - based compensation 101 75 Adjusted EBITDA 1,944 2,085 Adjusted EBITDA margin 31.0 % 33.8 % 27 ( 1 ) Excludes accelerated depreciation included in one - time costs . ( 2 ) One - time costs primarily include costs incurred in connection with the spin - off of Organon, inventory step up adjustments and legal reserves .

[Organon] Confidential Number of products 14 5 51 Women’s Health Biosimilars Established Brands Broad and diverse portfolio 28 TM TM

[Organon] Confidential Source: Symphony Healthcare Analytics , LLC (Jul 14, 2023 - Jan 26, 2024) 2023 U.S. Weekly Total Prescriptions (TRx) 29 Hadlima gaining ground
v3.24.0.1
| X |
- DefinitionBoolean flag that is true when the XBRL content amends previously-filed or accepted submission.
| Name: |
dei_AmendmentFlag |
| Namespace Prefix: |
dei_ |
| Data Type: |
xbrli:booleanItemType |
| Balance Type: |
na |
| Period Type: |
duration |
|
| X |
- DefinitionFor the EDGAR submission types of Form 8-K: the date of the report, the date of the earliest event reported; for the EDGAR submission types of Form N-1A: the filing date; for all other submission types: the end of the reporting or transition period. The format of the date is YYYY-MM-DD.
| Name: |
dei_DocumentPeriodEndDate |
| Namespace Prefix: |
dei_ |
| Data Type: |
xbrli:dateItemType |
| Balance Type: |
na |
| Period Type: |
duration |
|
| X |
- DefinitionThe type of document being provided (such as 10-K, 10-Q, 485BPOS, etc). The document type is limited to the same value as the supporting SEC submission type, or the word 'Other'.
| Name: |
dei_DocumentType |
| Namespace Prefix: |
dei_ |
| Data Type: |
dei:submissionTypeItemType |
| Balance Type: |
na |
| Period Type: |
duration |
|
| X |
- DefinitionAddress Line 1 such as Attn, Building Name, Street Name
| Name: |
dei_EntityAddressAddressLine1 |
| Namespace Prefix: |
dei_ |
| Data Type: |
xbrli:normalizedStringItemType |
| Balance Type: |
na |
| Period Type: |
duration |
|
| X |
- DefinitionAddress Line 2 such as Street or Suite number
| Name: |
dei_EntityAddressAddressLine2 |
| Namespace Prefix: |
dei_ |
| Data Type: |
xbrli:normalizedStringItemType |
| Balance Type: |
na |
| Period Type: |
duration |
|
| X |
- Definition
+ References
+ Details
| Name: |
dei_EntityAddressCityOrTown |
| Namespace Prefix: |
dei_ |
| Data Type: |
xbrli:normalizedStringItemType |
| Balance Type: |
na |
| Period Type: |
duration |
|
| X |
- DefinitionCode for the postal or zip code
| Name: |
dei_EntityAddressPostalZipCode |
| Namespace Prefix: |
dei_ |
| Data Type: |
xbrli:normalizedStringItemType |
| Balance Type: |
na |
| Period Type: |
duration |
|
| X |
- DefinitionName of the state or province.
| Name: |
dei_EntityAddressStateOrProvince |
| Namespace Prefix: |
dei_ |
| Data Type: |
dei:stateOrProvinceItemType |
| Balance Type: |
na |
| Period Type: |
duration |
|
| X |
- DefinitionA unique 10-digit SEC-issued value to identify entities that have filed disclosures with the SEC. It is commonly abbreviated as CIK. Reference 1: http://www.xbrl.org/2003/role/presentationRef
-Publisher SEC
-Name Exchange Act
-Number 240
-Section 12
-Subsection b-2
| Name: |
dei_EntityCentralIndexKey |
| Namespace Prefix: |
dei_ |
| Data Type: |
dei:centralIndexKeyItemType |
| Balance Type: |
na |
| Period Type: |
duration |
|
| X |
- DefinitionIndicate if registrant meets the emerging growth company criteria. Reference 1: http://www.xbrl.org/2003/role/presentationRef
-Publisher SEC
-Name Exchange Act
-Number 240
-Section 12
-Subsection b-2
| Name: |
dei_EntityEmergingGrowthCompany |
| Namespace Prefix: |
dei_ |
| Data Type: |
xbrli:booleanItemType |
| Balance Type: |
na |
| Period Type: |
duration |
|
| X |
- DefinitionCommission file number. The field allows up to 17 characters. The prefix may contain 1-3 digits, the sequence number may contain 1-8 digits, the optional suffix may contain 1-4 characters, and the fields are separated with a hyphen.
| Name: |
dei_EntityFileNumber |
| Namespace Prefix: |
dei_ |
| Data Type: |
dei:fileNumberItemType |
| Balance Type: |
na |
| Period Type: |
duration |
|
| X |
- DefinitionTwo-character EDGAR code representing the state or country of incorporation.
| Name: |
dei_EntityIncorporationStateCountryCode |
| Namespace Prefix: |
dei_ |
| Data Type: |
dei:edgarStateCountryItemType |
| Balance Type: |
na |
| Period Type: |
duration |
|
| X |
- DefinitionThe exact name of the entity filing the report as specified in its charter, which is required by forms filed with the SEC. Reference 1: http://www.xbrl.org/2003/role/presentationRef
-Publisher SEC
-Name Exchange Act
-Number 240
-Section 12
-Subsection b-2
| Name: |
dei_EntityRegistrantName |
| Namespace Prefix: |
dei_ |
| Data Type: |
xbrli:normalizedStringItemType |
| Balance Type: |
na |
| Period Type: |
duration |
|
| X |
- DefinitionThe Tax Identification Number (TIN), also known as an Employer Identification Number (EIN), is a unique 9-digit value assigned by the IRS. Reference 1: http://www.xbrl.org/2003/role/presentationRef
-Publisher SEC
-Name Exchange Act
-Number 240
-Section 12
-Subsection b-2
| Name: |
dei_EntityTaxIdentificationNumber |
| Namespace Prefix: |
dei_ |
| Data Type: |
dei:employerIdItemType |
| Balance Type: |
na |
| Period Type: |
duration |
|
| X |
- DefinitionLocal phone number for entity.
| Name: |
dei_LocalPhoneNumber |
| Namespace Prefix: |
dei_ |
| Data Type: |
xbrli:normalizedStringItemType |
| Balance Type: |
na |
| Period Type: |
duration |
|
| X |
- DefinitionBoolean flag that is true when the Form 8-K filing is intended to satisfy the filing obligation of the registrant as pre-commencement communications pursuant to Rule 13e-4(c) under the Exchange Act. Reference 1: http://www.xbrl.org/2003/role/presentationRef
-Publisher SEC
-Name Exchange Act
-Number 240
-Section 13e
-Subsection 4c
| Name: |
dei_PreCommencementIssuerTenderOffer |
| Namespace Prefix: |
dei_ |
| Data Type: |
xbrli:booleanItemType |
| Balance Type: |
na |
| Period Type: |
duration |
|
| X |
- DefinitionBoolean flag that is true when the Form 8-K filing is intended to satisfy the filing obligation of the registrant as pre-commencement communications pursuant to Rule 14d-2(b) under the Exchange Act. Reference 1: http://www.xbrl.org/2003/role/presentationRef
-Publisher SEC
-Name Exchange Act
-Number 240
-Section 14d
-Subsection 2b
| Name: |
dei_PreCommencementTenderOffer |
| Namespace Prefix: |
dei_ |
| Data Type: |
xbrli:booleanItemType |
| Balance Type: |
na |
| Period Type: |
duration |
|
| X |
- DefinitionTitle of a 12(b) registered security. Reference 1: http://www.xbrl.org/2003/role/presentationRef
-Publisher SEC
-Name Exchange Act
-Number 240
-Section 12
-Subsection b
| Name: |
dei_Security12bTitle |
| Namespace Prefix: |
dei_ |
| Data Type: |
dei:securityTitleItemType |
| Balance Type: |
na |
| Period Type: |
duration |
|
| X |
- DefinitionName of the Exchange on which a security is registered. Reference 1: http://www.xbrl.org/2003/role/presentationRef
-Publisher SEC
-Name Exchange Act
-Number 240
-Section 12
-Subsection d1-1
| Name: |
dei_SecurityExchangeName |
| Namespace Prefix: |
dei_ |
| Data Type: |
dei:edgarExchangeCodeItemType |
| Balance Type: |
na |
| Period Type: |
duration |
|
| X |
- DefinitionBoolean flag that is true when the Form 8-K filing is intended to satisfy the filing obligation of the registrant as soliciting material pursuant to Rule 14a-12 under the Exchange Act. Reference 1: http://www.xbrl.org/2003/role/presentationRef
-Publisher SEC
-Name Exchange Act
-Section 14a
-Number 240
-Subsection 12
| Name: |
dei_SolicitingMaterial |
| Namespace Prefix: |
dei_ |
| Data Type: |
xbrli:booleanItemType |
| Balance Type: |
na |
| Period Type: |
duration |
|
| X |
- DefinitionTrading symbol of an instrument as listed on an exchange.
| Name: |
dei_TradingSymbol |
| Namespace Prefix: |
dei_ |
| Data Type: |
dei:tradingSymbolItemType |
| Balance Type: |
na |
| Period Type: |
duration |
|
| X |
- DefinitionBoolean flag that is true when the Form 8-K filing is intended to satisfy the filing obligation of the registrant as written communications pursuant to Rule 425 under the Securities Act. Reference 1: http://www.xbrl.org/2003/role/presentationRef
-Publisher SEC
-Name Securities Act
-Number 230
-Section 425
| Name: |
dei_WrittenCommunications |
| Namespace Prefix: |
dei_ |
| Data Type: |
xbrli:booleanItemType |
| Balance Type: |
na |
| Period Type: |
duration |
|
Organon (NYSE:OGN)
Historical Stock Chart
Von Apr 2024 bis Mai 2024

Organon (NYSE:OGN)
Historical Stock Chart
Von Mai 2023 bis Mai 2024
