By Ellie Ismailidou and Victor Reklaitis, MarketWatch
Stocks do a 180-degree turn as oil gains vanish
U.S. stocks relinquished sizable gains in afternoon trade,
retreating as a rally in crude-oil prices evaporated.
Soaring shares in DuPont (DD) and Dow Chemical Co. (DOW),
following news they are in advanced talks to forge a megamerger,
(http://www.marketwatch.com/story/dupont-and-dow-chemical-near-merger-wsj-2015-12-08)
capped losses in the main stock indexes and had been one of key
factors driving the market higher earlier in the session.
The Dow Jones Industrial Average was about 58 points, or 0.3%,
lower at 17,511, after seeing a gain just shy of 200 points.
Meanwhile, the S&P 500 index was down 12 points, or 0.6%, to
2,050, and the Nasdaq Composite fell 64 points, or 1.3%, to
5,033.
Advances in Dow industrials's component DuPont (DD), up about
11%, and Chevron Corp. (CVX), up 1.3%%, had been contributing to
the lion's share of the Dow industrials' forward momentum.
This "serious M&A activity is propelling stocks off their
bottom range" but also points to the fact that "finding organic
revenue and earnings growth is getting harder for companies in the
industrial space," said Jim Tierney, chief investment officer of
AllianceBernstein's Concentrated U.S. Growth Fund.
A rebound in oil-and-commodity prices
(http://www.marketwatch.com/story/crude-prices-pare-losses-but-global-oversupply-not-going-away-2015-12-09)
boosted energy and materials stocks had extended advances for the
main indexes Wednesday morning, following a two-day slump largely
driven by oil's tumble
(http://www.marketwatch.com/story/us-stocks-set-to-extend-slump-after-weak-china-data-2015-12-08).
But Oil futures turned lower on Wednesday, reversing course from
an earlier rally, as a big weekly climb in U.S. distillate supplies
dragged prices for heating oil down by 1.8%, weighing on stocks,
according to data from the Energy Information Administration.
However, the move lower may be fleeting given that energy and
materials--among the biggest losers for the S&P 500
Tuesday--were leading the S&P 500's 10 main sectors. Materials
were up 3.2%, while the energy sector was seeing an advance of
1.5%.
Oil futures (XLE) were modestly lower after the weekly petroleum
supply EIA report. Tuesday night, oil gained after the industry
group American Petroleum Institute said crude inventories may have
decreased by 1.9 million barrels in the week ending Dec. 4.
Analysts continue to warn that a global glut will keep any rise
limited.
If stocks start to show that they can have a little strength
even in the face of what is clearly an issue, said Ian Winer,
director of equity trading at Wedbush Securities, referring to the
supply glut in oil.
"You don't have to be a rocket scientist to come to a conclusion
that as supply falls and demand rises, the two lines will
eventually cross and balance will be restored. The question, of
course, is when not if," said James Meyer, James Meyer, chief
investment officer at Tower Bridge Advisors, in emailed
comments.
The general consensus is that oil will rebound sometime in the
second half of 2016, but "the slow decline in supply could stretch
that out a bit longer," Meyer said.
News that oil companies cut their dividend, such as Kinder
Morgan Inc. (KMI), were at the same time alarming and an indication
that the energy market is closer to the end of the cycle, analysts
said, causing Kinder Morgan's stocks to rally on the news.
Also read: 'Vast majority' of dividends at European oil firms
safe even at $40 oil, says Barclays
(http://www.marketwatch.com/story/vast-majority-of-dividends-at-european-oil-firms-safe-even-at-40-oil-says-barclays-2015-12-09)
Still, many analysts credited Wednesday's rebound to a normal
trading bounce to ease short term oversold conditions, assisted by
better than expected economic data from Japan and China.
(http://www.marketwatch.com/story/asia-shares-continue-to-fall-despite-upbeat-data-2015-12-09)
"Markets came in oversold with many international equity indices
over two standard deviations below their 20-day moving average,"
said Ilya Feygin, managing director at broker dealer WallachBeth
Capital.
Individual movers: Kinder Morgan Inc. (KMI) climbed 4%, paring
earlier losses, after the energy giant slashed its dividend late
Tuesday
(http://www.marketwatch.com/story/kinder-morgan-shares-fall-5-after-dividend-drop-2015-12-08).
Yahoo Inc. (YHOO) fell 3.4% after the Internet company confirmed
reports
(http://www.marketwatch.com/story/yahoo-suspends-plan-to-spinoff-its-alibaba-share-stake-will-evaluate-other-deals-2015-12-09)
it was suspending its plan to spinoff its stake in Chinese
e-commerce giant Alibaba Group Holding Ltd. (BABA).
Retailers came under pressure again Wednesday after Costco
Wholesale Corp. (COST) and Lululemon Athletica Inc. (LULU)
continued the trend of weak results. Costco's share fell 4% as the
warehouse retailer posted weaker-than-anticipated quarterly profit
(http://www.marketwatch.com/story/costo-quarterly-earnings-fall-more-than-3-2015-12-09)
while Lululemon was down 8.6% after the sportswear seller reduced
its sales outlook.
(http://www.marketwatch.com/story/lululemons-stock-drops-after-profit-outlook-cut-2015-12-09)
Other markets:European equities
(http://www.marketwatch.com/story/commodity-shares-lead-european-stocks-lower-for-second-straight-day-2015-12-09)
fell for a second straight session, with mining and oil stocks
leading the way down. Most Asian stocks
(http://www.marketwatch.com/story/asian-stocks-end-mixed-after-us-jobs-report-2015-12-07)closed
with losses
(http://www.marketwatch.com/story/asia-shares-continue-to-fall-despite-upbeat-data-2015-12-09),
with better-than-expected economic reports failing to stem the
selling. A key dollar index declined about 0.7%, aiding
dollar-denominated commodities. Gold edged higher.
Economic data: U.S. wholesale inventories fell 0.1% in October,
missing economists' expectations.
There are no top-tier U.S. economic reports expected on
Wednesday.
(END) Dow Jones Newswires
December 09, 2015 12:30 ET (17:30 GMT)
Copyright (c) 2015 Dow Jones & Company, Inc.
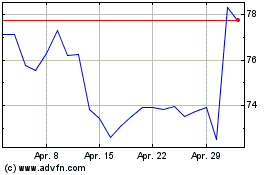
DuPont de Nemours (NYSE:DD)
Historical Stock Chart
Von Jun 2024 bis Jul 2024

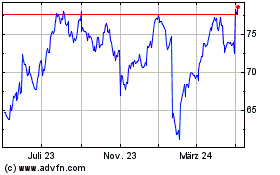
DuPont de Nemours (NYSE:DD)
Historical Stock Chart
Von Jul 2023 bis Jul 2024
