Crypto Analyst Reveals Top Altcoins To Buy Amid Market Slump
23 Januar 2024 - 7:15PM
NEWSBTC
In a new video update, renowned crypto analyst Michael van der
Poppe dissected the current dynamics of the crypto market,
emphasizing the potential of select altcoins. VVan der Poppe’s
analysis provides a strategic viewpoint for potential investors,
focusing on the intricate relationship between Bitcoin’s (BTC)
price movements and the broader altcoin market. Van der Poppe
started by acknowledging the mixed performances among altcoins,
with some consolidating, others correcting, and a few showing
remarkable strength. The crux of his analysis hinges on the
intricate relationship between Bitcoin’s market behavior and the
resultant impact on altcoins. He highlighted the current
consolidation phase of Bitcoin, noting, “Bitcoin is currently
looking at a case of consolidating which means that if Bitcoin is
bottoming out… that can be the kickstart of altcoins to start
firing up.” Related Reading: Pastor Accused Of Defrauding
Congregation With $3 Million Crypto Ponzi Scheme Furthermore, the
crypto analyst delved deep into market capitalization metrics,
particularly emphasizing the Total 2 market cap (excluding Bitcoin)
and Total 3 market cap (excluding Bitcoin and Ethereum), to
underscore the latent potential in altcoins. He pointed out, “We
are at the levels of March 2022… the total market cap lagging says
that we are looking at a case of other cryptocurrencies to start
trending outside of Bitcoin.” Top 3 Altcoins To Buy Now The first
altcoins which van der Poppe picked is Ethereum. He linked ETH’s
price movements with broader market events, including the Bitcoin
halving and potential regulatory approvals and suggested, “Ether is
always going to pick up in a pace that is due to a period of
consolidation of Bitcoin.” He added with regards to the final SEC
deadline for an spot Ethereum ETF approval in the US, “the actual
date that we need to focus on is May, which probably is going to
lead into such a momentum towards these highs.” With regard to a
possible price target in this bull run, the analyst revealed: “I
think that at this point ETH is still going to continue running
towards the area of 8K and we’re going to find ourselves into a top
at that specific level.” Related Reading: XRP Could Hit $0.39
Before Soaring 1000%: Crypto Analyst With respect to the 1-week
ETH/BTC chart, van der Poppe remarked, “We’re seeing one crucial
level that we need to break through 0.06. If we do, I think the
range high at 0.0838 is going to be the target. As a matter of fact
you can actually say $130 billion needs to be added towards
Ethereum. It’s a rally of approximately 43%. Van der Poppe’s second
pick is Chainlink. Highlighting LINK’s technical patterns and its
correlation position against BTC in the weekly chart, Van der Poppe
highlighted that LINK hit resistance at 0.000448, dropped back down
towards 0.0002843 and is now consolidating. Once this is finished,
he expects Chainlink “to rally towards the resistance and start
breaking out of this level towards the highs at 0.0009 to 0.0010.”
He added, “In terms of BTC value, it’s very likely that it’s going
to do a 2x,” emphasizing the potential for significant growth. In
USDT terms, this would mean that LINK goes to $17 to $18. “From $17
to $18, you need to do 2X, which is this range high, which is this
level, which we can expect Chainlink to go to before we have a
pretty substantial correction in the entire market,” he added. The
analyst’s third altcoin is Arbitrum. Focusing on ARB’s recent price
actions and potential for a significant rally, Van der Poppe
identified key entry points, stating, “Anywhere in this ballpark
between $1.67 and $1.50 is where you want to get yourself into an
entry point.” He underlined the potential growth, saying, “If
there’s going to be another impulse taking place, it is going to
$3.50 or $5.” At press time, the total crypto market cap stood at
$1.473 trillion after being rejected at the 0.382 Fibonacci
retracement level. Featured image from iStock, chart from
TradingView.com
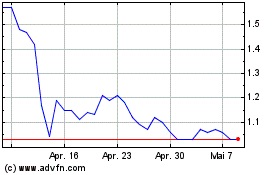
Arbitrum (COIN:ARBUSD)
Historical Stock Chart
Von Mär 2024 bis Apr 2024

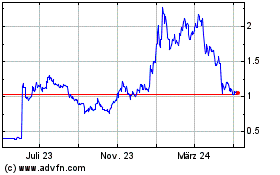
Arbitrum (COIN:ARBUSD)
Historical Stock Chart
Von Apr 2023 bis Apr 2024
