Disclosure of transactions in own shares from January 2nd to January 5th, 2024
08 Januar 2024 - 5:45PM

Disclosure of transactions in own shares from January 2nd to
January 5th, 2024
Nanterre, January 8th,
2024
Disclosure of transactions in own
shares from January
2nd to January
5th, 2024
Within the framework of the authorization
granted by the General Meeting of VINCI SA of April 13, 2023 to
trade in its shares and in accordance with the regulations relating
to share buybacks, VINCISA (LEI:213800WFQ334R8UXUG83) declares the
purchases of treasury shares below (FR0000125486), carried out From
January 2nd to January 5th, 2024 :
I - Aggregate presentation by day and by
market
|
Issuer’s name |
Date of transaction |
Identifying code of financial instrument |
Aggregated daily volume (in number of shares) |
Daily weighted average price of the purchased shares in
Euro |
Market (MIC code) |
| |
|
|
|
|
|
| |
|
|
|
|
|
|
VINCI |
02/01/2024 |
FR0000125486 |
36 042 |
113,86910 |
XPAR |
|
VINCI |
02/01/2024 |
FR0000125486 |
1 958 |
113,61980 |
CEUX |
|
VINCI |
03/01/2024 |
FR0000125486 |
27 000 |
113,29630 |
XPAR |
|
VINCI |
03/01/2024 |
FR0000125486 |
14 500 |
113,12070 |
CEUX |
|
VINCI |
04/01/2024 |
FR0000125486 |
24 441 |
113,25410 |
XPAR |
|
VINCI |
04/01/2024 |
FR0000125486 |
9 809 |
113,11270 |
CEUX |
|
VINCI |
05/01/2024 |
FR0000125486 |
36 471 |
113,49460 |
XPAR |
|
VINCI |
05/01/2024 |
FR0000125486 |
10 129 |
113,37110 |
CEUX |
|
VINCI |
05/01/2024 |
FR0000125486 |
1 447 |
113,33580 |
TQEX |
|
VINCI |
05/01/2024 |
FR0000125486 |
2 453 |
113,28600 |
AQEU |
| |
|
|
|
|
|
| |
|
|
|
|
|
| |
|
TOTAL |
164 250 |
113,4419 |
|
| |
|
|
|
|
|
| |
|
|
|
|
|
II - Details of transactions
In accordance with Article 5 (1) (b) of Regulation (EU) No
596/2014 (Regulation on market abuse), detailed information is
available on the VINCI website :
https://www.vinci.com/vinci.nsf/en/finance-stock-market-shareholders-transactions/pages/index.htm
______________________
- Communique VINCI - declaration hebdo- rachat d'actions SOGE- du
02janv24 au 05janv24 vGB
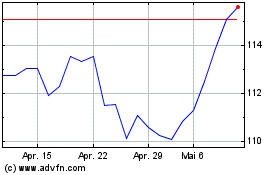
Vinci (EU:DG)
Historical Stock Chart
Von Mär 2024 bis Apr 2024

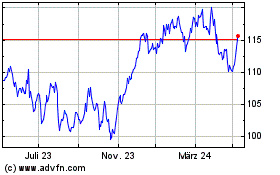
Vinci (EU:DG)
Historical Stock Chart
Von Apr 2023 bis Apr 2024
