Form NPORT-P - Monthly Portfolio Investments Report on Form N-PORT (Public)
25 Juli 2024 - 10:08PM
Edgar (US Regulatory)
THE
TAIWAN FUND, INC.
Schedule
of Investments / May 31, 2024 (Showing
Percentage of Net Assets) (unaudited)
| | |
SHARES | | |
US
$
VALUE | |
| |
| COMMON
STOCKS – 91.0% |
| COMMUNICATION
SERVICES — 1.5% |
| Diversified
Telecommunication Services — 1.5% |
| Chunghwa
Telecom Co. Ltd. | |
| 1,285,000 | | |
$ | 5,077,483 | |
| TOTAL
COMMUNICATION SERVICES | |
| | | |
| 5,077,483 | |
| CONSUMER
DISCRETIONARY — 6.4% |
| Hotels,
Restaurants & Leisure — 0.6% |
| Bafang Yunji International
Co. Ltd. | |
| 110,000 | | |
| 567,080 | |
| Gourmet
Master Co. Ltd. | |
| 526,000 | | |
| 1,474,372 | |
| | |
| | | |
| 2,041,452 | |
| Household
Durables — 2.3% |
| Nien
Made Enterprise Co. Ltd. | |
| 749,000 | | |
| 8,115,670 | |
| Leisure
Products — 1.8% |
| Giant Manufacturing
Co. Ltd. | |
| 220,000 | | |
| 1,477,126 | |
| Merida
Industry Co. Ltd. | |
| 652,000 | | |
| 4,609,125 | |
| | |
| | | |
| 6,086,251 | |
| Textiles,
Apparel & Luxury Goods — 1.7% |
| Feng TAY Enterprise
Co. Ltd. | |
| 324,800 | | |
| 1,549,101 | |
| Fulgent
Sun International Holding Co. Ltd. (a) | |
| 505,000 | | |
| 2,003,226 | |
| Makalot
Industrial Co. Ltd. | |
| 196,000 | | |
| 2,329,444 | |
| | |
| | | |
| 5,881,771 | |
| TOTAL
CONSUMER DISCRETIONARY | |
| | | |
| 22,125,144 | |
| CONSUMER
STAPLES — 2.1% |
| Consumer
Staples Distribution & Retail — 2.1% |
| President
Chain Store Corp. | |
| 869,000 | | |
| 7,243,008 | |
| TOTAL
CONSUMER STAPLES | |
| | | |
| 7,243,008 | |
| INDUSTRIALS
— 5.0% |
| Electrical
Equipment — 4.1% |
| Advanced Energy Solution
Holding Co. Ltd. | |
| 23,000 | | |
| 457,245 | |
| Fortune
Electric Co. Ltd. (a) | |
| 618,000 | | |
| 13,621,411 | |
| | |
| | | |
| 14,078,656 | |
| Machinery
— 0.9% |
| Sunonwealth
Electric Machine Industry Co. Ltd. (a) | |
| 846,000 | | |
| 3,081,682 | |
| TOTAL
INDUSTRIALS | |
| | | |
| 17,160,338 | |
| INFORMATION
TECHNOLOGY — 71.7% |
| Communications
& Internet Industry — 1.0% |
| Wistron
NeWeb Corp. | |
| 689,000 | | |
| 3,318,022 | |
| Electronic
Equipment, Instruments & Components — 6.8% |
| Delta Electronics,
Inc. | |
| 524,000 | | |
| 5,257,146 | |
| E Ink Holdings, Inc. | |
| 731,000 | | |
| 4,953,217 | |
| Elite Material Co.
Ltd. | |
| 283,000 | | |
| 3,568,732 | |
| Fositek Corp. (a) | |
| 276,000 | | |
| 6,091,869 | |
| Lotes
Co. Ltd. | |
| 72,000 | | |
| 3,567,327 | |
| | |
| | | |
| 23,438,291 | |
| Semiconductors
& Semiconductor Equipment — 47.4% |
| Alchip Technologies
Ltd. | |
| 175,000 | | |
| 15,504,414 | |
| ASMedia Technology,
Inc. (a) | |
| 116,000 | | |
| 7,161,820 | |
| ASPEED Technology,
Inc. | |
| 27,000 | | |
| 3,038,063 | |
| eMemory Technology,
Inc. (a) | |
| 187,000 | | |
| 12,699,883 | |
| Faraday Technology
Corp. (a) | |
| 675,104 | | |
| 6,200,020 | |
| Global Unichip Corp. | |
| 86,000 | | |
| 3,862,752 | |
| Globalwafers Co. Ltd. | |
| 103,000 | | |
| 1,675,650 | |
| Grand Process Technology
Corp. | |
| 68,000 | | |
| 2,319,565 | |
| Jentech Precision Industrial
Co. Ltd. | |
| 120,000 | | |
| 3,834,043 | |
| M31 Technology Corp. | |
| 7,000 | | |
| 236,618 | |
| MediaTek, Inc. | |
| 367,000 | | |
| 13,991,634 | |
| Phison Electronics
Corp. | |
| 178,000 | | |
| 3,269,433 | |
| SDI Corp. (a) | |
| 895,000 | | |
| 3,605,529 | |
| Taiwan Semiconductor
Manufacturing Co. Ltd. | |
| 3,235,000 | | |
| 81,988,485 | |
| WinWay
Technology Co. Ltd. (a) | |
| 174,000 | | |
| 4,576,403 | |
| | |
| | | |
| 163,964,312 | |
| Technology
Hardware, Storage & Peripherals — 16.5% |
| Asia Vital Components
Co. Ltd. (a) | |
| 749,705 | | |
| 17,797,220 | |
| Gigabyte Technology
Co. Ltd. (a) | |
| 1,556,000 | | |
| 15,274,680 | |
| King Slide Works Co.
Ltd. (a) | |
| 160,000 | | |
| 5,556,585 | |
| Quanta Computer, Inc. | |
| 1,781,000 | | |
| 15,064,333 | |
| Wistron
Corp. | |
| 964,000 | | |
| 3,332,963 | |
| | |
| | | |
| 57,025,781 | |
| TOTAL
INFORMATION TECHNOLOGY | |
| | | |
| 247,746,406 | |
| MATERIALS
— 4.3% |
| Metals
& Mining — 4.3% |
| Century
Iron & Steel Industrial Co. Ltd. (a) | |
| 1,692,000 | | |
| 14,990,554 | |
| TOTAL
MATERIALS | |
| | | |
| 14,990,554 | |
| TOTAL COMMON STOCKS |
| (Cost
— $192,216,102) | |
| | | |
| 314,342,933 | |
| TOTAL INVESTMENTS —
91.0% |
| (Cost
— $192,216,102) | |
| | | |
| 314,342,933 | |
| OTHER
ASSETS AND LIABILITIES, NET—9.0% | |
| | | |
| 31,186,641 | |
| NET ASSETS—100.0% | |
| | | |
$ | 345,529,574 | |
Legend:
US
$ – United States dollar
| (a) | All
or a portion of the security is on loan. The market value of the securities on loan is
$63,079,681, collateralized by non-cash collateral such as U.S. Government securities
in the amount of $67,145,886. |
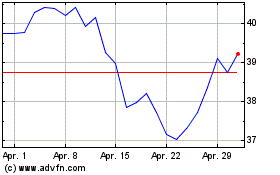
Taiwan (NYSE:TWN)
Historical Stock Chart
Von Dez 2024 bis Dez 2024

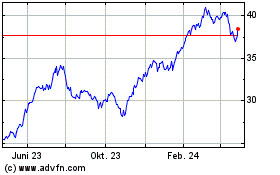
Taiwan (NYSE:TWN)
Historical Stock Chart
Von Dez 2023 bis Dez 2024
