Form NPORT-P - Monthly Portfolio Investments Report on Form N-PORT (Public)
23 Januar 2024 - 9:00PM
Edgar (US Regulatory)
| THE TAIWAN FUND, INC. |
| Schedule |
of Investments / November 30, 2023 (Showing Percentage of Net
Assets) (unaudited) |
| | |
SHARES | | |
US $
VALUE | |
| COMMON STOCKS – 93.5% | |
| | | |
| | |
| COMMUNICATION SERVICES — 1.6% | |
| | | |
| | |
| Diversified Telecommunication Services — 1.6% | |
| | | |
| | |
| Chunghwa Telecom Co. Ltd. | |
| 1,285,000 | | |
$ | 4,915,413 | |
| TOTAL COMMUNICATION SERVICES | |
| | | |
| 4,915,413 | |
| CONSUMER DISCRETIONARY — 6.5% | |
| | | |
| | |
| Hotels, Restaurants & Leisure — 0.8% | |
| | | |
| | |
| Bafang Yunji International Co. Ltd. | |
| 110,000 | | |
| 609,155 | |
| Gourmet Master Co. Ltd. | |
| 526,000 | | |
| 1,683,738 | |
| | |
| | | |
| 2,292,893 | |
| Household Durables — 2.1% | |
| | | |
| | |
| Nien Made Enterprise Co. Ltd. | |
| 594,000 | | |
| 6,483,803 | |
| Leisure Products — 1.5% | |
| | | |
| | |
| Giant Manufacturing Co. Ltd. | |
| 120,000 | | |
| 729,834 | |
| Merida Industry Co. Ltd. | |
| 652,000 | | |
| 3,913,252 | |
| | |
| | | |
| 4,643,086 | |
| Textiles, Apparel & Luxury Goods — 2.1% | |
| | | |
| | |
| Feng TAY Enterprise Co. Ltd. | |
| 324,800 | | |
| 1,907,836 | |
| Fulgent Sun International Holding Co. Ltd. (a) | |
| 505,000 | | |
| 2,384,363 | |
| Makalot Industrial Co. Ltd. | |
| 196,000 | | |
| 2,246,095 | |
| | |
| | | |
| 6,538,294 | |
| TOTAL CONSUMER DISCRETIONARY | |
| | | |
| 19,958,076 | |
| CONSUMER STAPLES — 2.5% | |
| | | |
| | |
| Consumer Staples Distribution & Retail — 2.5% | |
| | | |
| | |
| President Chain Store Corp. | |
| 869,000 | | |
| 7,496,655 | |
| TOTAL CONSUMER STAPLES | |
| | | |
| 7,496,655 | |
| INDUSTRIALS — 9.0% | |
| | | |
| | |
| Electrical Equipment — 6.3% | |
| | | |
| | |
| Advanced Energy Solution Holding Co. Ltd. (a) | |
| 235,000 | | |
| 5,679,417 | |
| Fortune Electric Co. Ltd. (a) | |
| 1,539,000 | | |
| 13,793,854 | |
| | |
| | | |
| 19,473,271 | |
| Machinery — 2.7% | |
| | | |
| | |
| Nak Sealing Technologies Corp. | |
| 143,000 | | |
| 633,979 | |
| Sunonwealth Electric Machine Industry Co. Ltd. (a) | |
| 2,391,000 | | |
| 7,531,191 | |
| | |
| | | |
| 8,165,170 | |
| TOTAL INDUSTRIALS | |
| | | |
| 27,638,441 | |
| INFORMATION TECHNOLOGY — 70.8% | |
| | | |
| | |
| Electronic Equipment, Instruments & Components — 6.6% | |
| | | |
| | |
| Delta Electronics, Inc. | |
| 1,002,000 | | |
| 10,151,505 | |
| E Ink Holdings, Inc. | |
| 731,000 | | |
| 4,282,106 | |
| Elite Material Co. Ltd. (a) | |
| 424,000 | | |
| 5,157,490 | |
| Gold Circuit Electronics Ltd. | |
| 100,100 | | |
| 730,563 | |
| | |
| | | |
| 20,321,664 | |
| Semiconductors & Semiconductor Equipment — 49.4% | |
| | | |
| | |
| Alchip Technologies Ltd. (a) | |
| 113,000 | | |
| 11,249,360 | |
| ASPEED Technology, Inc. (a) | |
| 77,000 | | |
| 7,258,803 | |
| eMemory Technology, Inc. (a) | |
| 174,000 | | |
| 14,008,003 | |
| Faraday Technology Corp. | |
| 976,000 | | |
| 12,043,790 | |
| Global Unichip Corp. (a) | |
| 241,000 | | |
| 12,728,873 | |
| Globalwafers Co. Ltd. | |
| 103,000 | | |
| 1,925,480 | |
| Jentech Precision Industrial Co. Ltd. | |
| 200,000 | | |
| 4,148,528 | |
| MediaTek, Inc. | |
| 428,000 | | |
| 12,946,863 | |
| Nuvoton Technology Corp. (a) | |
| 1,392,000 | | |
| 6,616,901 | |
| Parade Technologies Ltd. | |
| 53,000 | | |
| 1,823,784 | |
| SDI Corp. | |
| 955,000 | | |
| 3,607,234 | |
| Taiwan Semiconductor Manufacturing Co. Ltd. | |
| 3,235,000 | | |
| 59,750,160 | |
| WinWay Technology Co. Ltd. (a) | |
| 124,000 | | |
| 3,076,184 | |
| | |
| | | |
| 151,183,963 | |
| Technology Hardware, Storage & Peripherals — 14.8% | |
| | | |
| | |
| Asia Vital Components Co. Ltd. (a) | |
| 1,264,705 | | |
| 12,468,923 | |
| Gigabyte Technology Co. Ltd. (a) | |
| 1,307,000 | | |
| 10,459,347 | |
| Quanta Computer, Inc. | |
| 1,899,000 | | |
| 12,339,853 | |
| Wistron Corp. (a) | |
| 2,658,000 | | |
| 7,785,115 | |
| Wiwynn Corp. | |
| 38,000 | | |
| 2,140,845 | |
| | |
| | | |
| 45,194,083 | |
| TOTAL INFORMATION TECHNOLOGY | |
| | | |
| 216,699,710 | |
| MATERIALS — 3.1% | |
| | | |
| | |
| Chemicals — 0.6% | |
| | | |
| | |
| Swancor Holding Co. Ltd. | |
| 570,000 | | |
| 1,762,548 | |
| Metals & Mining — 2.5% | |
| | | |
| | |
| Century Iron & Steel Industrial Co. Ltd. (a) | |
| 1,446,000 | | |
| 7,683,611 | |
| TOTAL MATERIALS | |
| | | |
| 9,446,159 | |
TOTAL COMMON STOCKS
| |
| | | |
| | |
| (Cost — $188,596,812) | |
| | | |
| 286,154,454 | |
TOTAL INVESTMENTS — 93.5%
| |
| | | |
| | |
| (Cost — $188,596,812) | |
| | | |
| 286,154,454 | |
| OTHER ASSETS AND LIABILITIES, NET—6.5% | |
| | | |
| 19,911,469 | |
| NET ASSETS—100.0% | |
| | | |
$ | 306,065,923 | |
| Legend: |
|
|
|
|
|
| US $ – United States dollar |
|
|
|
|
|
| (a) | All or a portion of the security is on loan. The market value
of the securities on loan is $68,501,512, collateralized by non-cash collateral such as U.S. Government securities in the amount of $73,515,977. |
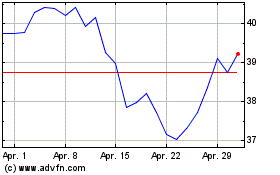
Taiwan (NYSE:TWN)
Historical Stock Chart
Von Jun 2024 bis Jul 2024

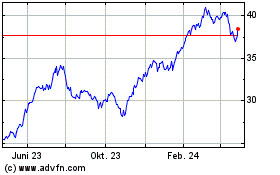
Taiwan (NYSE:TWN)
Historical Stock Chart
Von Jul 2023 bis Jul 2024
