Filed by Global Net Lease, Inc.
Pursuant to Rule 425 Under
the Securities Act of 1933
And Deemed Filed Pursuant to Rule 14a-12
Under the Securities Exchange
Act of 1934
Subject Company: The Necessity Retail
REIT, Inc.
Subject Company Commissions File No.: 001-38597
Global Net Lease to Merge with The Necessity Retail REIT Internalize Management Enhances Corporate Governance August 14, 2023 Pictured – McLaren Campus in Woking, U.K.
1 FORWARD LOOKING STATEMENTS The statements in this presentation that are not historical facts may be forward - looking statements. These forward - looking state ments involve risks and uncertainties that could cause actual results or events to be materially different. In addition, words such as “may,” “will,” “seeks,” “anticipates,” “be lieves,” “estimates,” "expects,” “plans,” “intends,” “would,” or similar expressions indicate a forward - looking statement, although not all forward - looking statements contain these identifying words. Any statements referring to the future value of an investment in GNL, including the adjustments giving effect to RTL merging with and into Osmosis Sub I, LL C, with Osmosis Sub I, LLC continuing as the surviving entity and wholly - owned subsidiary of GNL (the “REIT Merger”) and GNL and RTL becoming internally managed (the “In ternalization Merger” and, together with the REIT Merger, the “Proposed Transactions”) as described in this Supplement, as well as the potential success that GNL ma y have in executing the REIT Merger and Internalization Merger, are also forward - looking statements. There are a number of risks, uncertainties and other important fact ors that could cause GNL’s actual results, or GNL’s actual results after making adjustments to give effect to the REIT Merger and the Internalization Merger, to differ mat eri ally from those contemplated by such forward - looking statements, including but not limited to: (i) GNL’s ability to complete the proposed REIT Merger and Internalization Mer ger on the proposed terms or on the anticipated timeline, or at all, including risks and uncertainties related to securing the necessary stockholder approvals an d s atisfaction of other closing conditions to consummate the proposed transaction, (ii) the occurrence of any event, change or other circumstance that could give rise to t he termination of the Internalization Merger Agreement and REIT Merger Agreement, each dated as of May 23, 2023 relating to the Proposed Transactions, (iii) the ability o f G NL to obtain lender consent to amend its Second Amended and Restated Credit Facility or any other loan agreement of GNL, if at all, or on terms favorable to GNL, (iv) ri sks related to the potential repeal of GNL’s Shareholder’s Rights Plan; (v) risks related to the decrease in the beneficial ownership requirements of GNL’s applicable cla sse s and series of stock; (vi) risks related to diverting the attention of GNL’s management from ongoing business operations, (vii) failure to realize the expected benefits of the Pro pos ed Transactions, (viii) significant transaction costs or unknown or inestimable liabilities, (ix) the risk of shareholder litigation in connection with the proposed transact ion , including resulting expense or delay, (x) the risk that RTL’s business will not be integrated successfully or that such integration may be more difficult, time - consuming or costly than expected, (xi) risks related to future opportunities and plans for GNL post - closing, including the uncertainty of expected future financial performance and results of GNL post - closing following completion of the Proposed Transactions, (xii) the effect of the announcement of the proposed transaction on the ability of GNL and RTL to oper ate their respective businesses and retain and hire key personnel and to maintain favorable business relationships, (xiii) the effect of any downgrade of GNL’s or RTL’s cor por ate rating or to any of their respective debt or equity securities including the outstanding notes under the RTL Indenture; (xiv) risks related to the market value of the GNL Co mmon Stock to be issued in the Proposed Transactions; (xv) other risks related to the completion of the Proposed Transactions, (xvi) potential adverse effects of the on going global COVID - 19 pandemic, including actions taken to contain or treat COVID - 19, on RTL, RTL's tenants and the global economy and financial market, (xvii) the risk t hat one or more parties to the Internalization Merger Agreement and REIT Merger Agreement may not fulfil its obligations under the respective agreement, as well as the addi tio nal risks, uncertainties and other important factors set forth in the “Risk Factors” and “Management’s Discussion and Analysis of Financial Condition and Results of Opera tio ns” sections of GNL’s Annual Report on Form 10 - K for the year ended December 31, 2022 filed with the SEC on February 23, 2023, and all other filings with the SEC after that date, as such risks, uncertainties and other important factors may be updated from time to time in GNL’s subsequent reports. Further, forward - looking statements speak only as of the date they are made, and the Company undertakes no obligation to update or revise forward - looking statements to reflect changed assumptions, the occurrence o f unanticipated events or changes to future operating results over time, except as required by law. This presentation contains certain statements that are the Company’s and Management’s hopes, intentions, beliefs, expectation s, or projections of the future and might be considered to be forward - looking statements under Federal Securities laws. Prospective investors are cautioned that any such for ward - looking statements are not guarantees of future performance, and involve risks and uncertainties. The Company’s actual future results may differ significantly from th e m atters discussed in these forward - looking statements, and we may not release revisions to these forward - looking statements to reflect changes after we’ve made the stateme nts. If the Company updates one or more forward - looking statements, no inference should be drawn that the Company will make additional updates with respect to those or other forward - looking statements.
2 PROJECTIONS This presentation also includes estimated projections of future operating results. These projections are not prepared in acco rda nce with published guidelines of the SEC or the guidelines established by the American Institute of Certified Public Accountants for preparation an d presentation of financial projections. This information is not fact and should not be relied upon as being necessarily indicative of future r esu lts; the projections were prepared in good faith by management and are based on numerous assumptions that may prove to be wrong. All such statemen ts, including but not limited to estimates of value accretion, synergies, run - rate figures and results of future operations after making adjus tments to give effect to the Proposed Transactions reflect assumptions as to certain business decisions and events that are subject to change. As a re sult, actual results may differ materially from those contained in the estimates. Accordingly, there can be no assurance that the estimates will b e r ealized, or that the transactions described in this presentation, including but not limited to the Proposed Transactions, will be realized at all. Im portant factors that may affect actual results and cause the projections to not be achieved include, but are not limited to, risks and uncertainti es relating to the Company and other factors described in the “Risk Factors” and “Management’s Discussion and Analysis of Financial Condition an d R esults of Operations” sections of the Company’s Annual Report on Form 10 - K for the year ended December 31, 2022 filed with the SEC on Febr uary 23, 2023, and all other filings with the SEC after that date, as such risks, uncertainties and other important factors may be upd ate d from time to time in the Company’s subsequent reports. This presentation also contains estimates and information concerning our industry and tenants, including market position, mar ket size and growth rates of the markets in which we operate, that are based on industry publications and other third - party reports. This informatio n involves a number of assumptions and limitations, and you are cautioned not to give undue weight to these estimates. We have not indepen den tly verified the accuracy or completeness of the data contained in these publications and reports. The industry in which we operate is subject to a high degree of uncertainty and risk due to a variety of factors, including those described in the “Risk Factors” and “Management’s Discussio n a nd Analysis of Financial Condition and Results of Operations” sections of the Company’s Annual Report on Form 10 - K for the year ended December 31, 2022 filed with the SEC on February 23, 2023, and all other filings with the SEC after that date, as such risks, uncertainties and ot her important factors may be updated from time to time in the Company’s subsequent reports. Credit Ratings A securities rating is not a recommendation to buy, sell or hold securities and may be subject to revision or withdrawal at a ny time. Each rating agency has its own methodology of assigning ratings and, accordingly, each rating should be evaluated independently of any ot her rating.
3 ADDITIONAL INFORMATION AND WHERE TO FIND IT Additional Information About the REIT Merger and Internalization Merger and Where to Find It In connection with the Proposed Transactions, on July 6, 2023, GNL filed with the SEC a registration statement on Form S - 4 (as a mended on July 17, 2023), which includes a document that serves as a prospectus of GNL and a joint proxy statement of GNL and RTL (the “Join t P roxy Statement/Prospectus”). Each party also plans to file other relevant documents with the SEC regarding the Proposed Transactio ns. The Form S - 4 became effective on July 18, 2023. INVESTORS AND SECURITY HOLDERS ARE URGED TO READ THE JOINT PROXY STATEMENT/PROSPECTUS AND OTHER RELEVANT DOCUMENTS FILED WITH THE SEC BECAUSE THEY CONTAIN IMPORTANT INFORMATION ABOUT THE PROPOSED TRANSACTIONS. GNL and RTL commenced mailing the definitive Joint Proxy Statement/Prospectus to stockholders on or about July 19, 2023. Investors and securityholders may obtain a free copy of the J oin t Proxy Statement/Prospectus and other relevant documents filed by GNL and RTL with the SEC at the SEC’s website at www.sec.gov. Copi es of the documents filed by GNL with the SEC are available free of charge on GNL’s website at www.globalnetlease.com or by contacting GNL ’s Investor Relations at investorrelations@globalnetlease.com. Copies of the documents filed by RTL with the SEC are available free of ch arg e on RTL’s website at www.necessityretailreit.com or by contacting RTL’s Investor Relations at ir@rtlreit.com. Participants in the Proxy Solicitation GNL, RTL, and their respective directors, executive officers and other members of management and employees of their respectiv e a dvisors and their affiliates may be deemed to be participants in the solicitation of proxies in respect of the proposed transactions. Inf orm ation about directors and executive officers of GNL is available in the GNL proxy statement for its 2023 Annual Meeting, as incorporated by referen ce in the Joint Proxy Statement/Prospectus. Information about directors and executive officers of RTL is available in the RTL proxy statement fo r its 2023 Annual Meeting, as incorporated by reference in the Joint Proxy Statement/Prospectus. Other information regarding the partici pan ts in the proxy solicitation and a description of their direct and indirect interests, by security holdings or otherwise, will be contained i n t he joint proxy statement/prospectus and other relevant materials filed with the SEC regarding the proposed transactions when they become ava ila ble. Investors should read the joint proxy statement/prospectus carefully when it becomes available before making any voting or investment d eci sions. Investors may obtain free copies of these documents from GNL and RTL as indicated above.
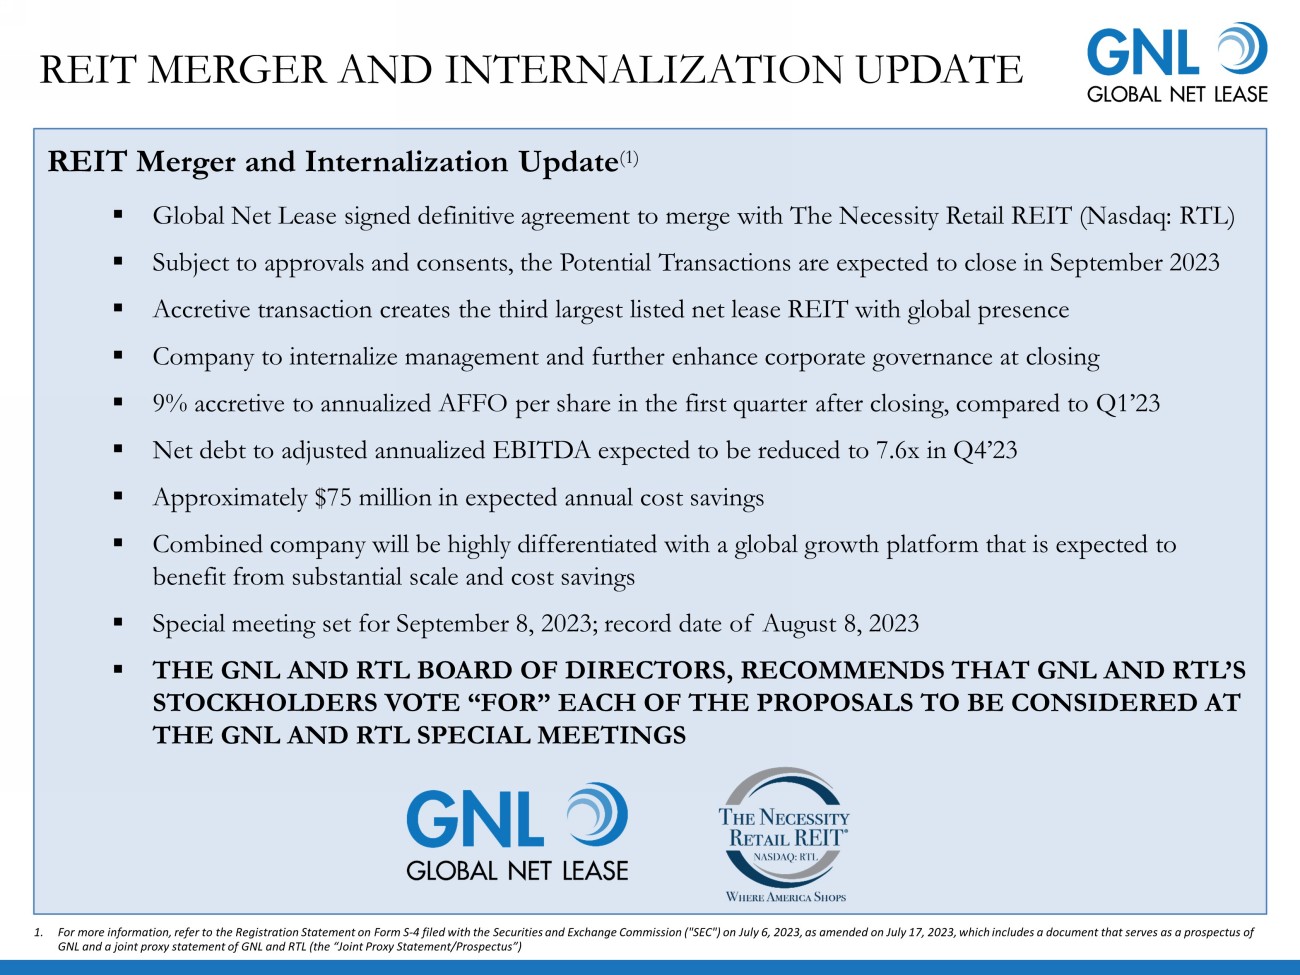
REIT MERGER AND INTERNALIZATION UPDATE 1. For more information, refer to the Registration Statement on Form S - 4 filed with the Securities and Exchange Commission ("SEC") on July 6, 2023, as amended on July 17, 2023, which includes a document that serves as a prospectus of GNL and a joint proxy statement of GNL and RTL (the “Joint Proxy Statement/Prospectus”) REIT Merger and Internalization Update (1) ▪ Global Net Lease signed definitive agreement to merge with The Necessity Retail REIT (Nasdaq: RTL) ▪ Subject to approvals and consents, the Potential Transactions are expected to close in September 2023 ▪ Accretive transaction creates the third largest listed net lease REIT with global presence ▪ Company to internalize management and further enhance corporate governance at closing ▪ 9% accretive to annualized AFFO per share in the first quarter after closing, compared to Q1’23 ▪ Net debt to adjusted annualized EBITDA expected to be reduced to 7.6x in Q4’23 ▪ Approximately $75 million in expected annual cost savings ▪ Combined company will be highly differentiated with a global growth platform that is expected to benefit from substantial scale and cost savings ▪ Special meeting set for September 8, 2023; record date of August 8, 2023 ▪ THE GNL AND RTL BOARD OF DIRECTORS, RECOMMENDS THAT GNL AND RTL’S STOCKHOLDERS VOTE “FOR” EACH OF THE PROPOSALS TO BE CONSIDERED AT THE GNL AND RTL SPECIAL MEETINGS
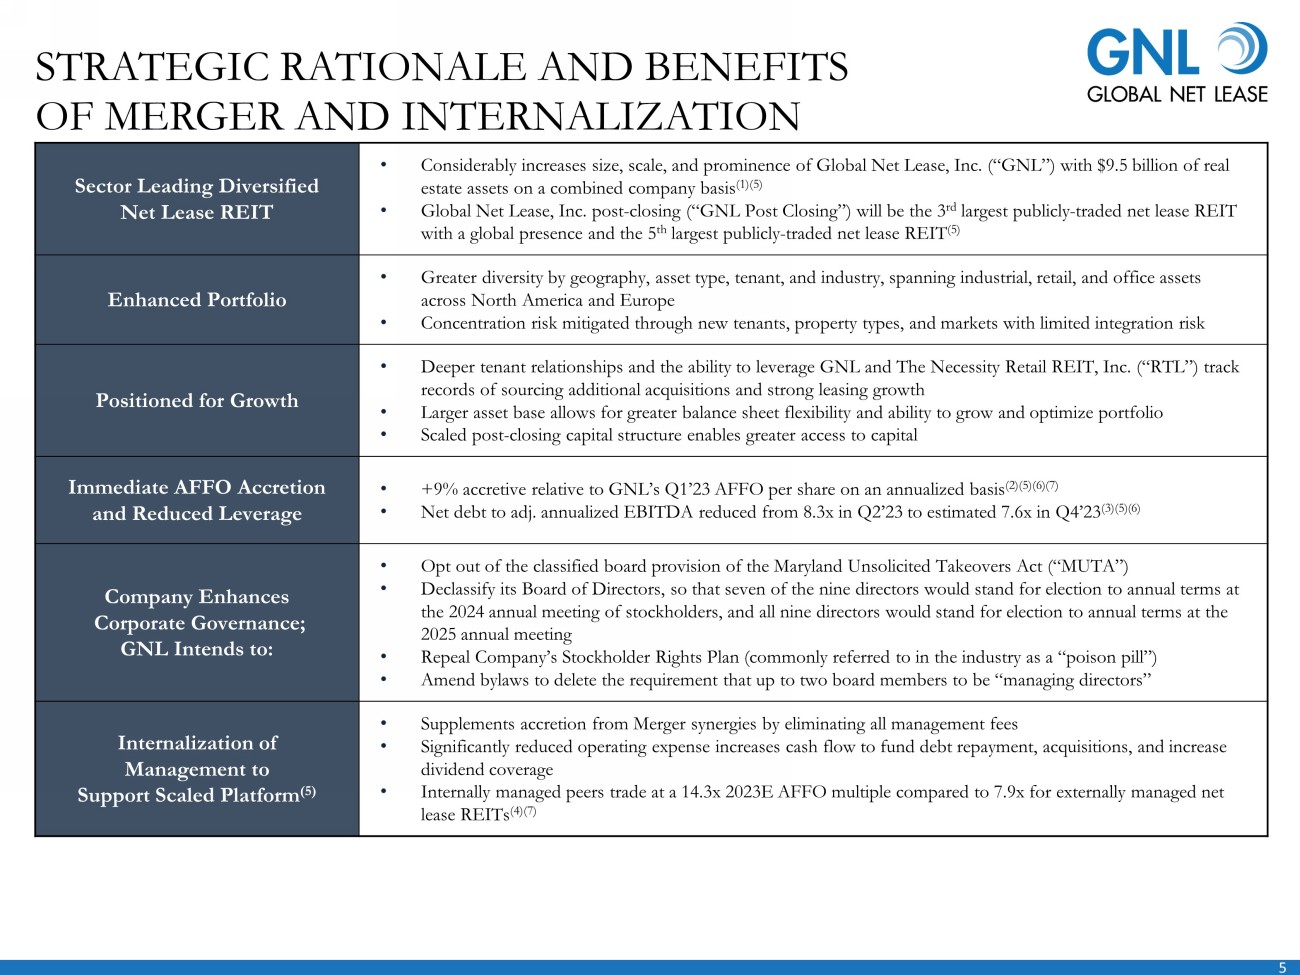
5 STRATEGIC RATIONALE AND BENEFITS OF MERGER AND INTERNALIZATION Sector Leading Diversified Net Lease REIT • Considerably increases size, scale, and prominence of Global Net Lease, Inc. (“GNL”) with $9.5 billion of real estate assets on a combined company basis (1)(5) • Global Net Lease, Inc. post - closing (“GNL Post Closing”) will be the 3 rd largest publicly - traded net lease REIT with a global presence and the 5 th largest publicly - traded net lease REIT (5) Enhanced Portfolio • Greater diversity by geography, asset type, tenant, and industry, spanning industrial, retail, and office assets across North America and Europe • Concentration risk mitigated through new tenants, property types, and markets with limited integration risk Positioned for Growth • Deeper tenant relationships and the ability to leverage GNL and The Necessity Retail REIT, Inc. (“RTL”) track records of sourcing additional acquisitions and strong leasing growth • Larger asset base allows for greater balance sheet flexibility and ability to grow and optimize portfolio • Scaled post - closing capital structure enables greater access to capital Immediate AFFO Accretion and Reduced Leverage • +9% accretive relative to GNL’s Q1’23 AFFO per share on an annualized basis (2)(5)(6)(7) • Net debt to adj. annualized EBITDA reduced from 8.3x in Q2’23 to estimated 7.6x in Q4’23 (3)(5)(6) Company Enhances Corporate Governance; GNL Intends to: • Opt out of the classified board provision of the Maryland Unsolicited Takeovers Act (“MUTA”) • Declassify its Board of Directors, so that seven of the nine directors would stand for election to annual terms at the 2024 annual meeting of stockholders, and all nine directors would stand for election to annual terms at the 2025 annual meeting • Repeal Company’s Stockholder Rights Plan (commonly referred to in the industry as a “poison pill”) • Amend bylaws to delete the requirement that up to two board members to be “managing directors” Internalization of Management to Support Scaled Platform (5) • Supplements accretion from Merger synergies by eliminating all management fees • Significantly reduced operating expense increases cash flow to fund debt repayment, acquisitions, and increase dividend coverage • Internally managed peers trade at a 14.3x 2023E AFFO multiple compared to 7.9x for externally managed net lease REITs (4)(7)

6 Transaction Details (2)(3) • All stock merger between GNL and RTL, with GNL Post - closing as the surviving entity (the “Merger”) • RTL stockholders will receive 0.670 shares of GNL for each common share of RTL, representing a 35% premium to RTL’s 30 - day VWAP, based on share prices as of the date of the transaction announcement on May 23, 2023 • Total transaction value of $4 billion • GNL and RTL to internalize both external REIT asset and property managers in conjunction with Merger (the “Internalization”) • Post - closing ownership of approximately 47% for existing GNL stockholders, approximately 39% for existing RTL stockholders, and approximately 14% for the owner of the former external manager or certain of its owners (1) Anticipated Synergies and Cost Savings (2) • Anticipated annual cost savings of approximately $54mm realized immediately upon internalization and an additional approximately $21mm realized within 12 months of transaction close from Merger synergies, totaling approximately $75 million in expected annual savings • Operating expense savings to reduce leverage over time Dedicated Management and Board • Current GNL CEO Jim Nelson and current RTL CEO Mike Weil to be co - CEOs. Mike Weil will be sole CEO upon Jim Nelson’s retirement in April 2024. Chris Masterson to remain CFO • Majority - independent Board of Directors with three independent RTL Board members joining GNL's Board • GNL's current independent chairperson remaining in her position Dividend (2) • GNL expects the quarterly dividend policy to be set at $0.354 per share ($1.42 per share, annualized). Q4’23 AFFO expected to be $0.42 per share ($1.68 per share, annualized) (4)(5) • After giving affect to the Merger and the Internalization, current RTL stockholders expected to receive a 12% increase to the quarterly dividend they currently receive from RTL Expected Close • Q3’23, subject to certain closing conditions, including approval by the stockholders of GNL and RTL, successful obtainment of lender consent of GNL’s Credit Facility, and other related lender consents (2) • The Merger and the Internalization and any related transactions are expected to occur on the closing date TRANSACTION OVERVIEW 1. Post - closing ownership based on the Joint Proxy Statement/Prospectus and includes common shares, operating partnership units, un vested restricted shares, unvested restricted stock units, and long - term performance units. GNL ownership includes additional approximately 2% attributed to Blackwells/Related Parties (as defined in the Joint Proxy Statement/Prospectus). 2. Please see Disclaimers at the front of this presentation for important information regarding as adjusted figures giving effec t t o the Merger and the Internalization. There can be no assurance that any of these projected synergies, value accretion estima tes or combined future results of operations will be realized. 3. In connection with the Proposed Transactions, the aggregate share ownership limit for the Company's charter will be reduced t o 8 .9%. In addition, GNL has granted a waiver to the former external manager and certain owners thereof to own more than the 8.9 % l imit, effective at the closing of the Transactions. 4. Please see Disclaimers at back of this presentation for a definition of all non - GAAP measures and a reconciliation to the Compan y's most directly comparable GAAP measure. 5. Please see Disclaimers at the back of this presentation for a definition of AFFO. While we consider AFFO a useful indicator o f o ur performance, we do not consider AFFO as an alternative to net income (loss) or as a measure of liquidity. Furthermore, oth er REITs may define AFFO differently than we do, including RTL. Projected AFFO per share data included in this presentation is for informational pur poses only and should not be relied upon as indicative of future dividends or as a measure of future liquidity.
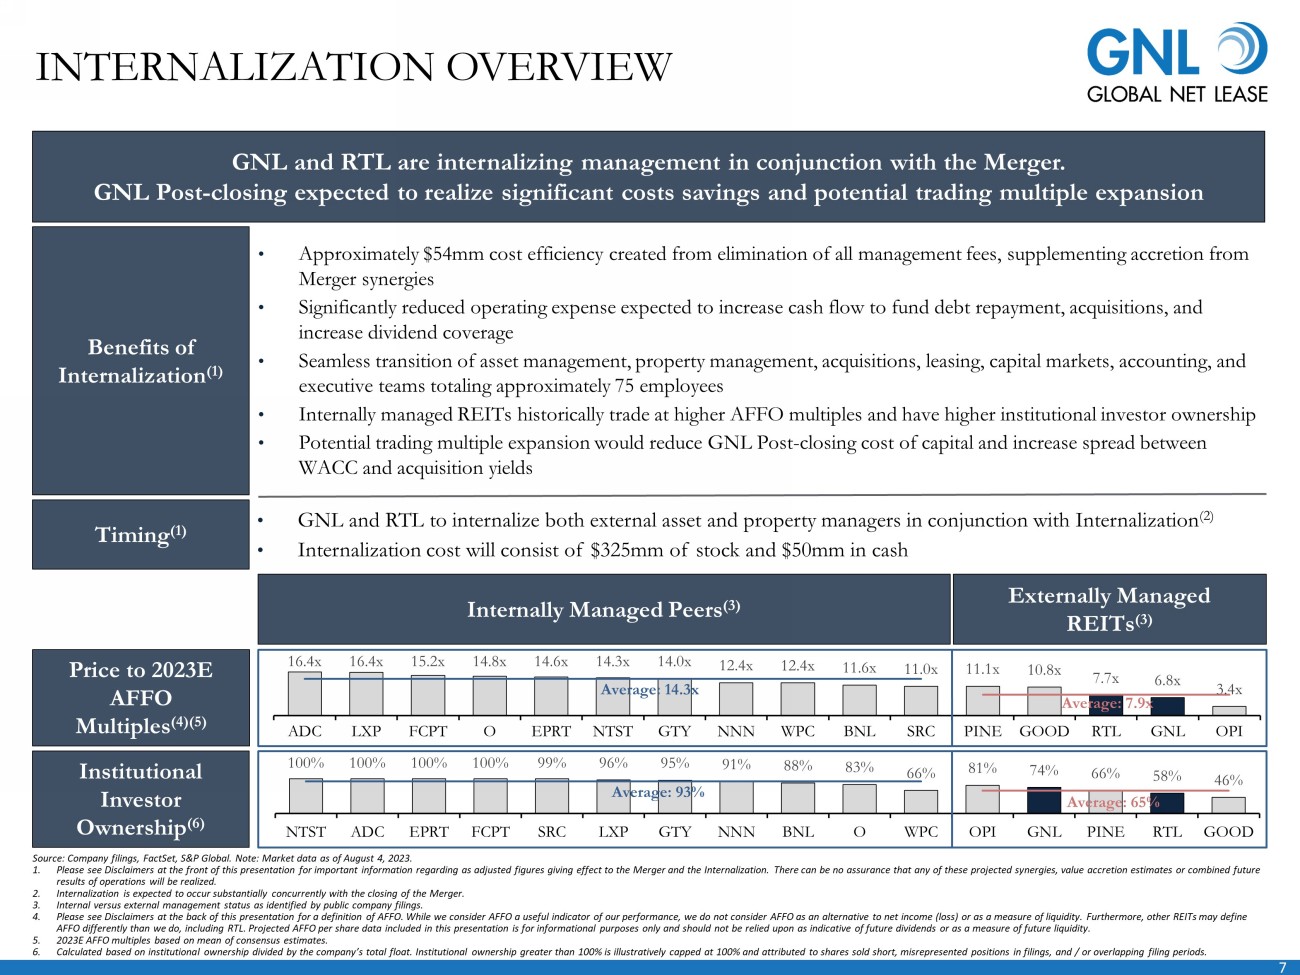
7 • Approximately $54mm cost efficiency created from elimination of all management fees, supplementing accretion from Merger synergies • Significantly reduced operating expense expected to increase cash flow to fund debt repayment, acquisitions, and increase dividend coverage • Seamless transition of asset management, property management, acquisitions, leasing, capital markets, accounting, and executive teams totaling approximately 75 employees • Internally managed REITs historically trade at higher AFFO multiples and have higher institutional investor ownership • Potential trading multiple expansion would reduce GNL Post - closing cost of capital and increase spread between WACC and acquisition yields 100% 100% 100% 100% 99% 96% 95% 91% 88% 83% 66% 81% 74% 66% 58% 46% Average: 93% Average: 65% NTST ADC EPRT FCPT SRC LXP GTY NNN BNL O WPC OPI GNL PINE RTL GOOD 16.4x 16.4x 15.2x 14.8x 14.6x 14.3x 14.0x 12.4x 12.4x 11.6x 11.0x 11.1x 10.8x 7.7x 6.8x 3.4x Average: 14.3x Average: 7.9x ADC LXP FCPT O EPRT NTST GTY NNN WPC BNL SRC PINE GOOD RTL GNL OPI Source: Company filings, FactSet, S&P Global. Note: Market data as of August 4, 2023. 1. Please see Disclaimers at the front of this presentation for important information regarding as adjusted figures giving effec t t o the Merger and the Internalization. There can be no assurance that any of these projected synergies, value accretion estima tes or combined future results of operations will be realized. 2. Internalization is expected to occur substantially concurrently with the closing of the Merger. 3. Internal versus external management status as identified by public company filings. 4. Please see Disclaimers at the back of this presentation for a definition of AFFO. While we consider AFFO a useful indicator o f o ur performance, we do not consider AFFO as an alternative to net income (loss) or as a measure of liquidity. Furthermore, oth er REITs may define AFFO differently than we do, including RTL. Projected AFFO per share data included in this presentation is for informational pur poses only and should not be relied upon as indicative of future dividends or as a measure of future liquidity. 5. 2023E AFFO multiples based on mean of consensus estimates. 6. Calculated based on institutional ownership divided by the company’s total float. Institutional ownership greater than 100% i s i llustratively capped at 100% and attributed to shares sold short, misrepresented positions in filings, and / or overlapping f ili ng periods. INTERNALIZATION OVERVIEW Timing (1) Benefits of Internalization (1) • GNL and RTL to internalize both external asset and property managers in conjunction with Internalization (2) • Internalization cost will consist of $325mm of stock and $50mm in cash GNL and RTL are internalizing management in conjunction with the Merger. GNL Post - closing expected to realize significant costs savings and potential trading multiple expansion Price to 2023E AFFO Multiples (4)(5) Institutional Investor Ownership (6) Internally Managed Peers (3) Externally Managed REITs (3)

8 Category Estimated Annual Savings Description Internalization Savings Approximately $54 million immediate at transaction close (2) • Elimination of asset management fees, property management fees, incentive fees, equity issuance fees, and reimbursable expenses net of internalized employee compensation, rent and overhead, and retained 3 rd party services Merger Synergies Approximately $21 million run - rate (2) • Corporate consolidation, public company cost savings, and elimination of other duplicative services Net Savings Approximately $75 million Note: Balance sheets as of June 30, 2023, unless otherwise noted. 1. Calculated using June 30, 2023 general and administrative (“G&A”) expense, annualized, divided by straight - line rent for GNL, RT L, and GNL Post - closing and annualized base rent for peers. GNL Post - closing G&A represents estimated next twelve months G&A as of 09/30/2023E, assuming concurrent closing of the Merger and Internalization on the same date. 2. Please see Disclaimers at the front of this presentation for important information regarding as adjusted figures giving effec t t o the Merger and the Internalization. There can be no assurance that any of these projected synergies, value accretion estima tes or combined future results of operations will be realized. SUBSTANTIAL IDENTIFIED MERGER SYNERGIES AND INTERNALIZATION SAVINGS GNL Post - closing G&A Efficiency (1)(2) 4% 5% 6% 7% 7% 9% 9% 10% 11% 13% 15% 18% 21% 25% O NNN PF GNL ADC WPC SRC EPRT BNL FCPT LXP GTY NTST GNL RTL 100% of synergies are expected to be realized immediately upon Internalization and through the first 12 months of closing (2) GNL Post - closing (2)
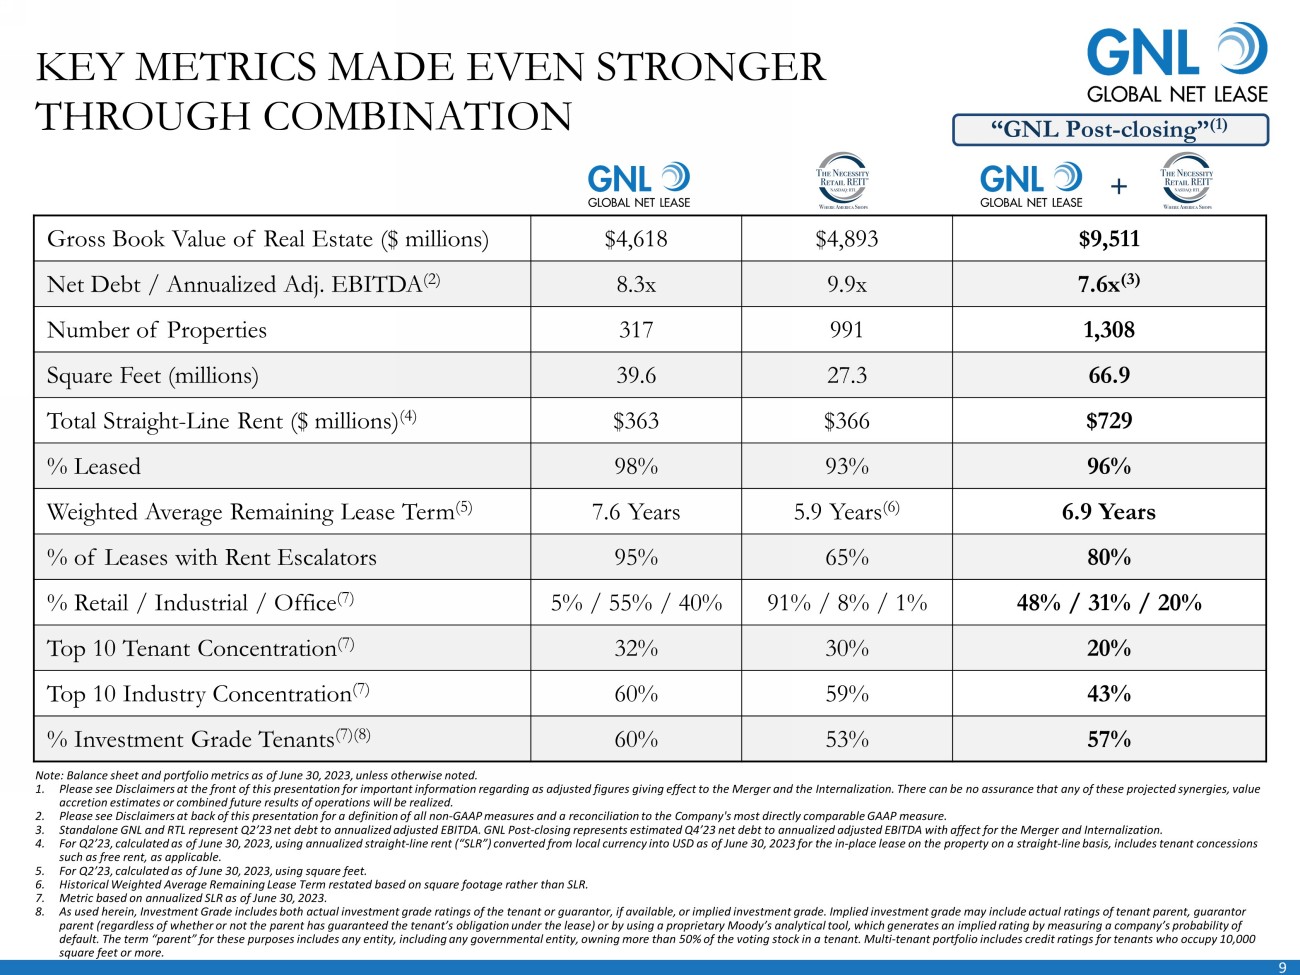
9 KEY METRICS MADE EVEN STRONGER THROUGH COMBINATION Note: Balance sheet and portfolio metrics as of June 30, 2023, unless otherwise noted. 1. Please see Disclaimers at the front of this presentation for important information regarding as adjusted figures giving effec t t o the Merger and the Internalization. There can be no assurance that any of these projected synergies, value accretion estimates or combined future results of operations will be realized. 2. Please see Disclaimers at back of this presentation for a definition of all non - GAAP measures and a reconciliation to the Compan y's most directly comparable GAAP measure. 3. Standalone GNL and RTL represent Q2’23 net debt to annualized adjusted EBITDA. GNL Post - closing represents estimated Q4’23 net d ebt to annualized adjusted EBITDA with affect for the Merger and Internalization. 4. For Q2’23, calculated as of June 30 , 2023, using annualized straight - line rent (“SLR”) converted from local currency into USD as of June 30 , 2023 for the in - place lease on the property on a straight - line basis, includes tenant concessions such as free rent, as applicable. 5. For Q2’23, calculated as of June 30 , 2023, using square feet. 6. Historical Weighted Average Remaining Lease Term restated based on square footage rather than SLR. 7. Metric based on annualized SLR as of June 30, 2023. 8. As used herein, Investment Grade includes both actual investment grade ratings of the tenant or guarantor, if available, or i mpl ied investment grade. Implied investment grade may include actual ratings of tenant parent, guarantor parent (regardless of whether or not the parent has guaranteed the tenant’s obligation under the lease) or by using a proprie tar y Moody’s analytical tool, which generates an implied rating by measuring a company’s probability of default. The term “parent” for these purposes includes any entity, including any governmental entity, owning more than 50% of th e voting stock in a tenant. Multi - tenant portfolio includes credit ratings for tenants who occupy 10,000 square feet or more. “GNL Post - closing” (1) + Gross Book Value of Real Estate ($ millions) $4,618 $4,893 $9,511 Net Debt / Annualized Adj. EBITDA (2) 8.3x 9.9x 7.6x (3) Number of Properties 317 991 1,308 Square Feet (millions) 39.6 27.3 66.9 Total Straight - Line Rent ($ millions) (4) $363 $366 $729 % Leased 98% 93% 96% Weighted Average Remaining Lease Term (5) 7.6 Years 5.9 Years (6) 6.9 Years % of Leases with Rent Escalators 95% 65% 80% % Retail / Industrial / Office (7) 5% / 55% / 40% 91% / 8% / 1% 48% / 31% / 20% Top 10 Tenant Concentration (7) 32% 30% 20% Top 10 Industry Concentration (7) 60% 59% 43% % Investment Grade Tenants (7)(8) 60% 53% 57%

10 $46,664 $19,675 $9,511 $4,618 SECTOR LEADING DIVERSIFIED NET LEASE REIT Gross Book Value of Real Estate ($ in millions) Source: Company filings. Note: Balance sheets as of June 30, 2023, unless otherwise noted . 1. Based on g ross book value of real estate as of June 30, 2023. 2. Please see Disclaimers at the front of this presentation for important information regarding as adjusted figures giving effec t t o the Merger and the Internalization. There can be no assurance that any of these projected synergies, value accretion estima tes or combined future results of operations will be realized. GNL becomes the 3 rd largest net lease REIT with a global presence (1) GNL Post - closing (2)
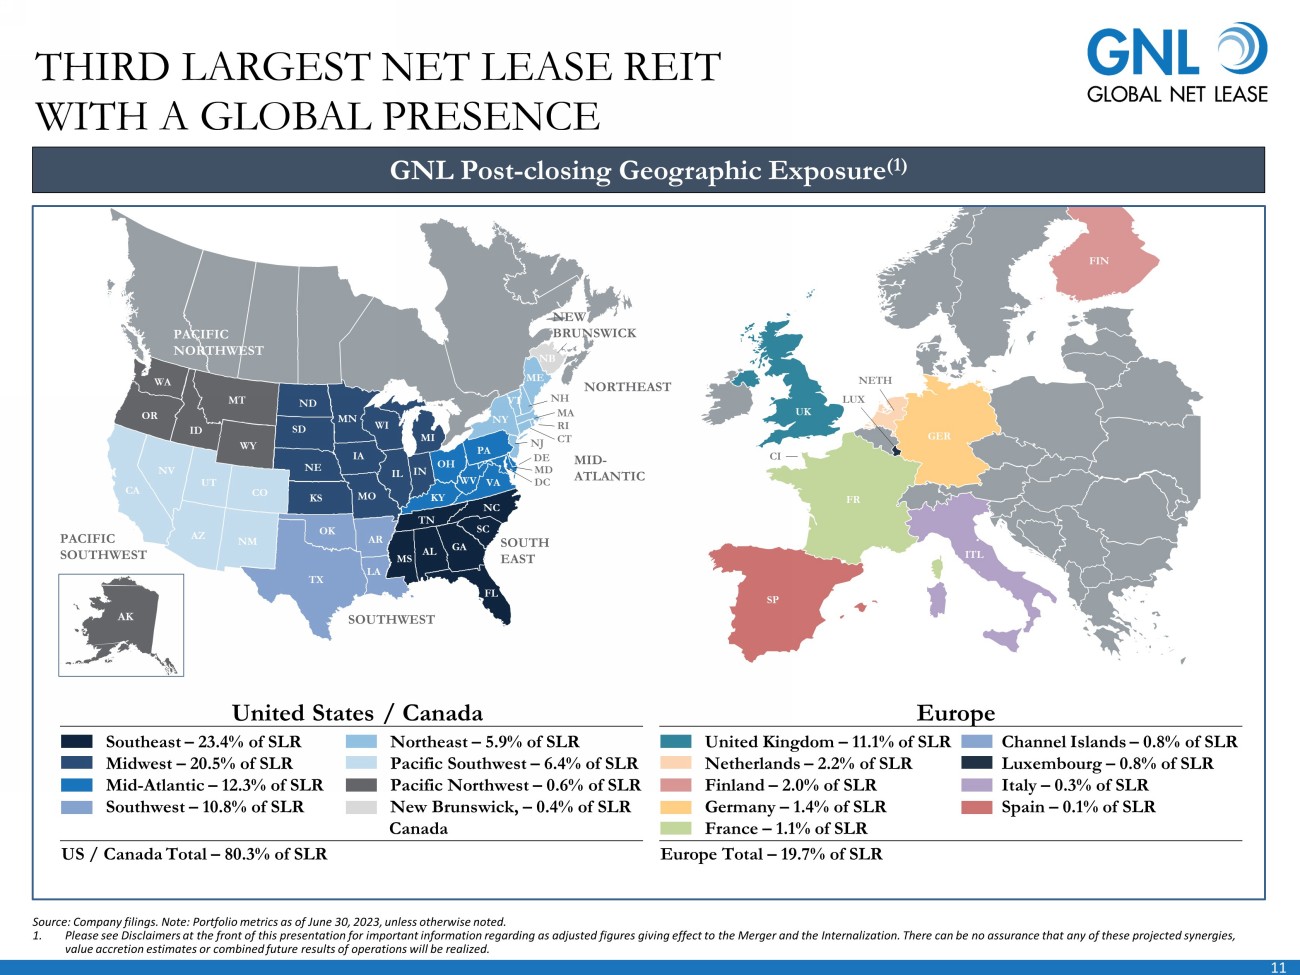
11 MIDWEST NC FL GA AL MS LA TX NM AZ CA NV UT OR WA ID MT WY CO ND SD NE KS OK AR MO IA MN WI MI IL IN OH KY TN SC NC VA WV PA NY VT NH ME MA CT NJ MD DE DC RI NB PACIFIC SOUTHWEST SOUTHWEST MID - ATLANTIC NEW BRUNSWICK PACIFIC NORTHWEST SOUTH EAST AK NORTHEAST THIRD LARGEST NET LEASE REIT WITH A GLOBAL PRESENCE GNL Post - closing Geographic Exposure (1) Source: Company filings. Note: Portfolio metrics as of June 30, 2023, unless otherwise noted. 1. Please see Disclaimers at the front of this presentation for important information regarding as adjusted figures giving effec t t o the Merger and the Internalization. There can be no assurance that any of these projected synergies, value accretion estimates or combined future results of operations will be realized. SP FR UK ITL GER LUX NETH FIN CI United States / Canada US / Canada Total – 80.3% of SLR Southeast – 23.4% of SLR Midwest – 20.5% of SLR Mid - Atlantic – 12.3% of SLR Southwest – 10.8% of SLR Northeast – 5.9% of SLR Pacific Southwest – 6.4% of SLR Pacific Northwest – 0.6% of SLR New Brunswick, – 0.4% of SLR Canada Europe Europe Total – 19.7% of SLR United Kingdom – 11.1% of SLR Netherlands – 2.2% of SLR Finland – 2.0% of SLR Germany – 1.4% of SLR France – 1.1% of SLR Channel Islands – 0.8% of SLR Luxembourg – 0.8% of SLR Italy – 0.3% of SLR Spain – 0.1% of SLR
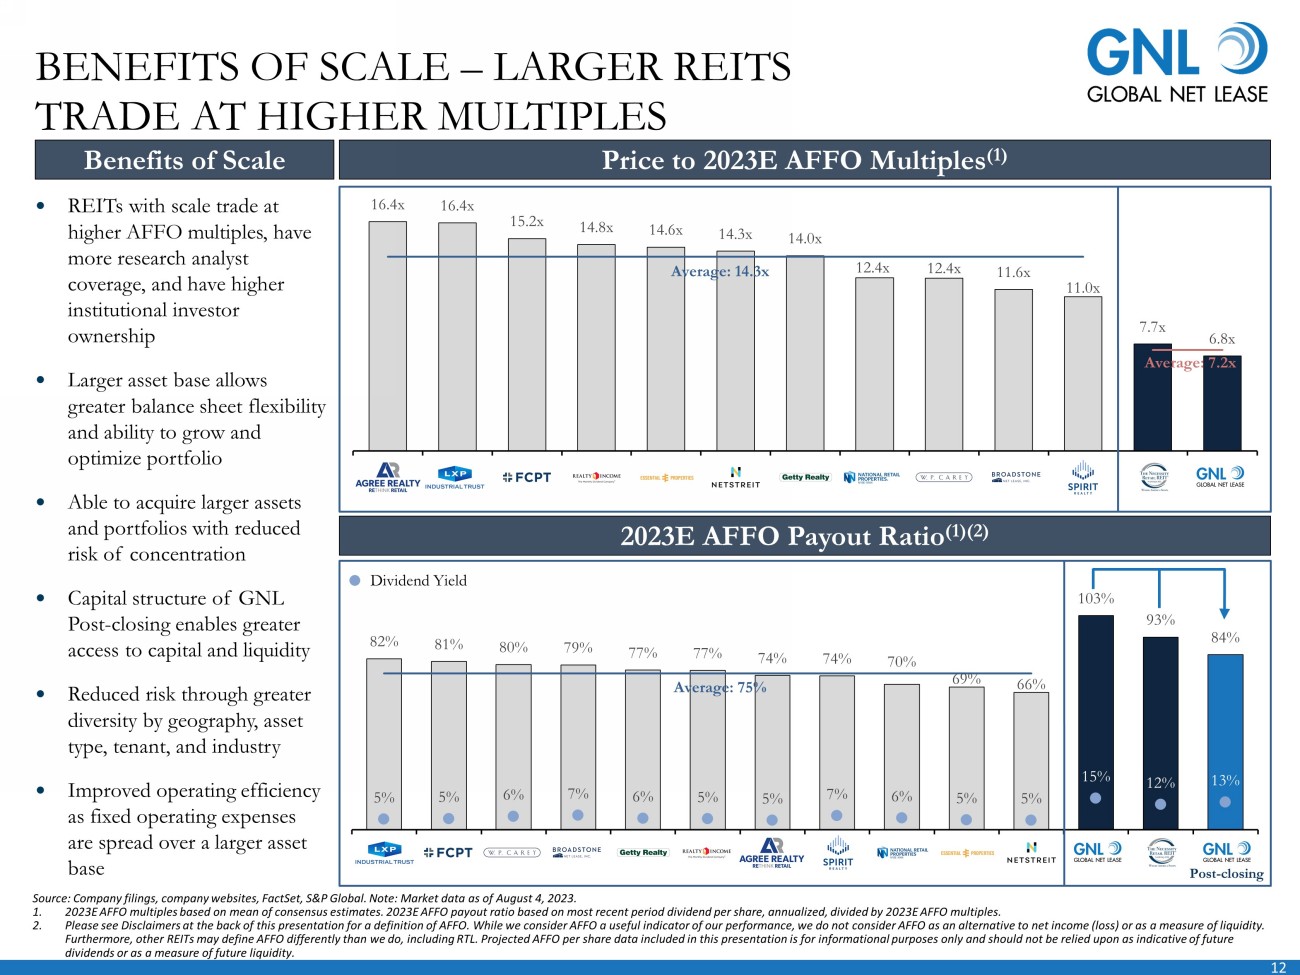
12 16.4x 16.4x 15.2x 14.8x 14.6x 14.3x 14.0x 12.4x 12.4x 11.6x 11.0x 7.7x 6.8x Average: 14.3x Average: 7.2x 82% 81% 80% 79% 77% 77% 74% 74% 70% 69% 66% 103% 93% 84% Average: 75% 5% 5% 6% 7% 6% 5% 5% 7% 6% 5% 5% 15% 12% 13% REITs with scale trade at higher AFFO multiples, have more research analyst coverage, and have higher institutional investor ownership Larger asset base allows greater balance sheet flexibility and ability to grow and optimize portfolio Able to acquire larger assets and portfolios with reduced risk of concentration Capital structure of GNL Post - closing enables greater access to capital and liquidity Reduced risk through greater diversity by geography, asset type, tenant, and industry Improved operating efficiency as fixed operating expenses are spread over a larger asset base BENEFITS OF SCALE – LARGER REITS TRADE AT HIGHER MULTIPLES Source: Company filings, company websites, FactSet, S&P Global. Note: Market data as of August 4, 2023. 1. 2023E AFFO multiples based on mean of consensus estimates. 2023E AFFO payout ratio based on most recent period dividend per s har e, annualized, divided by 2023E AFFO multiples. 2. Please see Disclaimers at the back of this presentation for a definition of AFFO. While we consider AFFO a useful indicator o f o ur performance, we do not consider AFFO as an alternative to net income (loss) or as a measure of liquidity. Furthermore, other REITs may define AFFO differently than we do, including RTL. Projected AFFO per share data included in thi s p resentation is for informational purposes only and should not be relied upon as indicative of future dividends or as a measure of future liquidity. Benefits of Scale Price to 2023E AFFO Multiples (1) 2023E AFFO Payout Ratio (1)(2) Dividend Yield Post - closing

13 Single - Tenant Industrial / Distribution 31% Single - Tenant Retail 21% Single - Tenant Office 20% Multi - Tenant Retail 28% Total Portfolio Annualized SLR by Segment Post - closing Industry Exposure (1)(3) Post - closing Credit Rating (1)(2)(3) Post - closing Asset Diversification (3) DIVERSIFIED AND STABLE TENANT BASE Single - Tenant Portfolio Multi - Tenant Portfolio Power Center 58% Anchored Center 22% Grocery Anchored 21% $728.9 million $528.0 million $200.8 million Financial Services , 6% Healthcare , 6% Auto Manufacturing , 6% Discount Retail , 5% Specialty Retail , 5% Gas/Convenience , 4% Home Improvement , 3% Freight , 3% Consumer Goods , 3% Quick Service Restaurant , 3% All Other , 56% Investment Grade 57% Non - Investment Grade 35% Not Rated 9%

14 GNL and RTL continued leasing momentum generated in Q1’23 and have completed over 158 lease renewals and tenant expansions year - to - date (1) . GNL and RTL’s leasing activity totaled 3.4 million square feet and nearly $85.5 million of net new straight - line rent 2023 (1) Lease Extensions + Expansion Project Updates GNL RTL (Multi - Tenant Portfolio) Lease Extensions, Expansions, and New Leases Completed 21 137 2023 Renewal Leasing Spread 0.7% 9.5% (2) Net Straight - Line Rent Extended + Expansion + New Leases $64.1 million $21.4 million Square Feet Extended + Expansion + New Leases 1,662,330 1,706,610 CONTINUED PROACTIVE LEASING RENEWAL AND EXPANSION ACTIVITY GNL Post - closing Lease Expiration Schedule (3) (Q2’23) 1% 8% 9% 7% 11% 65% 2023 2024 2025 2026 2027 Thereafter GNL Post-closing Lease Expiration Schedule
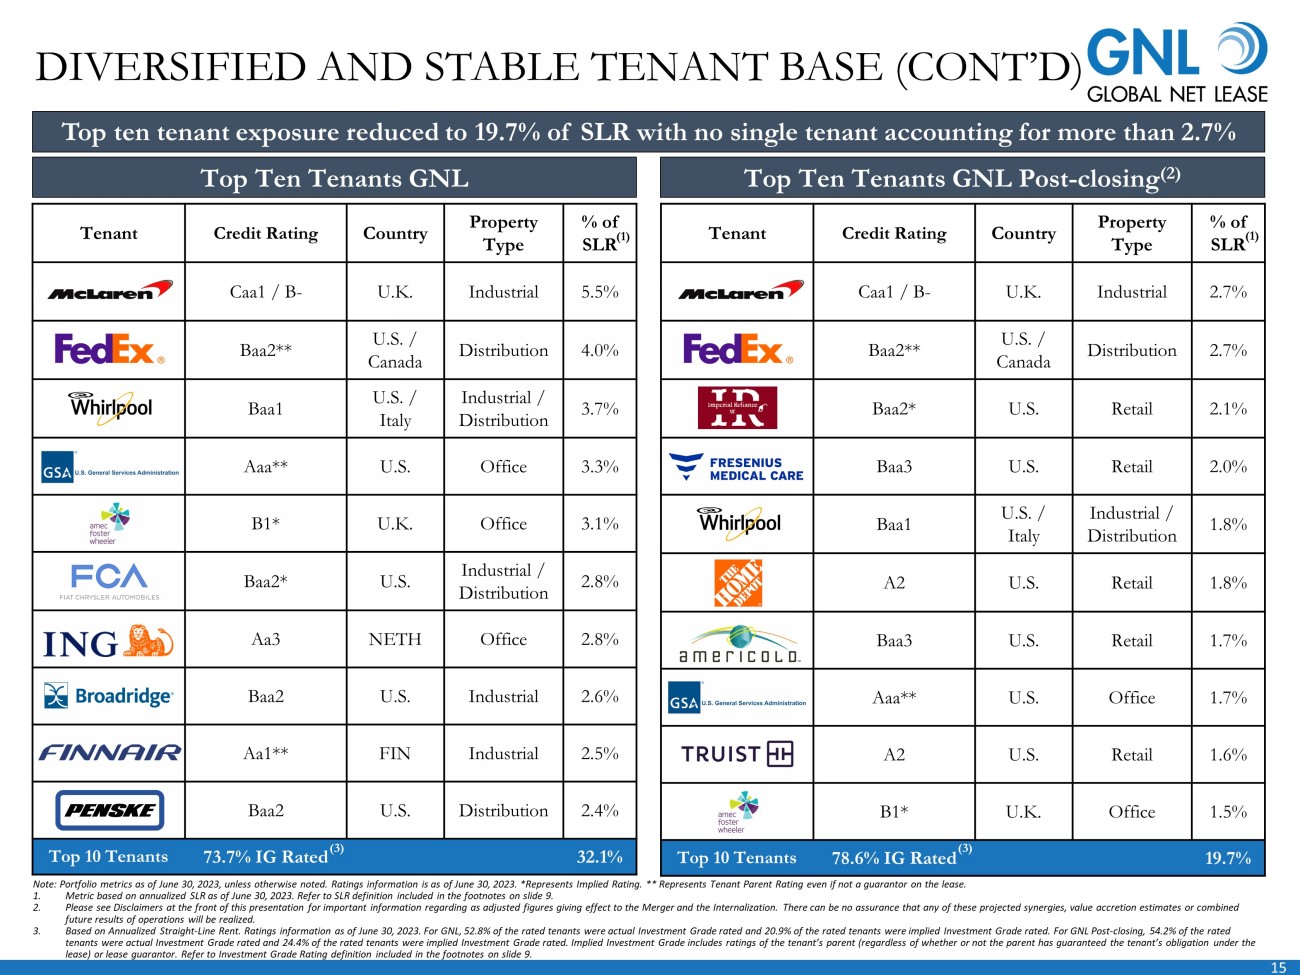
15 Tenant Credit Rating Country Property Type % of SLR Caa1 / B - U.K. Industrial 2.7% Baa2** U.S. / Canada Distribution 2.7% Baa2* U.S. Retail 2.1% Baa3 U.S. Retail 2.0% Baa1 U.S. / Italy Industrial / Distribution 1.8% A2 U.S. Retail 1.8% Baa3 U.S. Retail 1.7% Aaa** U.S. Office 1.7% A2 U.S. Retail 1.6% B1* U.K. Office 1.5% Top 10 Tenants 78.6% IG Rated 19.7% Tenant Credit Rating Country Property Type % of SLR Caa1 / B - U.K. Industrial 5.5% Baa2** U.S. / Canada Distribution 4.0% Baa1 U.S. / Italy Industrial / Distribution 3.7% Aaa** U.S. Office 3.3% B1* U.K. Office 3.1% Baa2* U.S. Industrial / Distribution 2.8% Aa3 NETH Office 2.8% Baa2 U.S. Industrial 2.6% Aa1** FIN Industrial 2.5% Baa2 U.S. Distribution 2.4% Top 10 Tenants 73.7% IG Rated 32.1% DIVERSIFIED AND STABLE TENANT BASE (CONT’D) Note: Portfolio metrics as of June 30, 2023 , unless otherwise noted . Ratings information is as of June 30, 2023. *Represents Implied Rating. ** Represents Tenant Parent Rating even if not a guar ant or on the lease. 1. Metric based on annualized SLR as of June 30, 2023. Refer to SLR definition included in the footnotes on slide 9 . 2. Please see Disclaimers at the front of this presentation for important information regarding as adjusted figures giving effec t t o the Merger and the Internalization. There can be no assurance that any of these projected synergies, value accretion estima tes or combined future results of operations will be realized. 3. Based on Annualized Straight - Line Rent. Ratings information as of June 30, 2023. For GNL, 52.8% of the rated tenants were actual Investment Grade rated and 20.9% of the rated tenants were implied Investment Grade rated. For GNL Post - closing, 54.2% of the r ated tenants were actual Investment Grade rated and 24.4% of the rated tenants were implied Investment Grade rated. Implied Invest men t Grade includes ratings of the tenant’s parent (regardless of whether or not the parent has guaranteed the tenant’s obligati on under the lease) or lease guarantor. Refer to Investment Grade Rating definition included in the footnotes on slide 9. Top Ten Tenants GNL Top Ten Tenants GNL Post - closing (2) Top ten tenant exposure reduced to 19.7% of SLR with no single tenant accounting for more than 2.7% (1) (1) (3) (3)
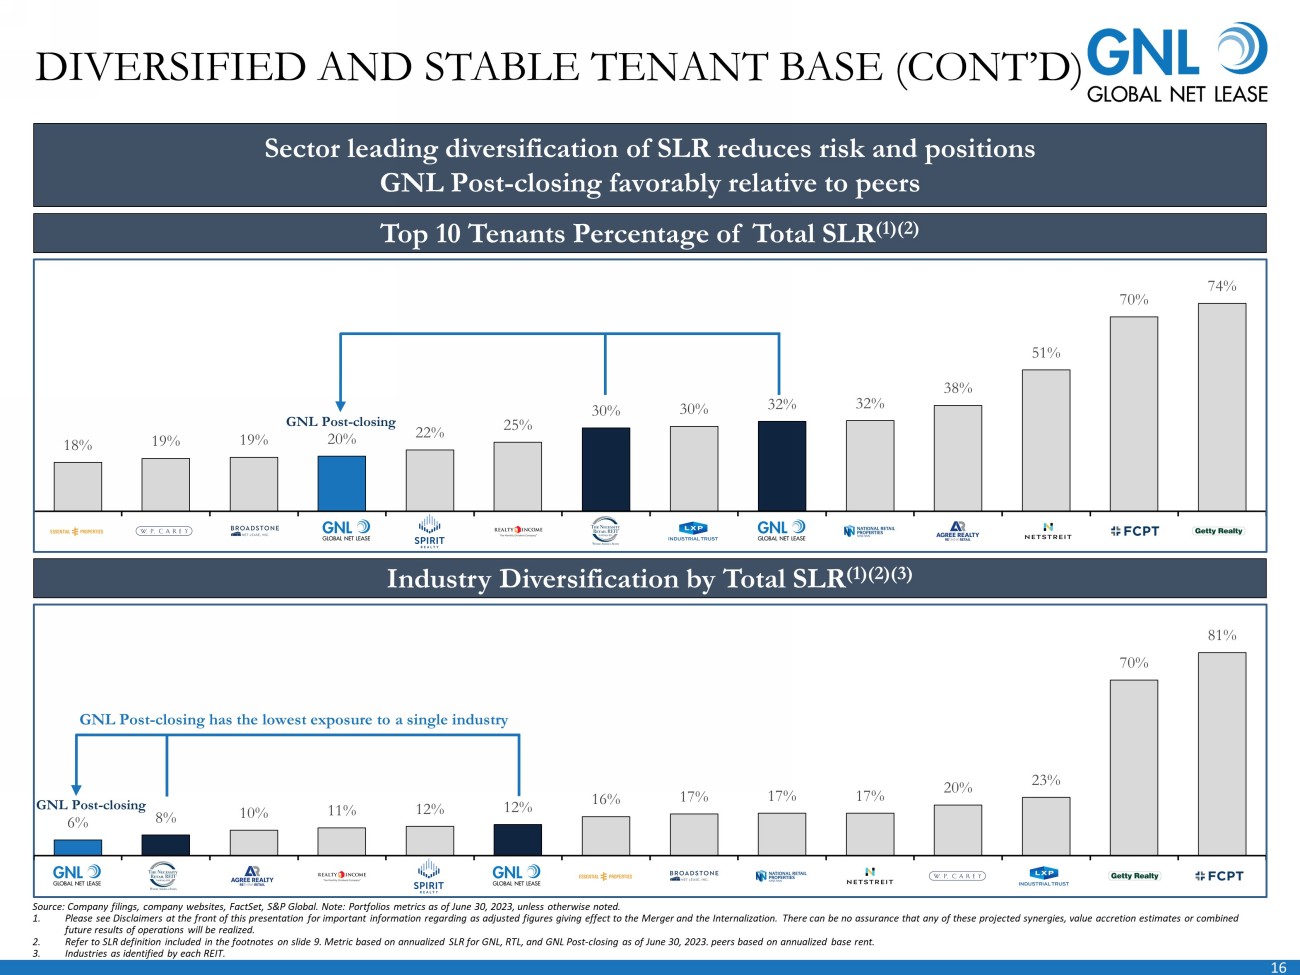
16 18% 19% 19% 20% 22% 25% 30% 30% 32% 32% 38% 51% 70% 74% DIVERSIFIED AND STABLE TENANT BASE (CONT’D) Top 10 Tenants Percentage of Total SLR (1)(2) Source: Company filings, company websites, FactSet, S&P Global. Note: Portfolios metrics as of June 30, 2023, unless otherwis e n oted. 1. Please see Disclaimers at the front of this presentation for important information regarding as adjusted figures giving effec t t o the Merger and the Internalization. There can be no assurance that any of these projected synergies, value accretion estima tes or combined future results of operations will be realized. 2. Refer to SLR definition included in the footnotes on slide 9. Metric based on annualized SLR for GNL, RTL, and GNL Post - closing as of June 30, 2023. peers based on annualized base rent. 3. Industries as identified by each REIT. Industry Diversification by Total SLR (1)(2)(3) 6% 8% 10% 11% 12% 12% 16% 17% 17% 17% 20% 23% 70% 81% Sector leading diversification of SLR reduces risk and positions GNL Post - closing favorably relative to peers GNL Post - closing has the lowest exposure to a single industry GNL Post - closing GNL Post - closing
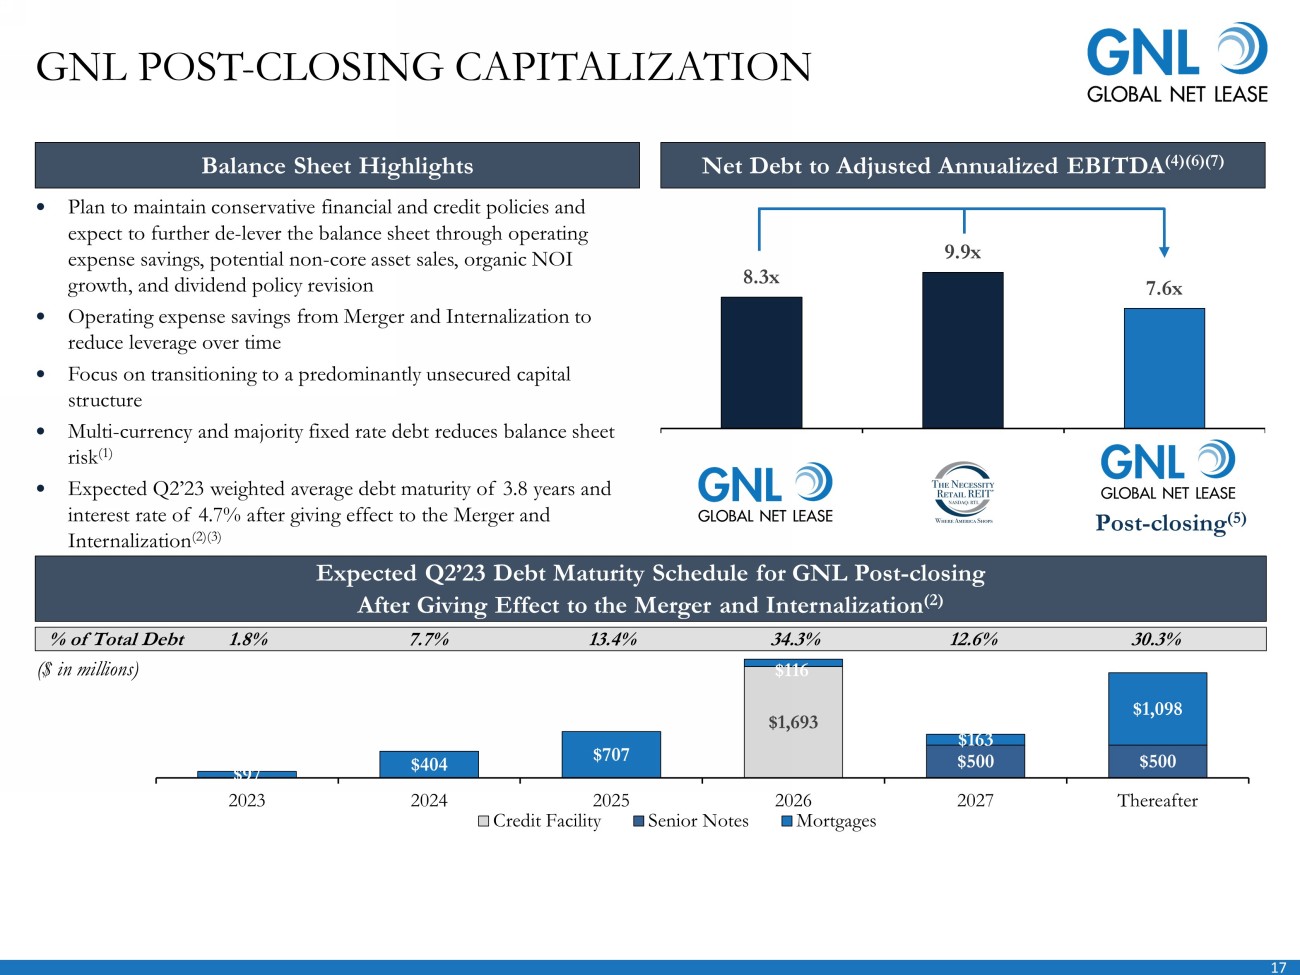
17 Plan to maintain conservative financial and credit policies and expect to further de - lever the balance sheet through operating expense savings, potential non - core asset sales, organic NOI growth, and dividend policy revision Operating expense savings from Merger and Internalization to reduce leverage over time Focus on transitioning to a predominantly unsecured capital structure Multi - currency and majority fixed rate debt reduces balance sheet risk (1) Expected Q2’23 weighted average debt maturity of 3.8 years and interest rate of 4.7% after giving effect to the Merger and Internalization (2)(3) GNL POST - CLOSING CAPITALIZATION $1,693 $500 $500 $97 $404 $707 $116 $163 $1,098 2023 2024 2025 2026 2027 Thereafter Credit Facility Senior Notes Mortgages Expected Q2’23 Debt Maturity Schedule for GNL Post - closing After Giving Effect to the Merger and Internalization (2) % of Total Debt 1.8% 7.7% 13.4% 34.3% 12.6% 30.3% Balance Sheet Highlights Net Debt to Adjusted Annualized EBITDA (4)(6)(7) ($ in millions) 8.3x 9.9x 7.6x Post - closing (5)

18 LEADERSHIP OVERVIEW Board of Directors Management Michael Weil , Director Refer to “Management” section for Michael Weil’s biography Michael Weil , Co - Chief Executive Officer Currently CEO of RTL Previously served as Senior VP of sales and leasing for American Financial Realty Trust Served as president of the Board of Directors of the Real Estate Investment Securities Association (n/k/a ADISA) James Nelson , Co - Chief Executive Officer Currently CEO of GNL Joined GNL Board in March 2017 Currently serves Chairman of the Board of Xerox Holdings Corporation. Also currently serves as an independent director and chair of the audit committee for Chewy, Inc. Chris Masterson , Chief Financial Officer Currently Chief Financial Officer of Global Net Lease Previously served as Chief Accounting Officer of GNL Past experience includes accounting positions with Goldman Sachs and KPMG Sue Perrotty , Non - Executive Chairperson of the Board of Directors Currently serves as President and Chief Executive Officer of AFM Financial Services and Tower Health James Nelson , Director Refer to “Management” section for James Nelson’s biography Edward Rendell , Independent Director Previously served as the 45th Governor of the Commonwealth of Pennsylvania and as the Mayor of Philadelphia Lisa Kabnick , Independent Director Currently serves as senior advisor for Troutman Pepper Hamilton Sanders LLP Therese Antone , Independent Director Currently serves as the Chancellor of Salve Regina University since her appointment in 2009 Abby Wenzel , Independent Director Previously served as co - chair of Cozen O’Connor’s Real Estate Group Leslie Michelson , Independent Director Currently serves as lead independent director of Franklin BSP Franklin Lending Corporation Stanley Perla , Independent Director Previously served as a member of the board of directors and the chair of the audit committee of Madison Harbor Balanced Strategies, Inc Highly experienced leadership team and majority independent Board of Directors Independent Directors Inside Directors
19 Opt out of the classified board provision of the Maryland Unsolicited Takeovers Act (“MUTA”) Declassify its Board of Directors, so that seven of the nine directors would stand for election to annual terms at the 2024 annual meeting of stockholders, and all nine directors would stand for election to annual terms at the 2025 annual meeting Repeal Company’s Stockholder Rights Plan (commonly referred to in the industry as a “poison pill”) Amend bylaws to delete the requirement that up to two board members to be “managing directors” At the time of, and subject to the close of the Merger and the Internalization, GNL will enhance its corporate governance by committing to the following actions: GOVERNANCE UPDATE

20 No Shareholder Rights Plan (No Poison Pill in force) Opted out of the Maryland Unsolicited Takeovers Act (“MUTA”) (1) Declassified Board No Managing Director Required on Board (2) Shareholders Can Call Special Meetings No Cumulative Voting At the time of, and subject to the close of the Merger and the Internalization, GNL Post - Closing will possess corporate governance provisions that are more in line with peers GOVERNANCE UPDATE (CONT’D) GNL Post - Closing Source: Company filings, company websites, FactSet 1. Market data reflects REITs that have made public announcements of opting out of the Maryland Unsolicited Takeovers Act (“MUTA ”). 2. Market data reflects REITs that have made public announcements of requiring Managing Directors to sit on the Board.
21 KEY TAKEAWAYS Stockholders in GNL Post - closing expected to realize value through an enhanced portfolio, increased diversification, and substantial cost savings (1) +9% accretive relative to GNL’s Q1’23 AFFO per share on an annualized basis (2)(3) Substantial immediate and longer - term cost savings and earnings accretion – Approximately $54 million realized immediately at transaction close from Internalization and approximately $21 million realized within 12 months of transaction close from Merger synergies Net debt to annualized adjusted EBITDA reduced from 8.3x in Q2'23 to estimated 7.6x in Q4’23 (3) Enhanced portfolio with greater diversity by geography, asset type, tenant, and industry, spanning industrial, retail, and office assets across North America and Europe. Largest tenant contributes only 2.7% of total SLR (4) 3 rd largest net lease REIT with a global presence with significantly increased size, scale, and prominence Positioned for growth through broadened acquisition capabilities and larger asset base that enables greater balance sheet flexibility and ability to grow and optimize portfolio Internalized management supplements accretion from Merger synergies by eliminating all management fees Enhanced corporate governance with a majority - independent, declassified Board of Directors and repeal of Stockholder Rights Plan (commonly referred to in the industry as a “poison pill”) Potential trading multiple expansion as investors recognize the value created through the Merger and Internalization. Internally managed peers trade at an average 14.3x price to 2023E AFFO multiple compared to current RTL and GNL average of 7.2x (5) 1. Please see Disclaimers at the front of this presentation for important information regarding as adjusted figures giving effec t t o the Merger and the Internalization. There can be no assurance that any of these projected synergies, value accretion estimates or combined future results of operations will be realized. 2. % accretion based on estimated Q4'23 annualized AFFO per share, which gives effect to Merger and Internalization. 3. Please see Disclaimers at back of this presentation for a definition of all non - GAAP measures and a reconciliation to the Compan y's most directly comparable GAAP. 4. B ased on annualized SLR as of June 30, 2023. Refer to SLR definition included in the footnotes on slide 9. 5. Please see Disclaimers at the back of this presentation for a definition of AFFO. While we consider AFFO a useful indicator o f o ur performance, we do not consider AFFO as an alternative to net income (loss) or as a measure of liquidity. Furthermore, other REITs may define AFFO differently than we do, including RTL. Projected AFFO per share data included in thi s p resentation is for informational purposes only and should not be relied upon as indicative of future dividends or as a measure of future liquidity.
22 FINANCIAL DEFINITIONS Non - GAAP Financial Measures This section discusses non - GAAP financial measures we use to evaluate our performance, including Funds from Operations (“FFO”), Core Funds from Operations (“Core FFO”), Adjusted Funds from Operations (“AFFO”), Adjusted Earnings before Interest, Taxes, Deprec iat ion and Amortization (“Adjusted EBITDA”), Net Operating Income (“NOI”), Cash Net Operating Income (“Cash NOI”), and Constant Currency . W hile NOI is a property - level measure, AFFO is based on total Company performance and therefore reflects the impact of other items not specifically associated with NOI such as, interest expense, general and administrative expenses and operating fees to related parties. Add iti onally, NOI as defined herein, does not reflect an adjustment for straight - line rent but AFFO does include this adjustment. A description of th ese non - GAAP measures and reconciliations to the most directly comparable GAAP measure, which is net income, is provided below. Caution on Use of Non - GAAP Measures FFO, Core FFO, AFFO, Adjusted EBITDA, NOI, Cash NOI, and Constant Currency should not be construed to be more relevant or acc ura te than the current GAAP methodology in calculating net income or in its applicability in evaluating our operating performance. The method utilized to evaluate the value and performance of real estate under GAAP should be construed as a more relevant measure of operational pe rformance and considered more prominently than the non - GAAP measures. Other REITs may not define FFO in accordance with the current National Association of Real Estate Investment Trusts (“NAREIT” ) d efinition (as we do), or may interpret the current NAREIT definition differently than we do, or may calculate Core FFO or AFFO differen tly than we do. Consequently, our presentation of FFO, Core FFO and AFFO may not be comparable to other similarly - titled measures presented by o ther REITs. We consider FFO, Core FFO and AFFO useful indicators of our performance. Because FFO, Core FFO and AFFO calculations exclude suc h factors as depreciation and amortization of real estate assets and gain or loss from sales of operating real estate assets (w hic h can vary among owners of identical assets in similar conditions based on historical cost accounting and useful - life estimates), FFO, Core FFO a nd AFFO presentations facilitate comparisons of operating performance between periods and between other REITs in our peer group.
23 FINANCIAL DEFINITIONS Caution on Use of Non - GAAP Measures (cont’d) We consider FFO, Core FFO and AFFO useful indicators of our performance. Because FFO, Core FFO and AFFO calculations exclude suc h factors as depreciation and amortization of real estate assets and gain or loss from sales of operating real estate assets (w hic h can vary among owners of identical assets in similar conditions based on historical cost accounting and useful - life estimates), FFO, Core FFO a nd AFFO presentations facilitate comparisons of operating performance between periods and between other REITs in our peer group. Constant currency results exclude any benefit or loss caused by foreign exchange fluctuations between foreign currencies and the United States dollar which would not have occurred if there had been a constant exchange rate. Revenue from tenants on a Constant Currency bas is is calculated by applying the average monthly currency rates from prior comparable period to Revenues from tenants from the appl ica ble period. We believe that this measure provides investors with information about revenue results and trends that eliminates currency volat ili ty while increasing the comparability of our underlying results and trends. Funds from Operations, Core Funds from Operations and Adjusted Funds from Operations Funds From Operations Due to certain unique operating characteristics of real estate companies, as discussed below, NAREIT, an industry trade group , h as promulgated a measure known as FFO, which we believe to be an appropriate supplemental measure to reflect the operating performance of a RE IT. FFO is not equivalent to net income or loss as determined under GAAP. We calculate FFO, a non - GAAP measure, consistent with the standards established over time by the Board of Governors of NAREIT, a s restated in a White Paper approved by the Board of Governors of NAREIT effective in December 2018 (the “White Paper”). The White Paper de fines FFO as net income or loss computed in accordance with GAAP, excluding depreciation and amortization related to real estate, g ain and loss from the sale of certain real estate assets, gain and loss from change in control and impairment write - downs of certain real estate a ssets and investments in entities when the impairment is directly attributable to decreases in the value of depreciable real estate held by the ent ity . Adjustments for unconsolidated partnerships and joint ventures are calculated to exclude the proportionate share of the non - controlling interest to arrive at FFO, Core FFO, AFFO and NOI attributable to stockholders, as applicable. Our FFO calculation complies with NAREIT’s definition.
24 FINANCIAL DEFINITIONS Funds from Operations, Core Funds from Operations and Adjusted Funds from Operations (Cont’d) Funds From Operations (Cont’d) Due to certain unique operating characteristics of real estate companies, as discussed below, NAREIT, an industry trade group , h as promulgated a measure known as FFO, which we believe to be an appropriate supplemental measure to reflect the operating performance of a RE IT. FFO is not equivalent to net income or loss as determined under GAAP. We calculate FFO, a non - GAAP measure, consistent with the standards established over time by the Board of Governors of NAREIT, a s restated in a White Paper approved by the Board of Governors of NAREIT effective in December 2018 (the “White Paper”). The White Paper de fines FFO as net income or loss computed in accordance with GAAP, excluding depreciation and amortization related to real estate, g ain and loss from the sale of certain real estate assets, gain and loss from change in control and impairment write - downs of certain real estate a ssets and investments in entities when the impairment is directly attributable to decreases in the value of depreciable real estate held by the ent ity . Adjustments for unconsolidated partnerships and joint ventures are calculated to exclude the proportionate share of the non - controlling interest to arrive at FFO, Core FFO, AFFO and NOI attributable to stockholders, as applicable. Our FFO calculation complies with NAREIT’s definition. The historical accounting convention used for real estate assets requires straight - line depreciation of buildings and improvemen ts, and straight - line amortization of intangibles, which implies that the value of a real estate asset diminishes predictably over time. We believe th at, because real estate values historically rise and fall with market conditions, including inflation, interest rates, unemployment and consumer spen din g, presentations of operating results for a REIT using historical accounting for depreciation and certain other items may be less informative. Hi sto rical accounting for real estate involves the use of GAAP. Any other method of accounting for real estate such as the fair value method cannot be con strued to be any more accurate or relevant than the comparable methodologies of real estate valuation found in GAAP. Nevertheless, we believe tha t the use of FFO, which excludes the impact of real estate related depreciation and amortization, among other things, provides a more comp let e understanding of our performance to investors and to management, and, when compared year over year, reflects the impact on ou r o perations from trends in occupancy rates, rental rates, operating costs, general and administrative expenses, and interest costs, which ma y not be immediately apparent from net income.

25 FINANCIAL DEFINITIONS Funds from Operations, Core Funds from Operations and Adjusted Funds from Operations (Cont’d) Core Funds From Operations In calculating Core FFO, we start with FFO, then we exclude certain non - core items such as merger, transaction and other costs, settlement costs related to our Blackwells/Related Parties litigation, as well as certain other costs that are considered to be non - core, such as debt extinguishment costs, fire loss and other costs related to damages at our properties. The purchase of properties, and the corresponding expe nse s associated with that process, is a key operational feature of our core business plan to generate operational income and cash flows in order t o m ake dividend payments to stockholders. In evaluating investments in real estate, we differentiate the costs to acquire the investment from th e subsequent operations of the investment. We also add back non - cash write - offs of deferred financing costs and prepayment penalties incurred with the early extinguishment of debt which are included in net income but are considered financing cash flows when paid in the statement of ca sh flows. We consider these write - offs and prepayment penalties to be capital transactions and not indicative of operations. By excluding exp ensed acquisition, transaction and other costs as well as non - core costs, we believe Core FFO provides useful supplemental information that is comp arable for each type of real estate investment and is consistent with management’s analysis of the investing and operating performance of our pr operties. Adjusted Funds From Operations In calculating AFFO, we start with Core FFO, then we exclude certain income or expense items from AFFO that we consider more ref lective of investing activities, other non - cash income and expense items and the income and expense effects of other activities that are no t a fundamental attribute of our business plan. These items include early extinguishment of debt and other items excluded in Core FFO as well as unrealized gain and loss, which may not ultimately be realized, such as gain or loss on derivative instruments, gain or loss on foreign curre ncy transactions, and gain or loss on investments. In addition, by excluding non - cash income and expense items such as amortization of above - market an d below - market leases intangibles, amortization of deferred financing costs, straight - line rent and equity - based compensation from AFFO, we believe we provide useful information regarding income and expense items which have a direct impact on our ongoing operating performance . W e also exclude revenue attributable to the reimbursement by third parties of financing costs that we originally incurred because the se revenues are not, in our view, related to operating performance. We also include the realized gain or loss on foreign currency exchange contracts for AFFO as such items are part of our ongoing operations and affect our current operating performance.
26 FINANCIAL DEFINITIONS Funds from Operations, Core Funds from Operations and Adjusted Funds from Operations (Cont’d) Adjusted Funds From Operations (cont’d) In calculating AFFO, we exclude certain expenses which under GAAP are characterized as operating expenses in determining oper ati ng net income. All paid and accrued acquisition, transaction and other costs (including prepayment penalties for debt extinguishment s) and certain other expenses, including general and administrative expenses incurred for the 2023 proxy contest and related Blackwells/Related Pa rti es litigation, negatively impact our operating performance during the period in which expenses are incurred or properties are acquired and w ill also have negative effects on returns to investors, but are excluded by us as we believe they are not reflective of our on - going performan ce. Further, under GAAP, certain contemplated non - cash fair value and other non - cash adjustments are considered operating non - cash adjustments to n et income. In addition, as discussed above, we view gain and loss from fair value adjustments as items which are unrealized and may not ult imately be realized and not reflective of ongoing operations and are therefore typically adjusted for when assessing operating performance. Exclu din g income and expense items detailed above from our calculation of AFFO provides information consistent with management’s analysis of our o per ating performance. Additionally, fair value adjustments, which are based on the impact of current market fluctuations and underlyin g a ssessments of general market conditions, but can also result from operational factors such as rental and occupancy rates, may not be direct ly related or attributable to our current operating performance. By excluding such changes that may reflect anticipated and unrealized gain or loss, we believe AFFO provides useful supplemental information. By providing AFFO, we believe we are presenting useful information that can be us ed to, among other things, assess our performance without the impact of transactions or other items that are not related to our port fol io of properties. AFFO presented by us may not be comparable to AFFO reported by other REITs that define AFFO differently. Furthermore, we beli eve that in order to facilitate a clear understanding of our operating results, AFFO should be examined in conjunction with net income (l oss ) calculated in accordance with GAAP and presented in our consolidated financial statements. AFFO should not be considered as an alternative to net income (loss) as an indication of our performance or to cash flows as a measure of our liquidity or ability to make distributions.
27 FINANCIAL DEFINITIONS Adjusted Earnings before Interest, Taxes, Depreciation and Amortization, Net Operating Income, Cash Net Operating Income, and Constant Currency. We believe that Adjusted EBITDA, which is defined as earnings before interest, taxes, depreciation and amortization adjusted for acquisition, transaction and other costs, other non - cash items and including our pro - rata share from unconsolidated joint ventures, is an app ropriate measure of our ability to incur and service debt. We also exclude revenue attributable to the reimbursement by third parties of finan cin g costs that we originally incurred because these revenues are not, in our view, related to operating performance. All paid and accrued acqui sit ion, transaction and other costs (including prepayment penalties for debt extinguishments) and certain other expenses, including general and admin ist rative expenses incurred for the 2023 proxy contest and related Blackwells/Related Parties litigation, negatively impact our operating perfor man ce during the period in which expenses are incurred or properties are acquired and will also have negative effects on returns to investors, bu t are not reflective of on - going performance. Due to the increase in general and administrative expenses as a result of the 2023 proxy contest and re lated litigation as a portion of our total general and administrative expenses in the first quarter of 2023, we began including this adjustment t o a rrive at Adjusted EBITDA in order to better reflect our operating performance. Adjusted EBITDA for the fourth quarter of 2022 (the only prior p eri od with these types of costs) has been conformed to this presentation. Adjusted EBITDA should not be considered as an alternative to cash f low s from operating activities, as a measure of our liquidity or as an alternative to net income as an indicator of our operating activ iti es. Other REITs may calculate Adjusted EBITDA differently and our calculation should not be compared to that of other REITs.
28 FINANCIAL DEFINITIONS Adjusted Earnings before Interest, Taxes, Depreciation and Amortization, Net Operating Income, Cash Net Operating Income, and Constant Currency. (Cont’d) NOI is a non - GAAP financial measure equal to net income (loss), the most directly comparable GAAP financial measure, less discon tinued operations, interest, other income and income from preferred equity investments and investment securities, plus corporate gen era l and administrative expense, acquisition, transaction and other costs, depreciation and amortization, other noncash expenses and i nte rest expense. We use NOI internally as a performance measure and believe NOI provides useful information to investors regarding our financial con dition and results of operations because it reflects only those income and expense items that are incurred at the property level. Theref ore , we believe NOI is a useful measure for evaluating the operating performance of our real estate assets and to make decisions about resource allo cat ions. Further, we believe NOI is useful to investors as a performance measure because, when compared across periods, NOI reflects the impact on op erations from trends in occupancy rates, rental rates, operating costs and acquisition activity on an unlevered basis, providing perspectiv e n ot immediately apparent from net income. NOI excludes certain components from net income in order to provide results that are more closely r ela ted to a property’s results of operations. For example, interest expense is not necessarily linked to the operating performance of a r eal estate asset and is often incurred at the corporate level as opposed to the property level. In addition, depreciation and amortization, because o f h istorical cost accounting and useful life estimates, may distort operating performance at the property level. NOI presented by us may not be co mparable to NOI reported by other REITs that define NOI differently. We believe that in order to facilitate a clear understanding of our ope rating results, NOI should be examined in conjunction with net income (loss) as presented in our consolidated financial statements. NOI shoul d n ot be considered as an alternative to net income (loss) as an indication of our performance or to cash flows as a measure of our li qui dity Cash NOI is a non - GAAP financial measure that is intended to reflect the performance of our properties. We define Cash NOI as ne t operating income (which is separately defined herein) excluding amortization of above/below market lease intangibles and straight - line adj ustments that are included in GAAP lease revenues. We believe that Cash NOI is a helpful measure that both investors and management can use to eva luate the current financial performance of our properties and it allows for comparison of our operating performance between periods and to other REITs. Cash NOI should not be considered as an alternative to net income, as an indication of our financial performance, or to cash flo ws as a measure of liquidity or our ability to fund all needs. The method by which we calculate and present Cash NOI may not be directly comp ara ble to the way other REITs calculate and present Cash NOI.
29 FINANCIAL DEFINITIONS Adjusted Earnings before Interest, Taxes, Depreciation and Amortization, Net Operating Income, Cash Net Operating Income, and Constant Currency. (Cont’d) Cash Paid for Interest is calculated based on the interest expense less non - cash portion of interest expense and amortization of mortgage (discount) premium, net. Management believes that Cash Paid for Interest provides useful information to investors to assess o ur overall solvency and financial flexibility. Cash Paid for Interest should not be considered as an alternative to interest expense as determine d i n accordance with GAAP or any other GAAP financial measures and should only be considered together with and as a supplement to our financial in for mation prepared in accordance with GAAP. Constant currency results exclude any benefit or loss caused by foreign exchange fluctuatio ns between foreign currencies and the United States dollar which would not have occurred if there had been a constant exchange rate. Revenue fro m t enants on a Constant Currency basis is calculated by applying the average monthly currency rates from prior comparable period to Revenues fr om tenants from the applicable period. We believe that this measure provides investors with information about revenue results and trends th at eliminates currency volatility while increasing the comparability of our underlying results and trends.
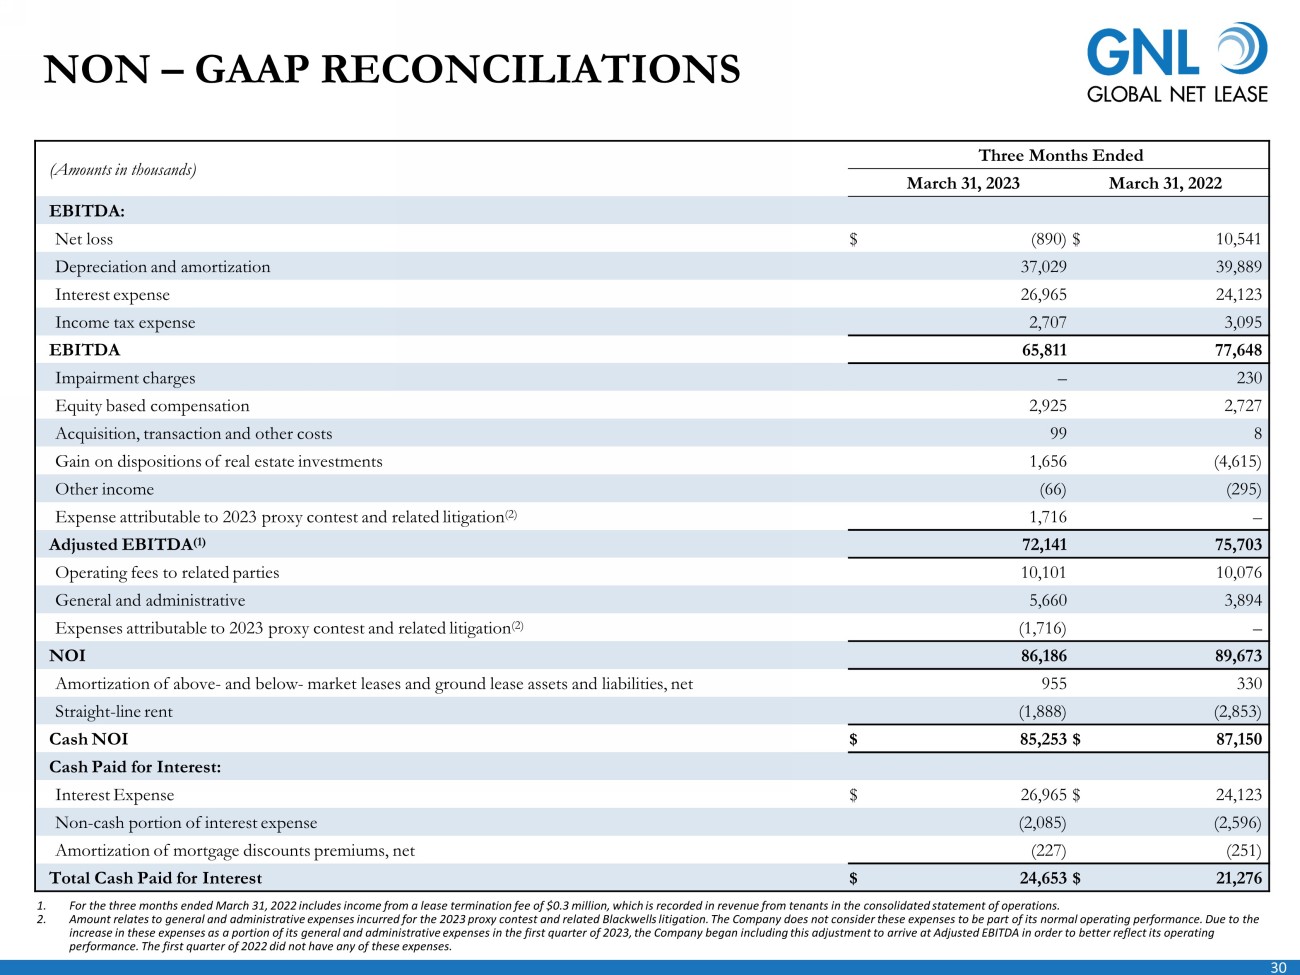
30 NON – GAAP RECONCILIATIONS (Amounts in thousands) Three Months Ended March 31, 2023 March 31, 2022 EBITDA: Net loss $ (890) $ 10,541 Depreciation and amortization 37,029 39,889 Interest expense 26,965 24,123 Income tax expense 2,707 3,095 EBITDA 65,811 77,648 Impairment charges – 230 Equity based compensation 2,925 2,727 Acquisition, transaction and other costs 99 8 Gain on dispositions of real estate investments 1,656 (4,615) Other income (66) (295) Expense attributable to 2023 proxy contest and related litigation (2) 1,716 – Adjusted EBITDA (1) 72,141 75,703 Operating fees to related parties 10,101 10,076 General and administrative 5,660 3,894 Expenses attributable to 2023 proxy contest and related litigation (2) (1,716) – NOI 86,186 89,673 Amortization of above - and below - market leases and ground lease assets and liabilities, net 955 330 Straight - line rent (1,888) (2,853) Cash NOI $ 85,253 $ 87,150 Cash Paid for Interest: Interest Expense $ 26,965 $ 24,123 Non - cash portion of interest expense (2,085) (2,596) Amortization of mortgage discounts premiums, net (227) (251) Total Cash Paid for Interest $ 24,653 $ 21,276 1. For the three months ended March 31, 2022 includes income from a lease termination fee of $0.3 million, which is recorded in rev enue from tenants in the consolidated statement of operations. 2. Amount relates to general and administrative expenses incurred for the 2023 proxy contest and related Blackwells litigation. The Company does not consider these expenses to be part of its normal operating performance. Due to the increase in these expenses as a portion of its general and administrative expenses in the first quarter of 2023, the Company beg an including this adjustment to arrive at Adjusted EBITDA in order to better reflect its operating performance. The first quarter of 2022 did not have any of these expenses.

31 NON – GAAP RECONCILIATIONS (Amounts in thousands) Three Months Ended March 31, 2023 March 31, 2022 Funds from operations (FFO): Net (loss) income attributable to common stockholders (in accordance with GAAP) $ (5,989) $ 5,483 Impairment charges – 230 Depreciation and amortization 37,029 39,889 FFO (as defined by NAREIT) attributable to stockholders (1) 31,040 45,602 Acquisition, transaction and other costs 99 8 Core FFO attributable to stockholders (1) 31,139 45,610 Non - cash equity based compensation 2,925 2,727 Non - cash portion of interest expense 2,085 2,596 Amortization related to above - and below - market lease intangibles and right - of - use assets, net 955 330 Straight - line rent (1,888) (2,853) Straight - line rent (rent deferral agreement) (2) – (120) Eliminate unrealized gains on foreign currency transactions (3) 2,647 (4,210) Amortization of mortgage discounts 227 251 Expenses attributable to 2023 proxy contest and related litigation (4) 1,716 – Adjusted funds from operations (AFFO) attributable to stockholders (1) $ 39,806 $ 44,331 Basic weighted - average shares outstanding 103,783 103,596 Diluted weighted - average shares outstanding 103,783 103,596 Net (loss) income per share attributable to common stockholders $ (0.06) $ 0.05 FFO per shar e $ 0.30 $ 0.44 Core FFO per share $ 0.30 $ 0.44 AFFO per share $ 0.38 $ 0.43 Dividends declared $ 41,677 $ 41,566 Revenue from tenants - Quarter Ended March 31, 2023 $ 94,332 Foreign currency translation impact (using average foreign currency exchange rates for the first quarter of 2022) 3,176 Revenue from Tenants (year over year constant currency adjusted): $ 97,508 (Amounts in thousands) 1. FFO, Core FFO and AFFO for the three months ended March 31, 2022 include income from a lease termination fee of $0.3 million, wh ich is recorded in revenue from tenants in the consolidated statement of operations. The termination fee of approximately $9.0 million which was paid by the tenant at the end of the lease term on January 4, 2022 was earned and record ed as income evenly over the period from September 3, 2021 through January 4, 2022. 2. Represents amounts related to deferred rent pursuant to lease negotiations which qualify for FASB relief for which rent was d efe rred but not reduced. These amounts are included in the straight - line rent receivable on our balance sheet but are considered to be earned revenue attributed to the current period for rent that was deferred, for purposes of AFFO, as they ar e e xpected to be collected. Accordingly, when the deferred amounts are collected, the amounts reduce AFFO. As of March 31, 2023, the Company has collected all previously deferred rents. 3. For AFFO purposes, we add back unrealized (gain) loss. For the three months ended March 31, 2023, the loss on derivative inst rum ents was $1.7 million which consisted of unrealized losses of $2.6 million and realized gains of $0.9 million. For the three months ended March 31, 2022, the gain on derivative instruments was $4.6 million which consisted of unrealized gains of $4 .2 mi llion and realized gains of $0.4 million. 4. Amount relates to general and administrative expenses incurred for the 2023 proxy contest and related Blackwells litigation. The Company does not consider these expenses to be part of its normal operating performance and has, accordingly, increased its AFFO for this amount.
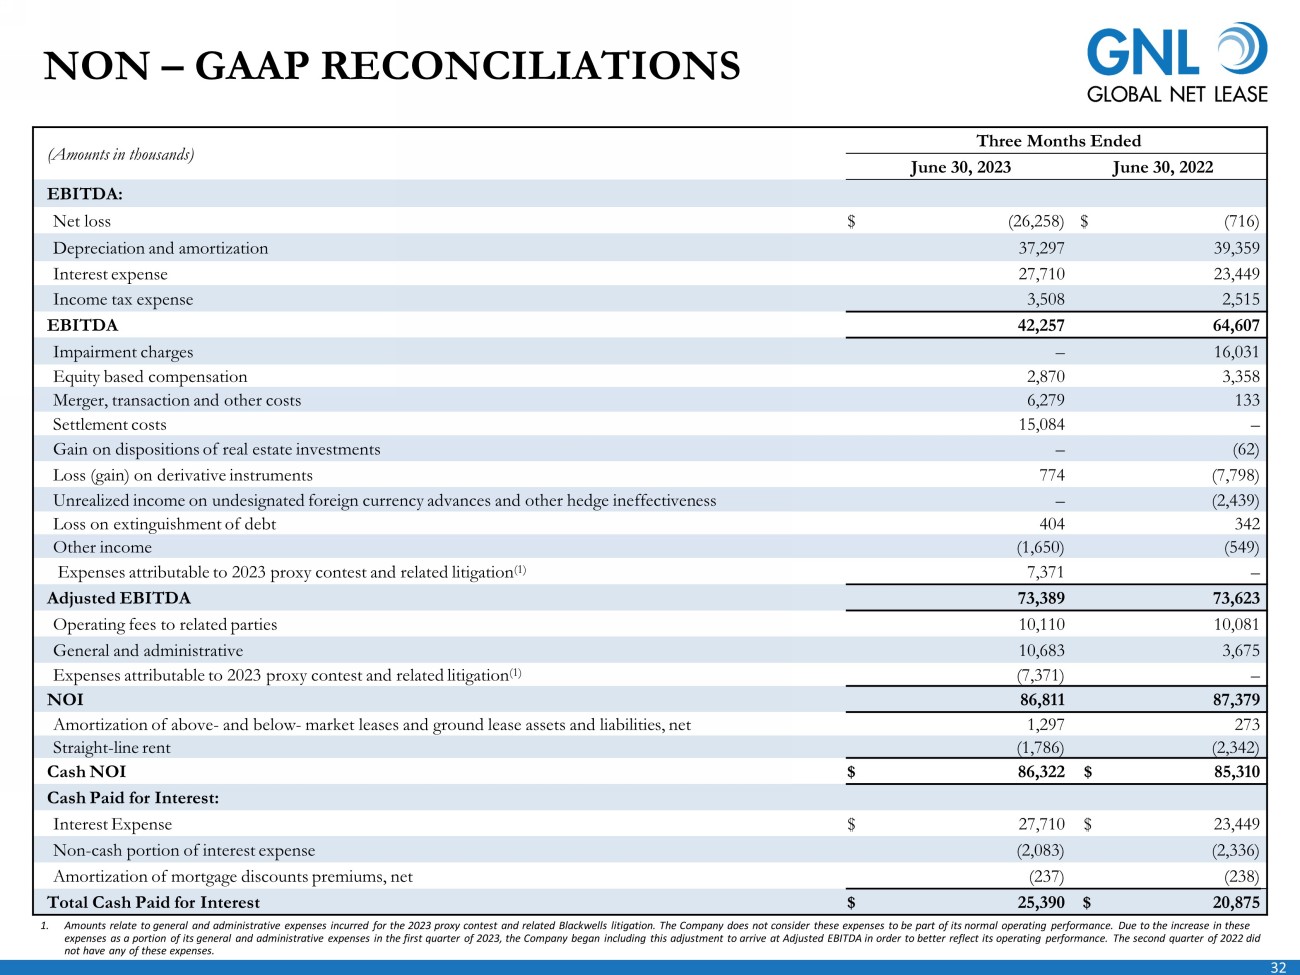
32 NON – GAAP RECONCILIATIONS (Amounts in thousands) Three Months Ended June 30, 2023 June 30, 2022 EBITDA: Net loss $ (26,258) $ (716) Depreciation and amortization 37,297 39,359 Interest expense 27,710 23,449 Income tax expense 3,508 2,515 EBITDA 42,257 64,607 Impairment charges – 16,031 Equity based compensation 2,870 3,358 Merger, transaction and other costs 6,279 133 Settlement costs 15,084 – Gain on dispositions of real estate investments – (62) Loss (gain) on derivative instruments 774 (7,798) Unrealized income on undesignated foreign currency advances and other hedge ineffectiveness – (2,439) Loss on extinguishment of debt 404 342 Other income (1,650) (549) Expenses attributable to 2023 proxy contest and related litigation (1) 7,371 – Adjusted EBITDA 73,389 73,623 Operating fees to related parties 10,110 10,081 General and administrative 10,683 3,675 Expenses attributable to 2023 proxy contest and related litigation (1) (7,371) – NOI 86,811 87,379 Amortization of above - and below - market leases and ground lease assets and liabilities, net 1,297 273 Straight - line rent (1,786) (2,342) Cash NOI $ 86,322 $ 85,310 Cash Paid for Interest: Interest Expense $ 27,710 $ 23,449 Non - cash portion of interest expense (2,083) (2,336) Amortization of mortgage discounts premiums, net (237) (238) Total Cash Paid for Interest $ 25,390 $ 20,875 1. Amounts relate to general and administrative expenses incurred for the 2023 proxy contest and related Blackwells litigation. The Company does not consider these expenses to be part of its normal operating performance. Due to the increase in these expenses as a portion of its general and administrative expenses in the first quarter of 2023, the Company began including this adjustment to arrive at Adjusted EBITDA in order to better reflect its oper ati ng performance. The second quarter of 2022 did not have any of these expenses.
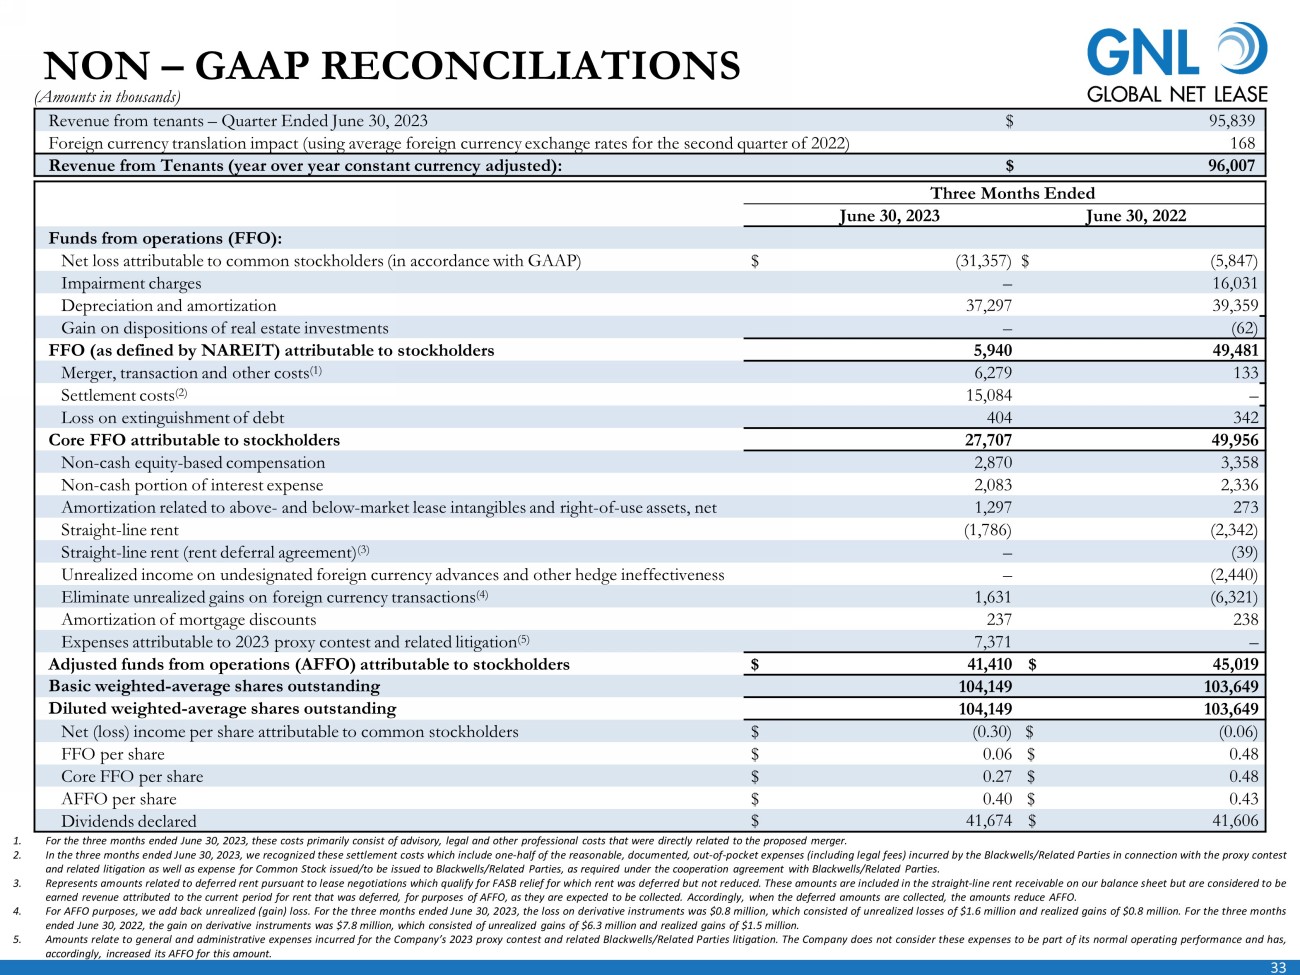
33 NON – GAAP RECONCILIATIONS Revenue from tenants – Quarter Ended June 30, 2023 $ 95,839 _ Foreign currency translation impact (using average foreign currency exchange rates for the second quarter of 2022) 168 _ Revenue from Tenants (year over year constant currency adjusted): $ 96,007 _ (Amounts in thousands) Three Months Ended June 30, 2023 June 30, 2022 Funds from operations (FFO): Net loss attributable to common stockholders (in accordance with GAAP) $ (31,357) $ (5,847) Impairment charges – 16,031 Depreciation and amortization 37,297 39,359 Gain on dispositions of real estate investments – (62) FFO (as defined by NAREIT) attributable to stockholders 5,940 49,481 Merger, transaction and other costs (1) 6,279 133 Settlement costs (2) 15,084 – Loss on extinguishment of debt 404 342 Core FFO attributable to stockholders 27,707 49,956 Non - cash equity - based compensation 2,870 3,358 Non - cash portion of interest expense 2,083 2,336 Amortization related to above - and below - market lease intangibles and right - of - use assets, net 1,297 273 Straight - line rent (1,786) (2,342) Straight - line rent (rent deferral agreement) (3) – (39) Unrealized income on undesignated foreign currency advances and other hedge ineffectiveness – (2,440) Eliminate unrealized gains on foreign currency transactions (4) 1,631 (6,321) Amortization of mortgage discounts 237 238 Expenses attributable to 2023 proxy contest and related litigation (5) 7,371 – Adjusted funds from operations (AFFO) attributable to stockholders $ 41,410 $ 45,019 Basic weighted - average shares outstanding 104,149 103,649 Diluted weighted - average shares outstanding 104,149 103,649 Net (loss) income per share attributable to common stockholders $ (0.30) $ (0.06) FFO per share $ 0.06 $ 0.48 Core FFO per share $ 0.27 $ 0.48 AFFO per share $ 0.40 $ 0.43 Dividends declared $ 41,674 $ 41,606 1. For the three months ended June 30 , 2023 , these costs primarily consist of advisory, legal and other professional costs that were directly related to the proposed merger . 2. In the three months ended June 30 , 2023 , we recognized these settlement costs which include one - half of the reasonable, documented, out - of - pocket expenses (including legal fees) incurred by the Blackwells/Related Parties in connection with the proxy contest and related litigation as well as expense for Common Stock issued/to be issued to Blackwells/Related Parties, as required under the cooperation agreement with Blackwells/Related Parties . 3. Represents amounts related to deferred rent pursuant to lease negotiations which qualify for FASB relief for which rent was deferred but not reduced . These amounts are included in the straight - line rent receivable on our balance sheet but are considered to be earned revenue attributed to the current period for rent that was deferred, for purposes of AFFO, as they are expected to be collected . Accordingly, when the deferred amounts are collected, the amounts reduce AFFO . 4. For AFFO purposes, we add back unrealized (gain) loss . For the three months ended June 30 , 2023 , the loss on derivative instruments was $ 0 . 8 million, which consisted of unrealized losses of $ 1 . 6 million and realized gains of $ 0 . 8 million . For the three months ended June 30 , 2022 , the gain on derivative instruments was $ 7 . 8 million, which consisted of unrealized gains of $ 6 . 3 million and realized gains of $ 1 . 5 million . 5. Amounts relate to general and administrative expenses incurred for the Company’s 2023 proxy contest and related Blackwells/Related Parties litigation . The Company does not consider these expenses to be part of its normal operating performance and has, accordingly, increased its AFFO for this amount .
Global Net Lease (NYSE:GNL-B)
Historical Stock Chart
Von Apr 2024 bis Mai 2024

Global Net Lease (NYSE:GNL-B)
Historical Stock Chart
Von Mai 2023 bis Mai 2024
