Form 8-K - Current report
06 Mai 2024 - 1:34PM
Edgar (US Regulatory)
0001298675false8-K2024-05-065 Old Lancaster RoadMalvernPA19355610535-5000falsefalsefalsefalse0001300485false0001298675cube:CubesmartL.p.Member2024-05-062024-05-0600012986752024-05-062024-05-06
UNITED STATES
SECURITIES AND EXCHANGE COMMISSION
WASHINGTON, DC 20549
FORM 8-K
CURRENT REPORT PURSUANT TO
SECTION 13 OR 15(d) OF THE
SECURITIES EXCHANGE ACT OF 1934
Date of report (Date of earliest event reported): May 6, 2024
CUBESMART
CUBESMART, L.P.
(Exact Name of Registrant as Specified in Its Charter)
Maryland (CubeSmart) | 001-32324 | 20-1024732 |
Delaware (CubeSmart, L.P.) | 000-54462 | 34-1837021 |
(State or Other Jurisdiction of Incorporation) | (Commission File Number) | (IRS Employer Identification No.) |
|
5 Old Lancaster Road |
Malvern, |
Pennsylvania |
19355 |
(Address of Principal |
Executive Offices) |
(610) 535-5000
(Registrant’s telephone number, including area code)
Not applicable
(Former Name or Former Address, if Changed Since Last Report)
Securities registered pursuant to Section 12(b) of the Act:
Title of Each Class | | Trading Symbol(s) | | Name of Each Exchange on Which Registered |
Common Shares, $0.01 par value per share, of CubeSmart | | CUBE | | New York Stock Exchange |
Check the appropriate box below if the Form 8-K filing is intended to simultaneously satisfy the filing obligation of the registrant under any of the following provisions (see General Instruction A.2. below):
☐ | Written communications pursuant to Rule 425 under the Securities Act (17 CFR 230.425) |
☐ | Soliciting material pursuant to Rule 14a-12 under the Exchange Act (17 CFR 240.14a-12) |
☐ | Pre-commencement communications pursuant to Rule 14d-2(b) under the Exchange Act (17 CFR 240.14d-2(b)) |
☐ | Pre-commencement communications pursuant to Rule 13e-4(c) under the Exchange Act (17 CFR 240.13e-4(c)) |
Indicate by check mark whether the registrant is an emerging growth company as defined in Rule 405 of the Securities Act of 1933 (17 CFR 230.405) or Rule 12b-2 of the Securities Exchange Act of 1934 (17 CFR 240.12b-2).
Emerging Growth Company (CubeSmart) ☐
Emerging Growth Company (CubeSmart, L.P.) ☐
If an emerging growth company, indicate by check mark if the registrant has elected not to use the extended transition period for complying with any new or revised financial accounting standards provided pursuant to Section 13(a) of the Exchange Act.
CubeSmart ☐
CubeSmart, L.P. ☐
Item 2.02 Results of Operations and Financial Condition.
We are furnishing with this report a slide presentation (attached as Exhibit 99.1) that may be used in presentations to investors from time to time.
Item 7.01 Regulation FD Disclosure.
The information disclosed in Item 2.02 above is incorporated into this Item 7.01.
The information included in this Current Report on Form 8-K (including the exhibit hereto) is being furnished under Item 2.02, “Results of Operations and Financial Condition,” Item 7.01, “Regulation FD Disclosure” and Item 9.01 “Financial Statements and Exhibits” of Form 8-K. As such, the information (including the exhibit) herein shall not be deemed to be “filed” for the purposes of Section 18 of the Securities Exchange Act of 1934, as amended (the “Exchange Act”), or otherwise subject to the liabilities of that Section, nor shall it be incorporated by reference into a filing under the Securities Act of 1933, as amended, or the Exchange Act, regardless of any general incorporation language in such filing, except as shall be expressly set forth by specific reference in such a filing. This Current Report (including the exhibit hereto) will not be deemed an admission as to the materiality of any information required to be disclosed solely to satisfy the requirements of Regulation FD.
Item 9.01 Financial Statements and Exhibits.
(a) Not applicable.
(b) Not applicable.
(c) Not applicable.
(d) Exhibits.
Exhibit No. | | Description |
99.1 | | Slide Presentation Dated May 2024 |
104 | | Cover Page Interactive Data File – the cover page interactive data file does not appear in the Interactive Data File because its XBRL tags are embedded within the Inline XBRL document. |
SIGNATURES
Pursuant to the requirements of the Securities Exchange Act of 1934, the Registrant has duly caused this report to be signed on its behalf by the undersigned hereunto duly authorized.
| CUBESMART |
| |
| By: | /s/ Jeffrey P. Foster |
| Name: | Jeffrey P. Foster |
| Title: | Chief Legal Officer and Secretary |
Date: May 6, 2024 | |
| |
| CUBESMART, L.P. |
| |
| By CUBESMART, its general partner |
| |
| By: | /s/ Jeffrey P. Foster |
| Name: | Jeffrey P. Foster |
| Title: | Chief Legal Officer and Secretary |
| | |
Date: May 6, 2024 | | |
Exhibit 99.1
| New York
City Portfolio
Presentation
May 2024 |
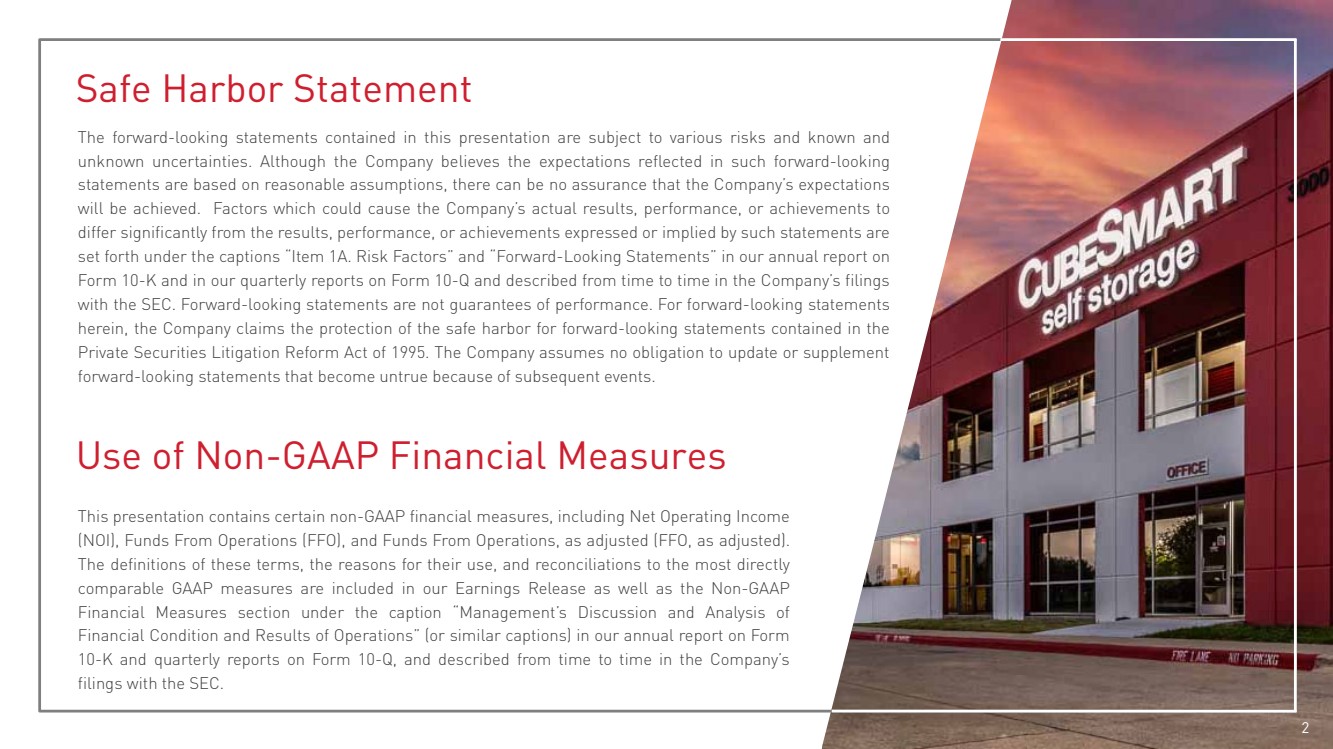
| Safe Harbor Statement
The forward-looking statements contained in this presentation are subject to various risks and known and
unknown uncertainties. Although the Company believes the expectations reflected in such forward-looking
statements are based on reasonable assumptions, there can be no assurance that the Company’s expectations
will be achieved. Factors which could cause the Company’s actual results, performance, or achievements to
differ significantly from the results, performance, or achievements expressed or implied by such statements are
set forth under the captions “Item 1A. Risk Factors” and “Forward-Looking Statements” in our annual report on
Form 10-K and in our quarterly reports on Form 10-Q and described from time to time in the Company’s filings
with the SEC. Forward-looking statements are not guarantees of performance. For forward-looking statements
herein, the Company claims the protection of the safe harbor for forward-looking statements contained in the
Private Securities Litigation Reform Act of 1995. The Company assumes no obligation to update or supplement
forward-looking statements that become untrue because of subsequent events.
This presentation contains certain non-GAAP financial measures, including Net Operating Income
(NOI), Funds From Operations (FFO), and Funds From Operations, as adjusted (FFO, as adjusted).
The definitions of these terms, the reasons for their use, and reconciliations to the most directly
comparable GAAP measures are included in our Earnings Release as well as the Non-GAAP
Financial Measures section under the caption “Management’s Discussion and Analysis of
Financial Condition and Results of Operations” (or similar captions) in our annual report on Form
10-K and quarterly reports on Form 10-Q, and described from time to time in the Company’s
filings with the SEC.
Use of Non-GAAP Financial Measures
2 |
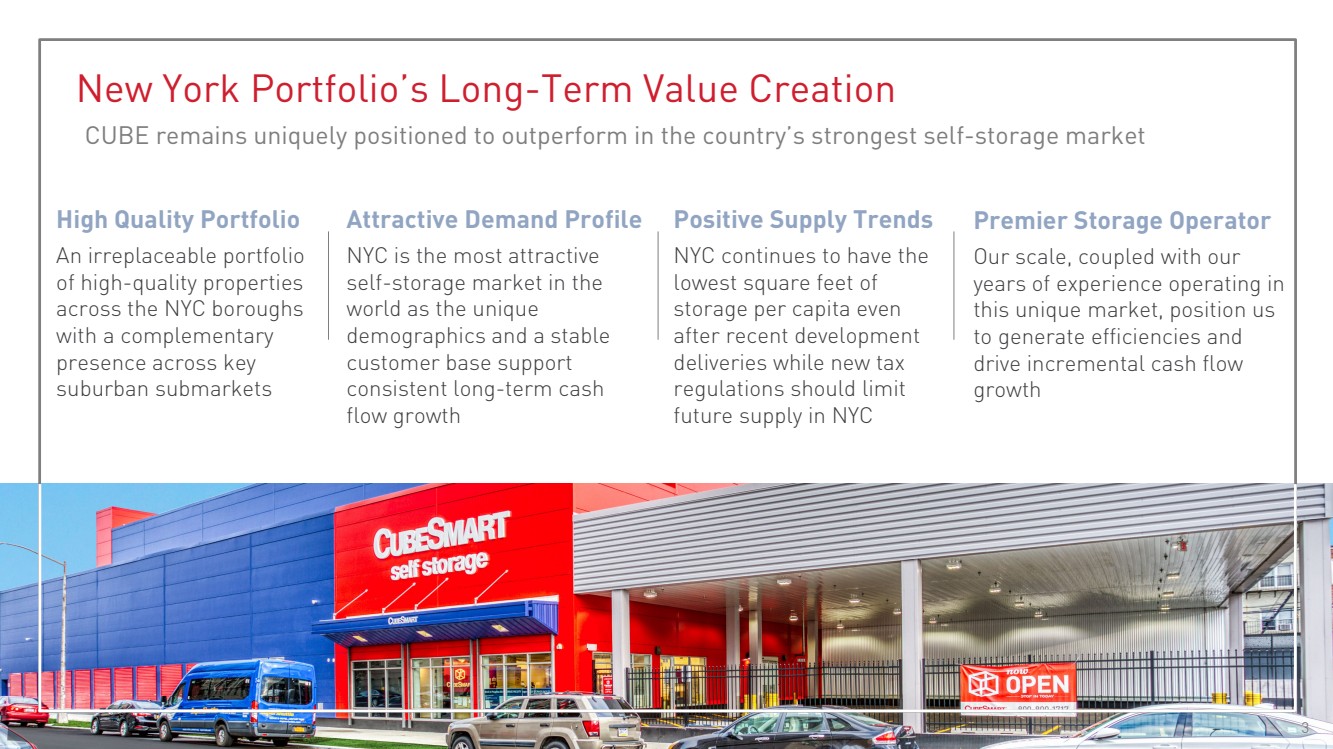
| New York Portfolio’s Long-Term Value Creation
CUBE remains uniquely positioned to outperform in the country’s strongest self-storage market
High Quality Portfolio
An irreplaceable portfolio
of high-quality properties
across the NYC boroughs
with a complementary
presence across key
suburban submarkets
Attractive Demand Profile
NYC is the most attractive
self-storage market in the
world as the unique
demographics and a stable
customer base support
consistent long-term cash
flow growth
Positive Supply Trends
NYC continues to have the
lowest square feet of
storage per capita even
after recent development
deliveries while new tax
regulations should limit
future supply in NYC
Premier Storage Operator
Our scale, coupled with our
years of experience operating in
this unique market, position us
to generate efficiencies and
drive incremental cash flow
growth
3 |
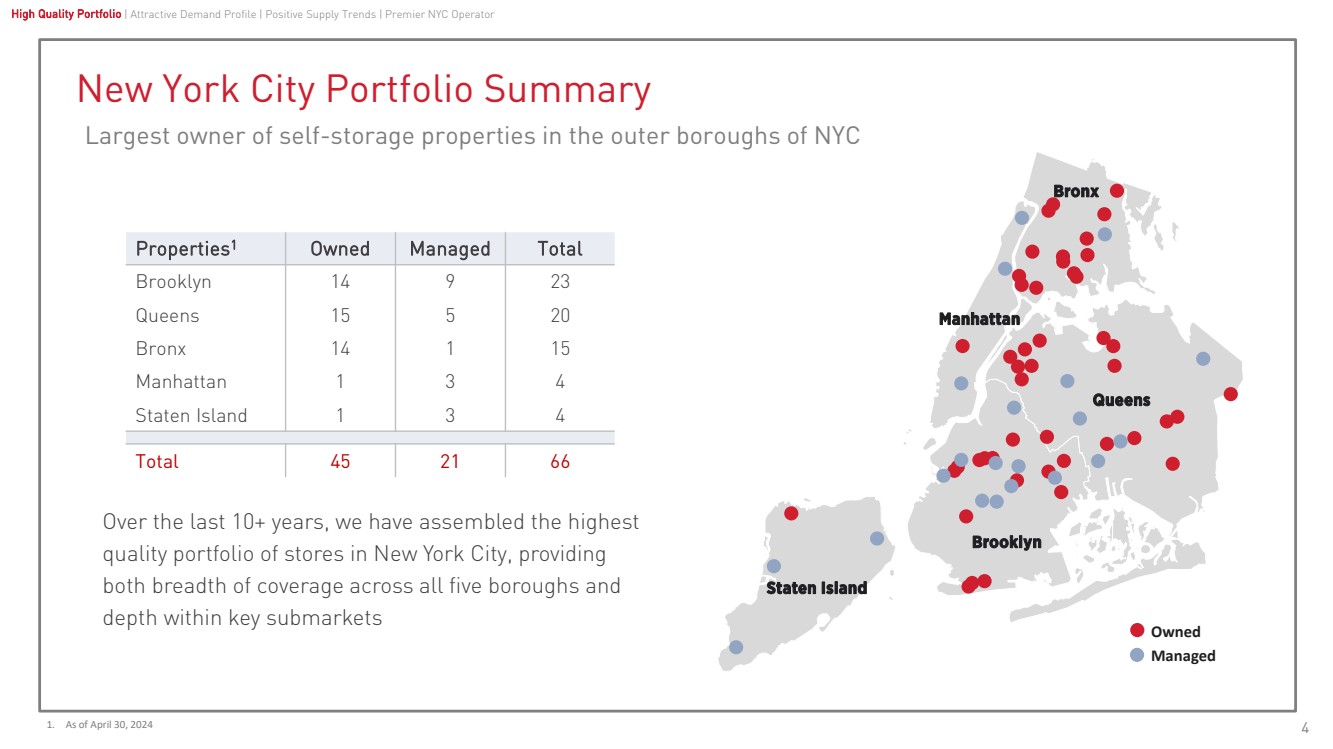
| Over the last 10+ years, we have assembled the highest
quality portfolio of stores in New York City, providing
both breadth of coverage across all five boroughs and
depth within key submarkets
New York City Portfolio Summary
1. As of April 30, 2024
4
Properties Owned Managed Total 1
Brooklyn 14
9 23
Queens 15
5 20
Bronx 14 1 15
Manhattan 1 3
4
Staten Island 1 3
4
Total 45 21 66
Largest owner of self-storage properties in the outer boroughs of NYC
High Quality Portfolio | Attractive Demand Profile | Positive Supply Trends | Premier NYC Operator
Brooklyn
Queens
Bronx
Manhattan
Staten Island
Owned
Managed |
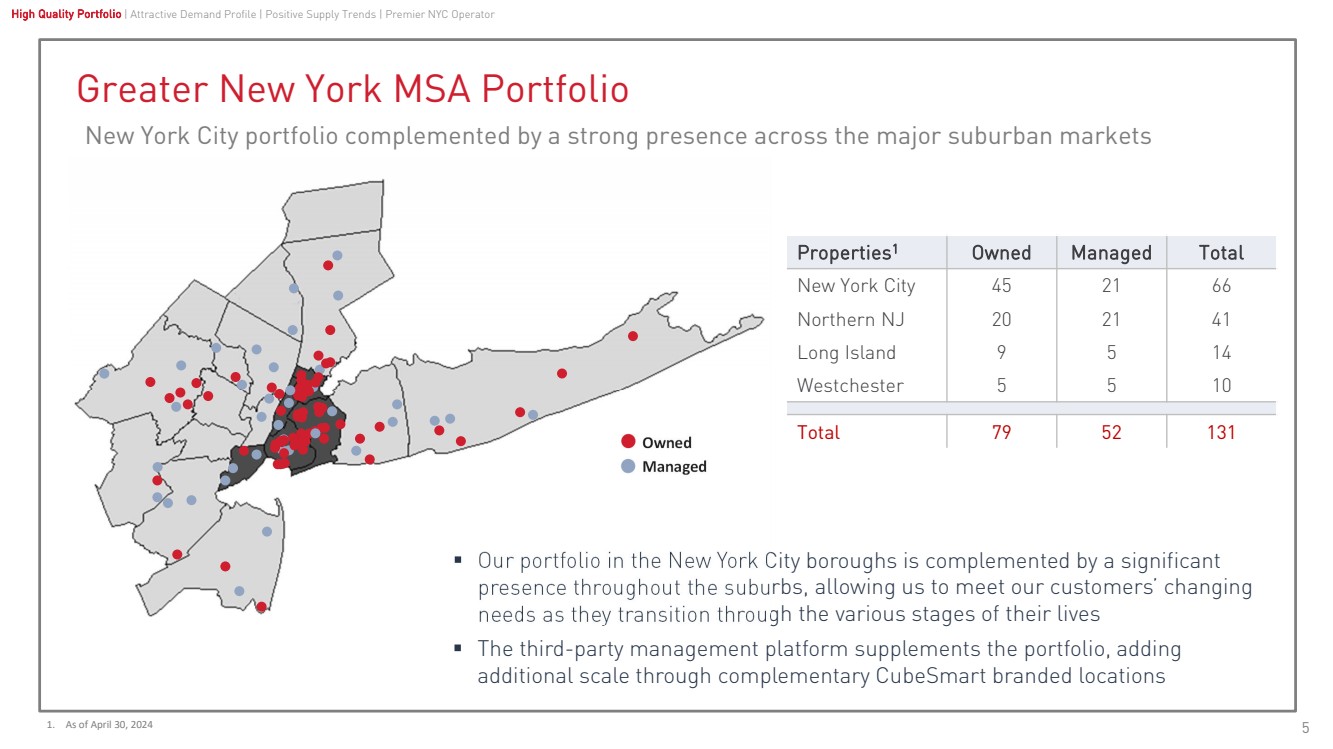
| Greater New York MSA Portfolio
1. As of April 30, 2024 5
Our portfolio in the New York City boroughs is complemented by a significant
presence throughout the suburbs, allowing us to meet our customers’ changing
needs as they transition through the various stages of their lives
The third-party management platform supplements the portfolio, adding
additional scale through complementary CubeSmart branded locations
Owned
Managed
Properties Owned Managed Total 1
New York City 45 21 66
Northern NJ 20 21 41
Long Island
9
5 14
Westchester
5
5 10
Total 79 52 131
New York City portfolio complemented by a strong presence across the major suburban markets
High Quality Portfolio | Attractive Demand Profile | Positive Supply Trends | Premier NYC Operator |
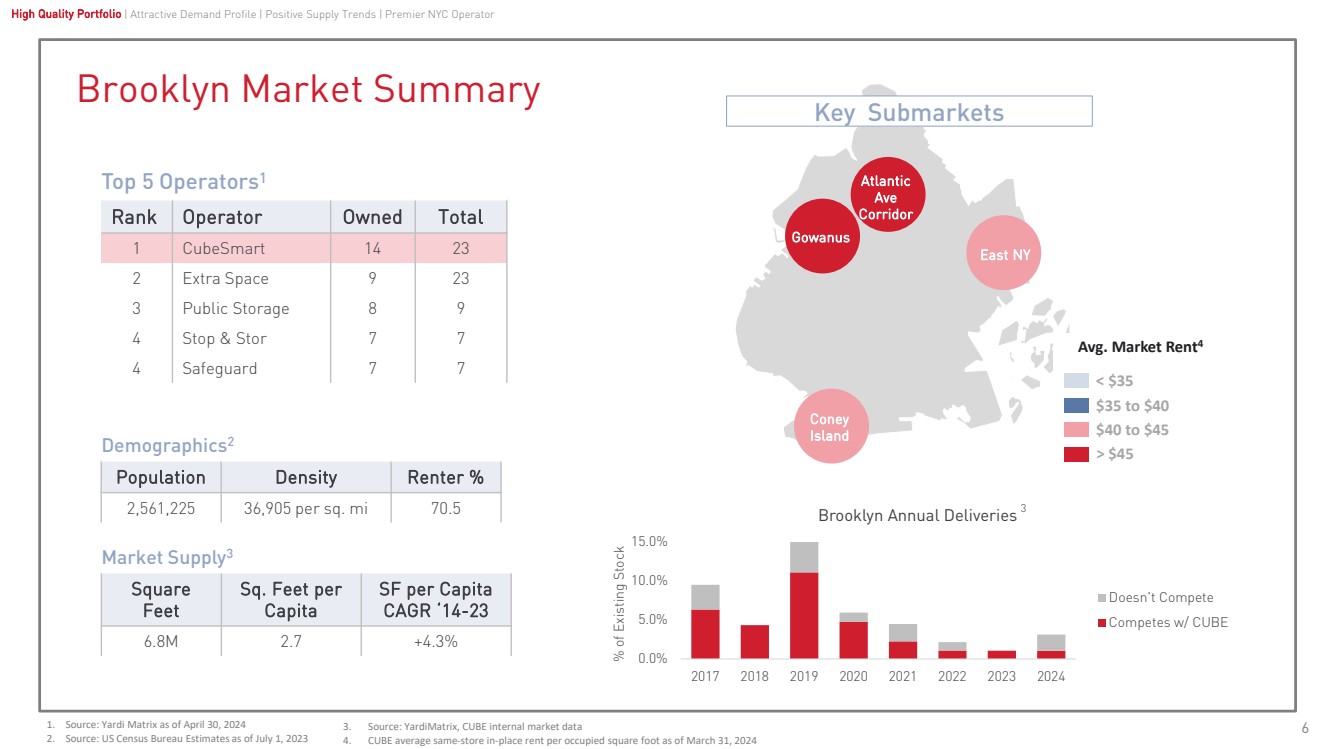
| Population Density Renter %
2,561,225 36,905 per sq. mi 70.5
0.0%
5.0%
10.0%
15.0%
2017 2018 2019 2020 2021 2022 2023 2024
% of Existing Stock
Brooklyn Annual Deliveries
Doesn't Compete
Competes w/ CUBE
Coney
Island
Gowanus
East NY
Atlantic
Ave
Corridor
Brooklyn Market Summary
6
High Quality Portfolio | Attractive Demand Profile | Positive Supply Trends | Premier NYC Operator
Rank Operator Owned Total
1 CubeSmart 14 23
2 Extra Space 9 23
3 Public Storage 8 9
4 Stop & Stor 7 7
4 Safeguard 7 7
Top 5 Operators1
< $35
$35 to $40
$40 to $45
> $45
Avg. Market Rent4
Key Submarkets
Demographics2
SF per Capita
CAGR ‘14-23
Sq. Feet per
Capita
Square
Feet
6.8M 2.7 +4.3%
Market Supply3
3
1. Source: Yardi Matrix as of April 30, 2024
2. Source: US Census Bureau Estimates as of July 1, 2023
3. Source: YardiMatrix, CUBE internal market data
4. CUBE average same-store in-place rent per occupied square foot as of March 31, 2024 |
| 0.0%
5.0%
10.0%
15.0%
2017 2018 2019 2020 2021 2022 2023 2024
% of Existing Stock
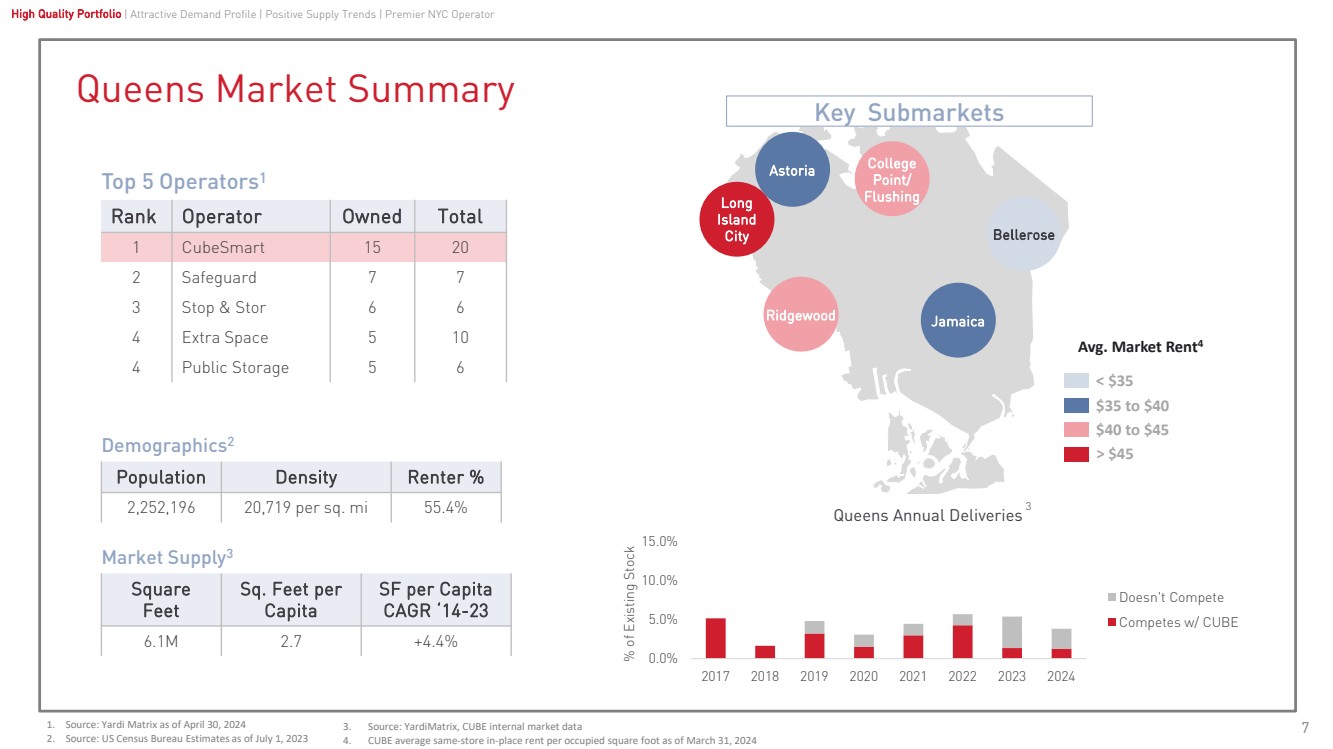
Queens Annual Deliveries
Doesn't Compete
Competes w/ CUBE
Ridgewood Jamaica
Long
Island
City
Astoria College Point/
Flushing
Bellerose
Top 5 Operators1
Rank Operator Owned Total
1 CubeSmart 15 20
2 Safeguard 7 7
3 Stop & Stor 6 6
4 Extra Space 5 10
4 Public Storage 5 6
Queens Market Summary
7
High Quality Portfolio | Attractive Demand Profile | Positive Supply Trends | Premier NYC Operator
< $35
$35 to $40
$40 to $45
> $45
Avg. Market Rent4
Population Density Renter %
2,252,196 20,719 per sq. mi 55.4%
Demographics2
SF per Capita
CAGR ‘14-23
Sq. Feet per
Capita
Square
Feet
6.1M 2.7 +4.4%
Market Supply3
3
Key Submarkets
1. Source: Yardi Matrix as of April 30, 2024
2. Source: US Census Bureau Estimates as of July 1, 2023
3. Source: YardiMatrix, CUBE internal market data
4. CUBE average same-store in-place rent per occupied square foot as of March 31, 2024 |
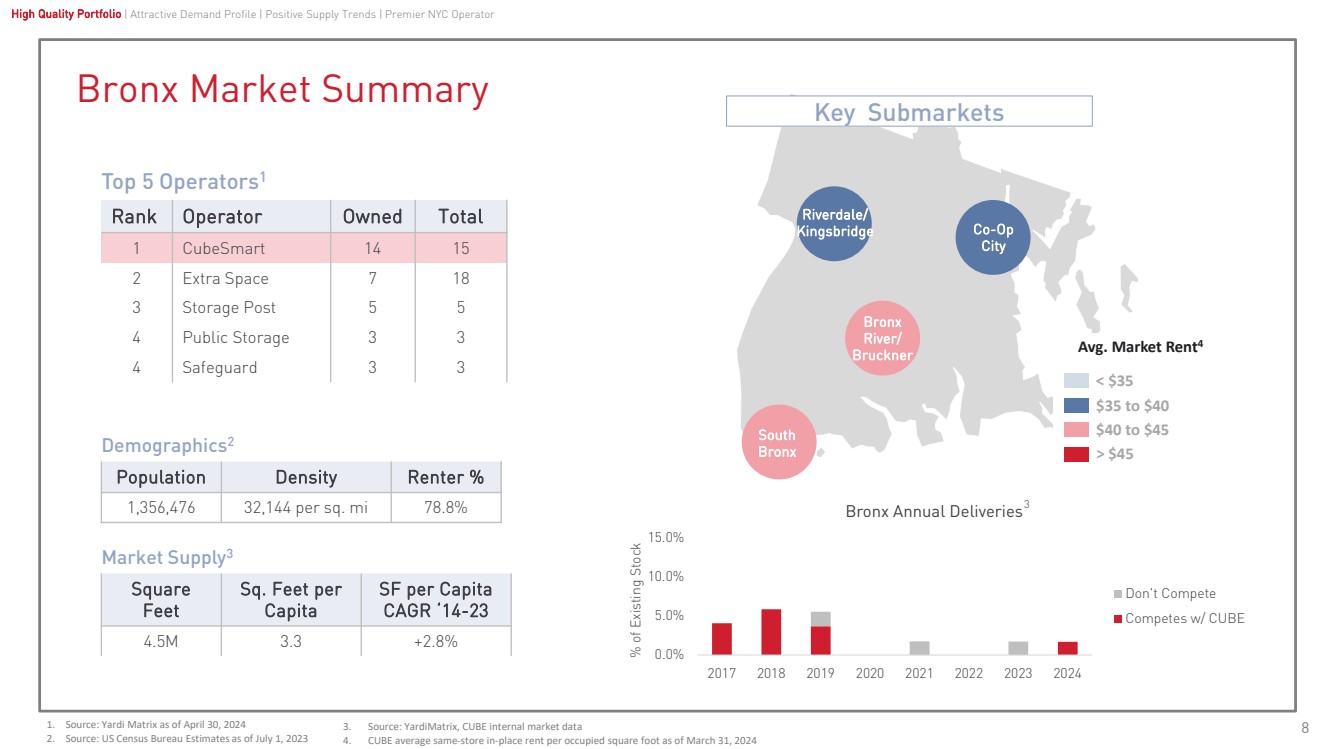
| Rank Operator Owned Total
1 CubeSmart 14 15
2 Extra Space 7 18
3 Storage Post 5 5
4 Public Storage 3 3
4 Safeguard 3 3
Top 5 Operators1
0.0%
5.0%
10.0%
15.0%
2017 2018 2019 2020 2021 2022 2023 2024
% of Existing Stock
Bronx Annual Deliveries
Don't Compete
Competes w/ CUBE
Bronx Market Summary
8
High Quality Portfolio | Attractive Demand Profile | Positive Supply Trends | Premier NYC Operator
< $35
$35 to $40
$40 to $45
> $45
Avg. Market Rent4
Population Density Renter %
1,356,476 32,144 per sq. mi 78.8%
Demographics2
SF per Capita
CAGR ‘14-23
Sq. Feet per
Capita
Square
Feet
4.5M 3.3 +2.8%
Market Supply3
3
Key Submarkets
South
Bronx
Bronx
River/
Bruckner
Riverdale/
Kingsbridge Co-Op
City
1. Source: Yardi Matrix as of April 30, 2024
2. Source: US Census Bureau Estimates as of July 1, 2023
3. Source: YardiMatrix, CUBE internal market data
4. CUBE average same-store in-place rent per occupied square foot as of March 31, 2024 |
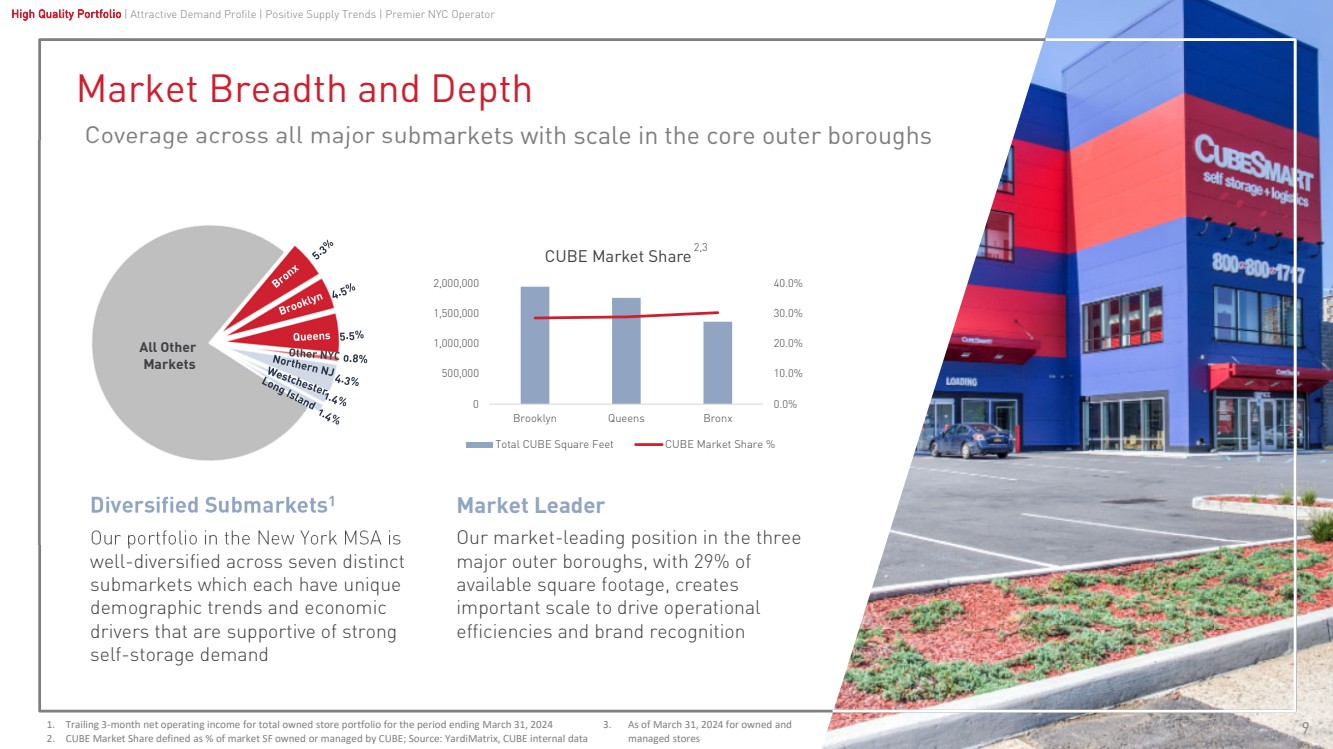
| 0.0%
10.0%
20.0%
30.0%
40.0%
0
500,000
1,000,000
1,500,000
2,000,000
Brooklyn Queens Bronx
CUBE Market Share
Total CUBE Square Feet CUBE Market Share %
9
Market Breadth and Depth
1. Trailing 3-month net operating income for total owned store portfolio for the period ending March 31, 2024
2. CUBE Market Share defined as % of market SF owned or managed by CUBE; Source: YardiMatrix, CUBE internal data
Diversified Submarkets1
Our portfolio in the New York MSA is
well-diversified across seven distinct
submarkets which each have unique
demographic trends and economic
drivers that are supportive of strong
self-storage demand
Market Leader
Our market-leading position in the three
major outer boroughs, with 29% of
available square footage, creates
important scale to drive operational
efficiencies and brand recognition
Coverage across all major submarkets with scale in the core outer boroughs
High Quality Portfolio | Attractive Demand Profile | Positive Supply Trends | Premier NYC Operator
2,3
3. As of March 31, 2024 for owned and
managed stores
All Other
Markets |

| High-Quality Assets
The largest portfolio of purpose-built Class A properties in the outer boroughs of New York City
10
High Quality Portfolio | Attractive Demand Profile | Positive Supply Trends | Premier NYC Operator |

| Irreplaceable portfolio of purpose-built stores along key thoroughfares
High-Quality Real Estate
Property stands out
with great visibility for
distinctive branding
Right off the Major
Deegan with
148,000 cars daily
Significant
multifamily
presence with
37k residents
per square
mile
CubeSmart at 2880 Exterior Street, Bronx, NY
Easily
accessible
from highway
exit
High Quality Portfolio | Attractive Demand Profile | Positive Supply Trends | Premier NYC Operator
11 |
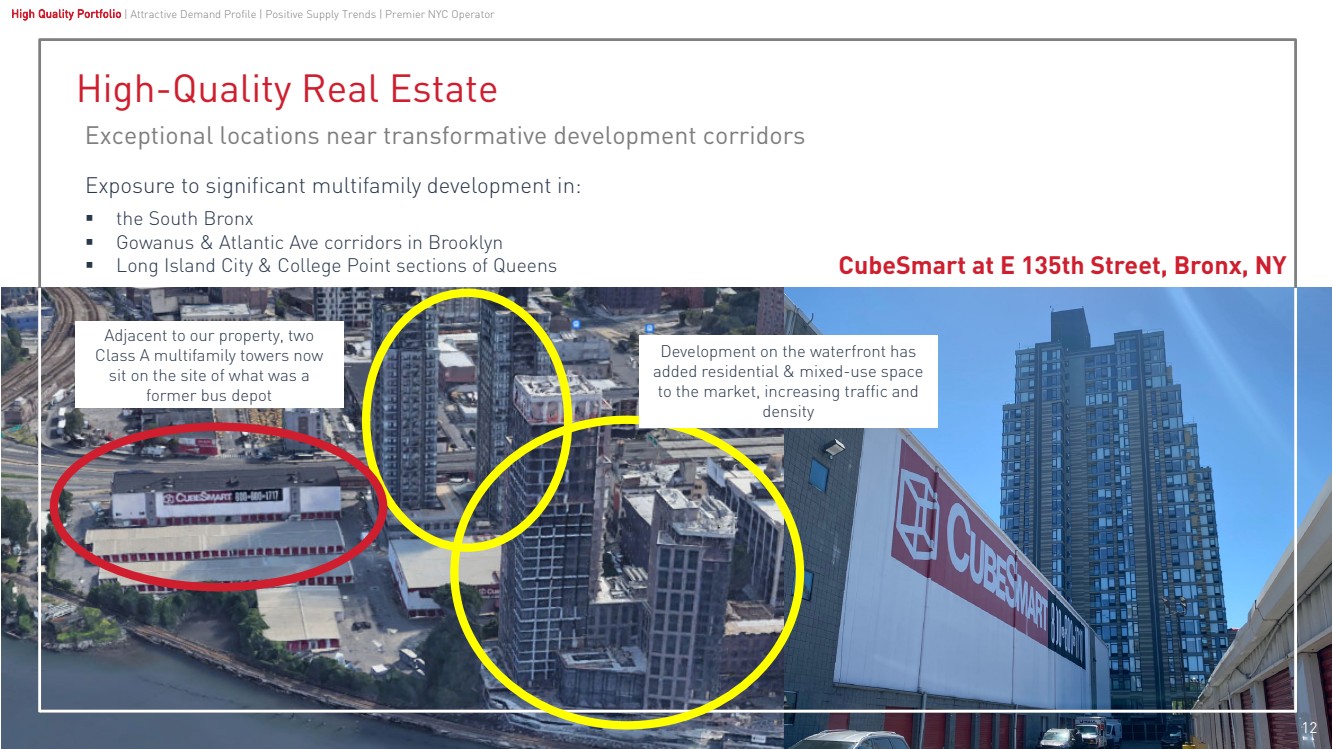
| High-Quality Real Estate
Adjacent to our property, two
Class A multifamily towers now
sit on the site of what was a
former bus depot
CubeSmart at E 135th Street, Bronx, NY
Development on the waterfront has
added residential & mixed-use space
to the market, increasing traffic and
density
Exceptional locations near transformative development corridors
Exposure to significant multifamily development in:
the South Bronx
Gowanus & Atlantic Ave corridors in Brooklyn
Long Island City & College Point sections of Queens
High Quality Portfolio | Attractive Demand Profile | Positive Supply Trends | Premier NYC Operator
12 |
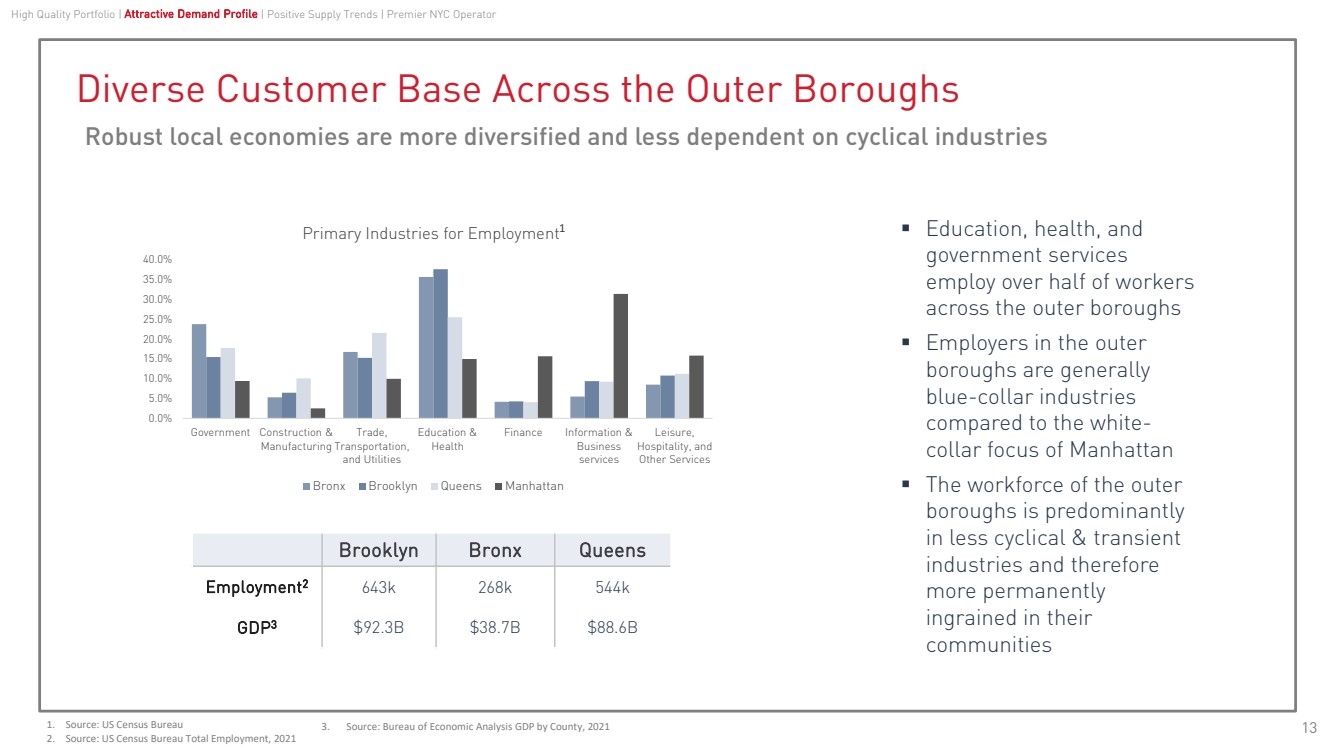
| 0.0%
5.0%
10.0%
15.0%
20.0%
25.0%
30.0%
35.0%
40.0%
Government Construction &
Manufacturing
Trade,
Transportation,
and Utilities
Education &
Health
Finance Information &
Business
services
Leisure,
Hospitality, and
Other Services
Primary Industries for Employment
Bronx Brooklyn Queens Manhattan
Diverse Customer Base Across the Outer Boroughs
13
Brooklyn Bronx Queens
Employment 643k 268k 544k 2
GDP3 $92.3B $38.7B $88.6B
1 Education, health, and
government services
employ over half of workers
across the outer boroughs
Employers in the outer
boroughs are generally
blue-collar industries
compared to the white-collar focus of Manhattan
The workforce of the outer
boroughs is predominantly
in less cyclical & transient
industries and therefore
more permanently
ingrained in their
communities
Robust local economies are more diversified and less dependent on cyclical industries
1. Source: US Census Bureau
2. Source: US Census Bureau Total Employment, 2021
High Quality Portfolio | Attractive Demand Profile | Positive Supply Trends | Premier NYC Operator
3. Source: Bureau of Economic Analysis GDP by County, 2021 |
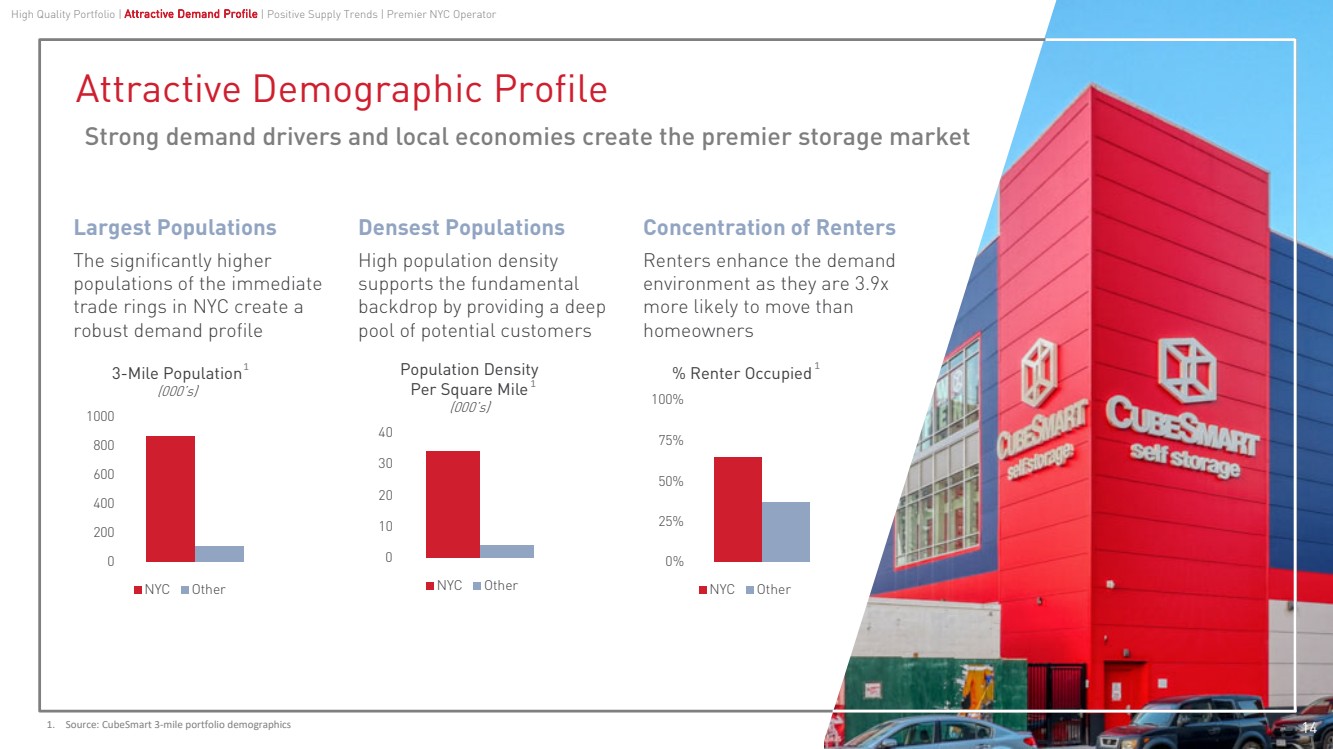
| 0
200
400
600
800
1000
3-Mile Population
(000’s)
NYC Other
0
10
20
30
40
Population Density
Per Square Mile
(000’s)
NYC Other
0%
25%
50%
75%
100%
% Renter Occupied
NYC Other
14
Strong demand drivers and local economies create the premier storage market
Attractive Demographic Profile
1 1
1
Largest Populations
The significantly higher
populations of the immediate
trade rings in NYC create a
robust demand profile
Concentration of Renters
Renters enhance the demand
environment as they are 3.9x
more likely to move than
homeowners
Densest Populations
High population density
supports the fundamental
backdrop by providing a deep
pool of potential customers
1. Source: CubeSmart 3-mile portfolio demographics
High Quality Portfolio | Attractive Demand Profile | Positive Supply Trends | Premier NYC Operator |

| Tighter customer trade rings benefit from increased density
Hyper-Localized Submarkets
24
Customer Map: Cromwell Ave, Bronx NY Customer Map: Angel Parkway, Allen TX
59%
of customers within 1 mile
15
26%
of customers within 1 mile
High Quality Portfolio | Attractive Demand Profile | Positive Supply Trends | Premier NYC Operator |
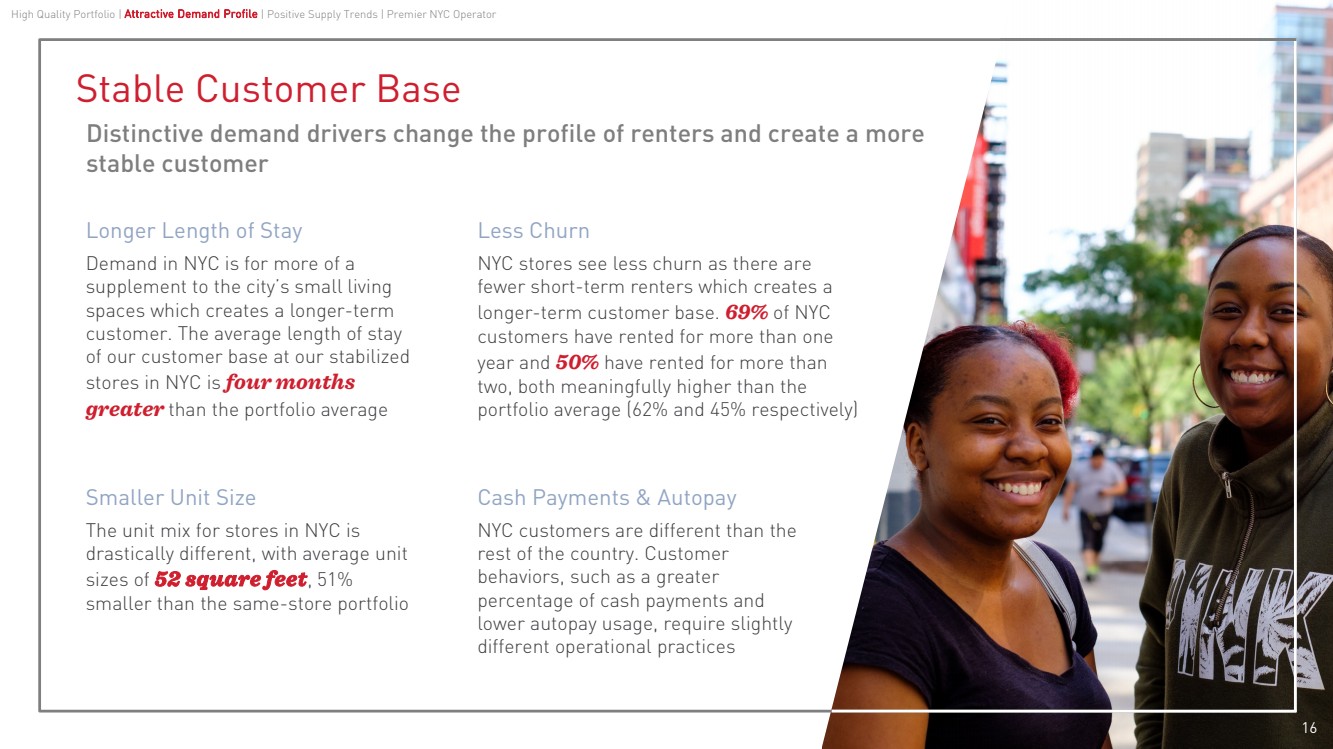
| Longer Length of Stay
Demand in NYC is for more of a
supplement to the city’s small living
spaces which creates a longer-term
customer. The average length of stay
of our customer base at our stabilized
stores in NYC is four months
greater than the portfolio average
Less Churn
NYC stores see less churn as there are
fewer short-term renters which creates a
longer-term customer base. 69% of NYC
customers have rented for more than one
year and 50% have rented for more than
two, both meaningfully higher than the
portfolio average (62% and 45% respectively)
Smaller Unit Size
The unit mix for stores in NYC is
drastically different, with average unit
sizes of 52 square feet, 51%
smaller than the same-store portfolio
Cash Payments & Autopay
NYC customers are different than the
rest of the country. Customer
behaviors, such as a greater
percentage of cash payments and
lower autopay usage, require slightly
different operational practices
16
Distinctive demand drivers change the profile of renters and create a more
stable customer
Stable Customer Base
High Quality Portfolio | Attractive Demand Profile | Positive Supply Trends | Premier NYC Operator |
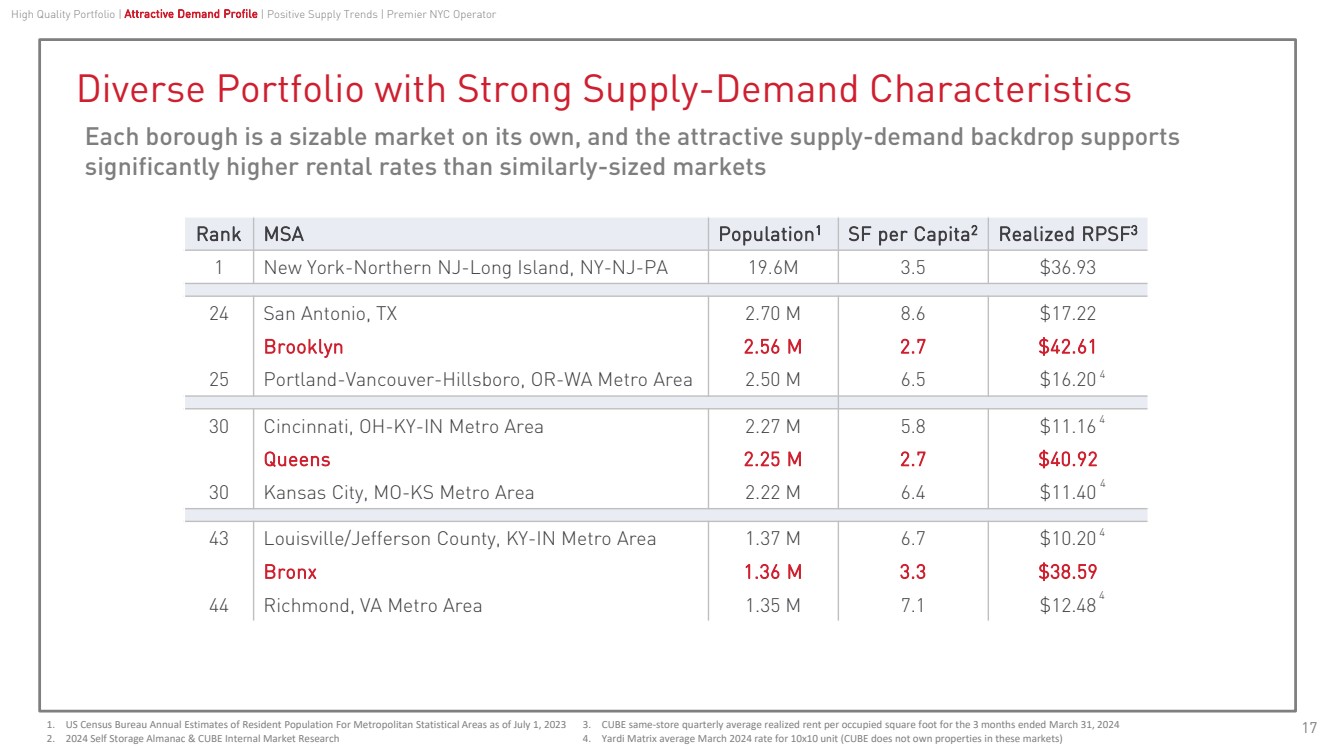
| Diverse Portfolio with Strong Supply-Demand Characteristics
Each borough is a sizable market on its own, and the attractive supply-demand backdrop supports
significantly higher rental rates than similarly-sized markets
Realized RPSF3 SF per Capita Rank MSA Population1 2
1 New York-Northern NJ-Long Island, NY-NJ-PA 19.6M 3.5 $36.93
24 San Antonio, TX 2.70 M 8.6 $17.22
Brooklyn 2.56 M 2.7 $42.61
25 Portland-Vancouver-Hillsboro, OR-WA Metro Area 2.50 M 6.5 $16.20
30 Cincinnati, OH-KY-IN Metro Area 2.27 M 5.8 $11.16
Queens 2.25 M 2.7 $40.92
30 Kansas City, MO-KS Metro Area 2.22 M 6.4 $11.40
43 Louisville/Jefferson County, KY-IN Metro Area 1.37 M 6.7 $10.20
Bronx 1.36 M 3.3 $38.59
44 Richmond, VA Metro Area 1.35 M 7.1 $12.48
1. US Census Bureau Annual Estimates of Resident Population For Metropolitan Statistical Areas as of July 1, 2023
2. 2024 Self Storage Almanac & CUBE Internal Market Research
High Quality Portfolio | Attractive Demand Profile | Positive Supply Trends | Premier NYC Operator
17 3. CUBE same-store quarterly average realized rent per occupied square foot for the 3 months ended March 31, 2024
4. Yardi Matrix average March 2024 rate for 10x10 unit (CUBE does not own properties in these markets)
4
4
4
4
4 |

| 2.8 2.9
3.4
4.7 4.9 4.9
6.0 6.4
7.0 7.1 7.2 7.3
8.1
8.8 9.0
0.0
1.0
2.0
3.0
4.0
5.0
6.0
7.0
8.0
9.0
10.0
Market Square Feet Per Capita
NYC Boroughs vs. Top 12 MSAs
24
Low Supply
Supply per capita across the
three core outer boroughs is
less than half the national
average
Recent Deliveries
New development has
increased supply per capita
over the last five years by
22%, but overall supply levels
remain very low and the
supply-demand dynamic is
still very attractive
Future Outlook
Legislative changes over the
last seven years, primarily
the restrictions on self-storage development in IBZ
industrial zones and the
exclusion from eligibility for
ICAP tax abatements, have
meaningfully increased the
barriers to entry
18
NYC remains the lowest-supplied major market across the country
Lowest-Supplied Self-Storage Markets
1. Source: 2024 Self-Storage Almanac & CUBE internal market research
High Quality Portfolio | Attractive Demand Profile | Positive Supply Trends | Premier NYC Operator
1 |
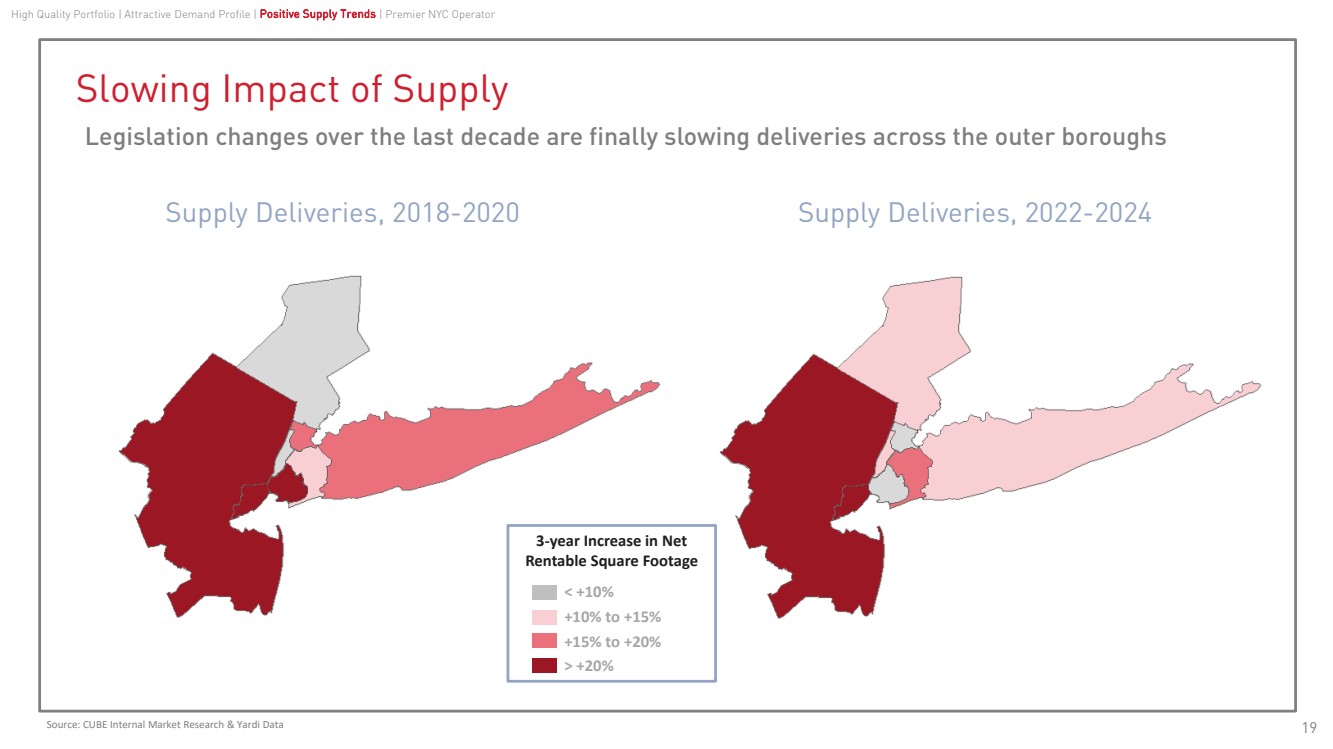
| Source: CUBE Internal Market Research & Yardi Data 19
Supply Deliveries, 2018-2020 Supply Deliveries, 2022-2024
Slowing Impact of Supply
Legislation changes over the last decade are finally slowing deliveries across the outer boroughs
< +10%
+10% to +15%
+15% to +20%
> +20%
3-year Increase in Net
Rentable Square Footage
High Quality Portfolio | Attractive Demand Profile | Positive Supply Trends | Premier NYC Operator |
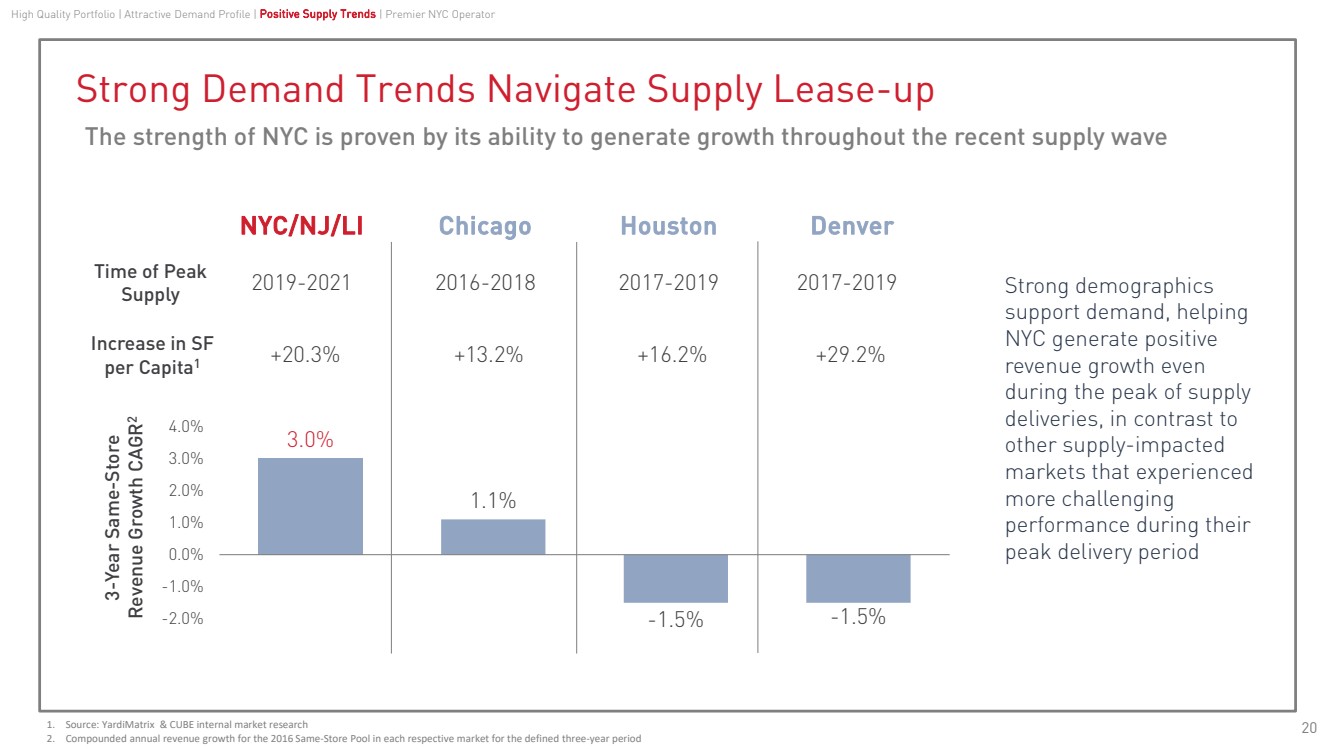
| The strength of NYC is proven by its ability to generate growth throughout the recent supply wave
Strong Demand Trends Navigate Supply Lease-up
20
Strong demographics
support demand, helping
NYC generate positive
revenue growth even
during the peak of supply
deliveries, in contrast to
other supply-impacted
markets that experienced
more challenging
performance during their
peak delivery period
High Quality Portfolio | Attractive Demand Profile | Positive Supply Trends | Premier NYC Operator
3.0%
1.1%
-2.0% -1.5% -1.5%
-1.0%
0.0%
1.0%
2.0%
3.0%
4.0%
New York/NJ/LI Chicago Houston Denver
NYC/NJ/LI Chicago Houston Denver
Time of Peak
Supply 2019-2021 2016-2018 2017-2019 2017-2019
Increase in SF
per Capita1 +20.3% +13.2% +16.2% +29.2%
3-Year Same-Store
Revenue Growth CAGR2
1. Source: YardiMatrix & CUBE internal market research
2. Compounded annual revenue growth for the 2016 Same-Store Pool in each respective market for the defined three-year period |
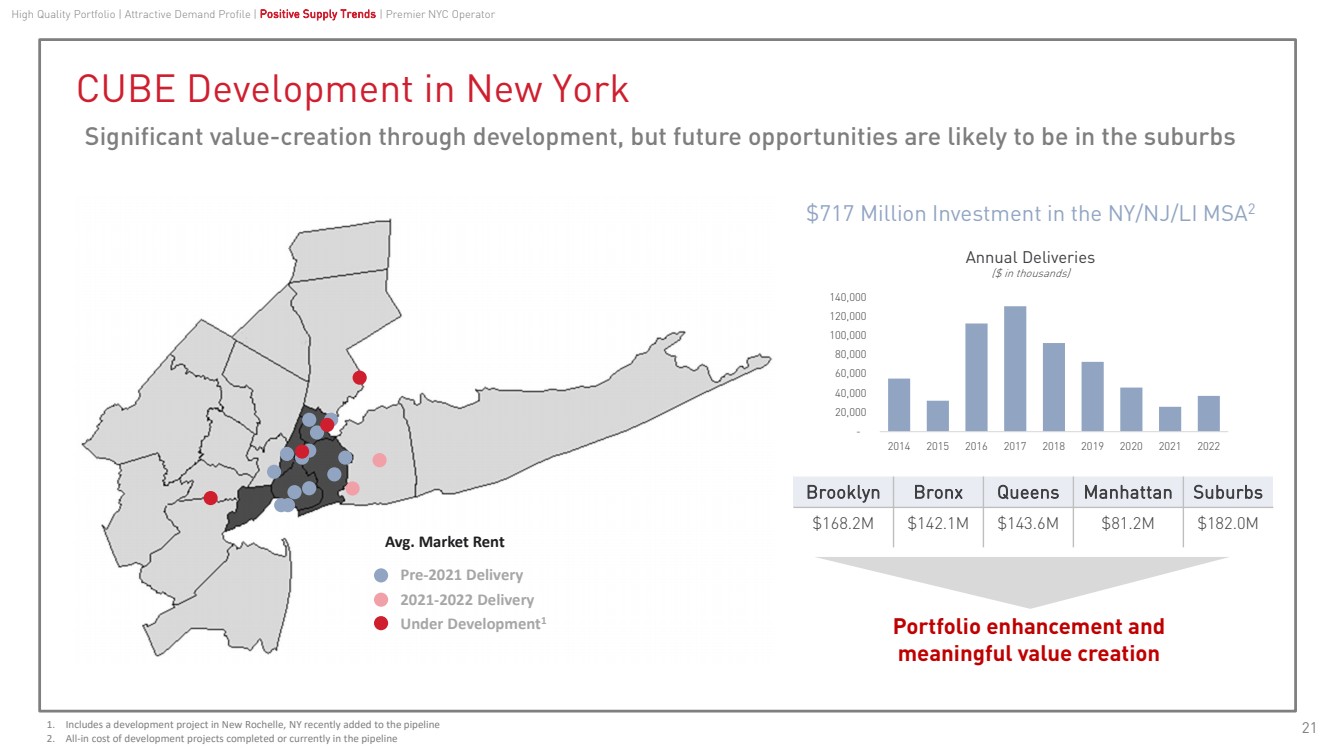
| 21
CUBE Development in New York
Significant value-creation through development, but future opportunities are likely to be in the suburbs
High Quality Portfolio | Attractive Demand Profile | Positive Supply Trends | Premier NYC Operator
Pre-2021 Delivery
2021-2022 Delivery
Under Development1
Avg. Market Rent
$717 Million Investment in the NY/NJ/LI MSA2
Portfolio enhancement and
meaningful value creation
Brooklyn Bronx Queens Manhattan Suburbs
$168.2M $142.1M $143.6M $81.2M $182.0M
1. Includes a development project in New Rochelle, NY recently added to the pipeline
2. All-in cost of development projects completed or currently in the pipeline
-
20,000
40,000
60,000
80,000
100,000
120,000
140,000
2014 2015 2016 2017 2018 2019 2020 2021 2022
Annual Deliveries
($ in thousands) |
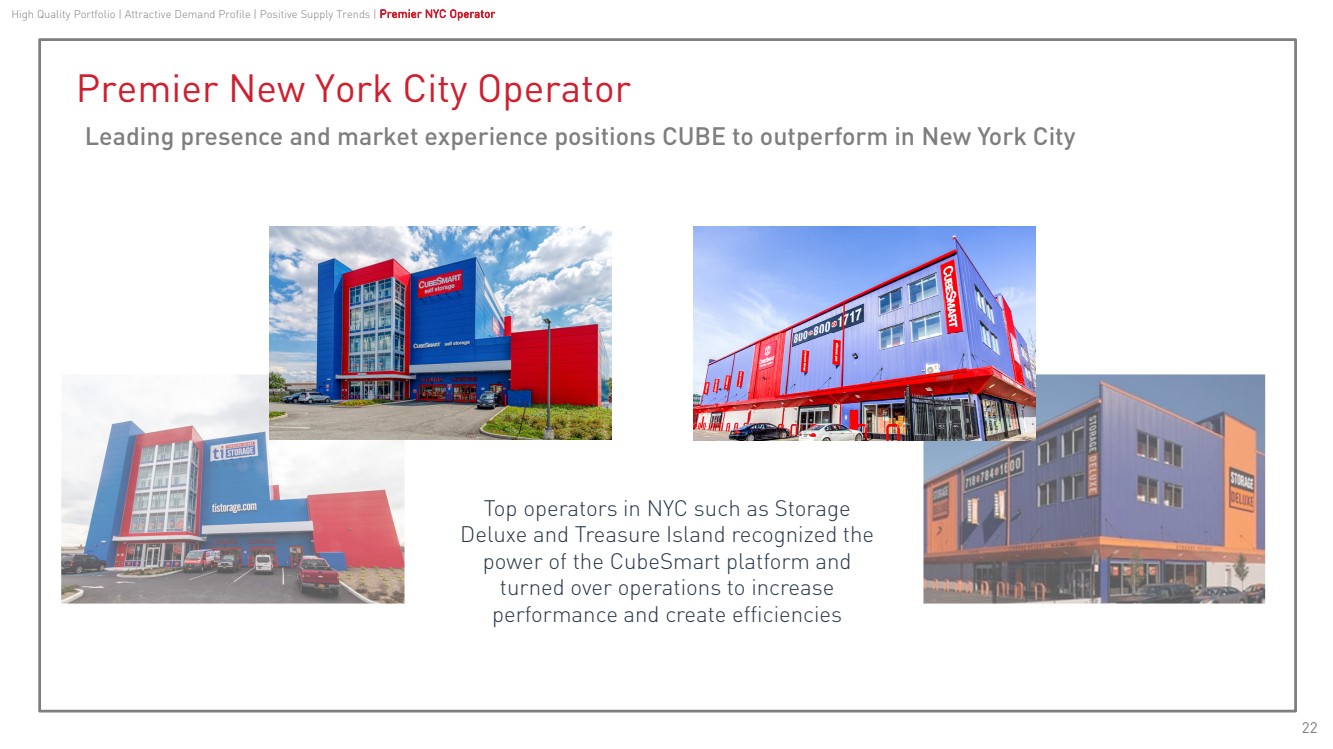
| Premier New York City Operator
22
Top operators in NYC such as Storage
Deluxe and Treasure Island recognized the
power of the CubeSmart platform and
turned over operations to increase
performance and create efficiencies
High Quality Portfolio | Attractive Demand Profile | Positive Supply Trends | Premier NYC Operator
Leading presence and market experience positions CUBE to outperform in New York City |
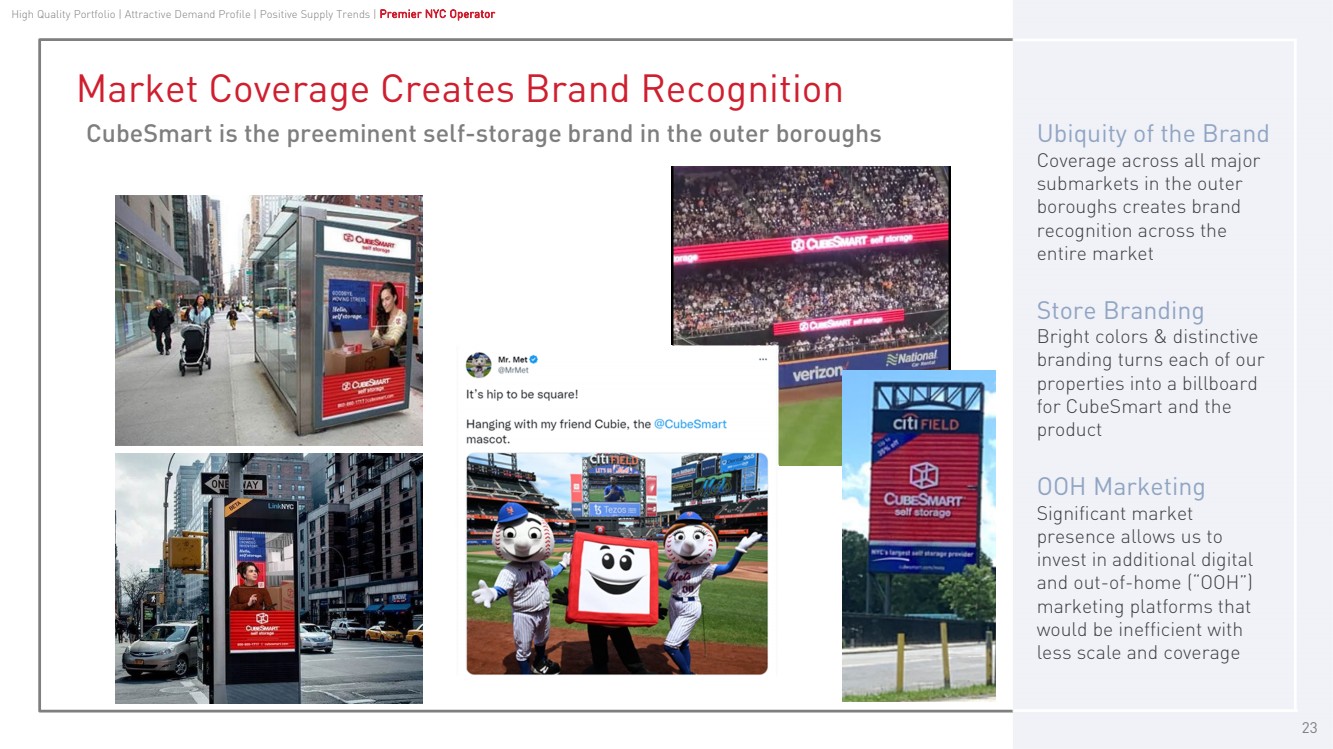
| 24
Ubiquity of the Brand
Coverage across all major
submarkets in the outer
boroughs creates brand
recognition across the
entire market
Store Branding
Bright colors & distinctive
branding turns each of our
properties into a billboard
for CubeSmart and the
product
OOH Marketing
Significant market
presence allows us to
invest in additional digital
and out-of-home (“OOH”)
marketing platforms that
would be inefficient with
less scale and coverage
23
Market Coverage Creates Brand Recognition
CubeSmart is the preeminent self-storage brand in the outer boroughs
High Quality Portfolio | Attractive Demand Profile | Positive Supply Trends | Premier NYC Operator |
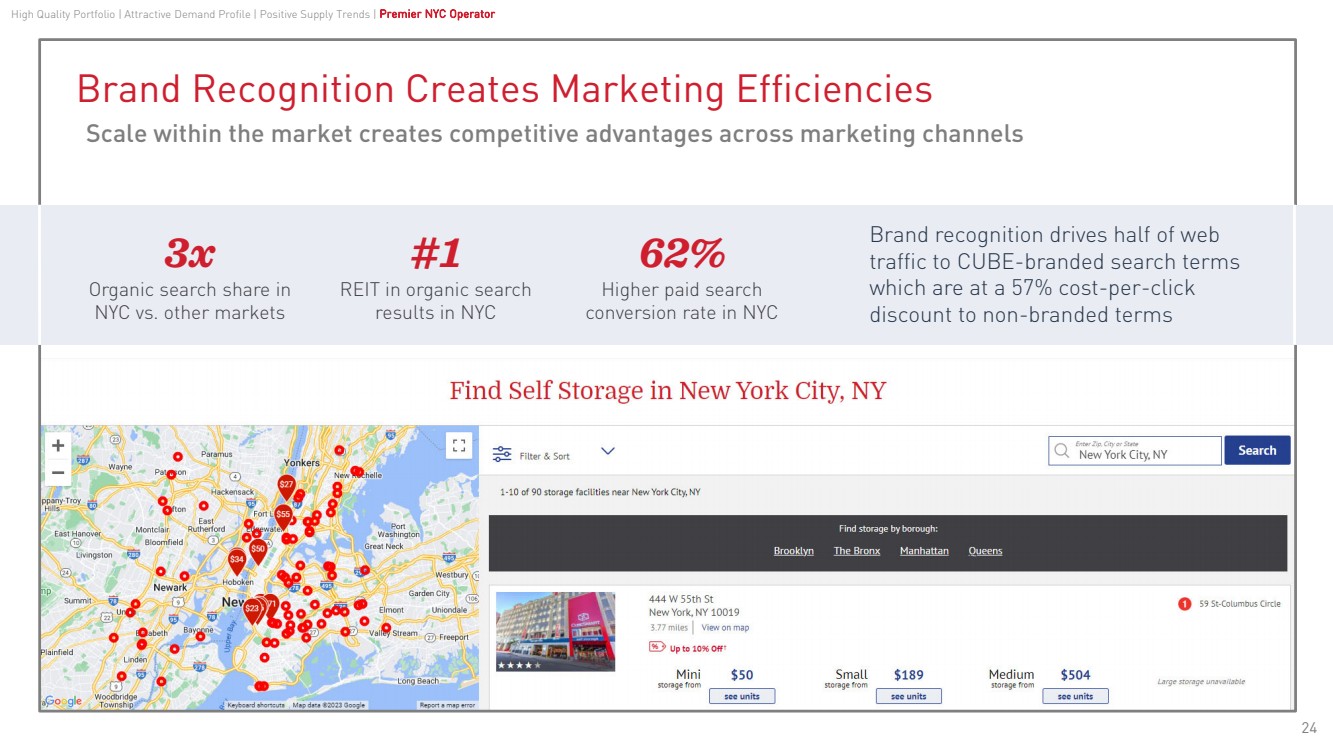
| Brand Recognition Creates Marketing Efficiencies
24
Scale within the market creates competitive advantages across marketing channels
3x
Organic search share in
NYC vs. other markets
#1
REIT in organic search
results in NYC
Brand recognition drives half of web
traffic to CUBE-branded search terms
which are at a 57% cost-per-click
discount to non-branded terms
62%
Higher paid search
conversion rate in NYC
High Quality Portfolio | Attractive Demand Profile | Positive Supply Trends | Premier NYC Operator |
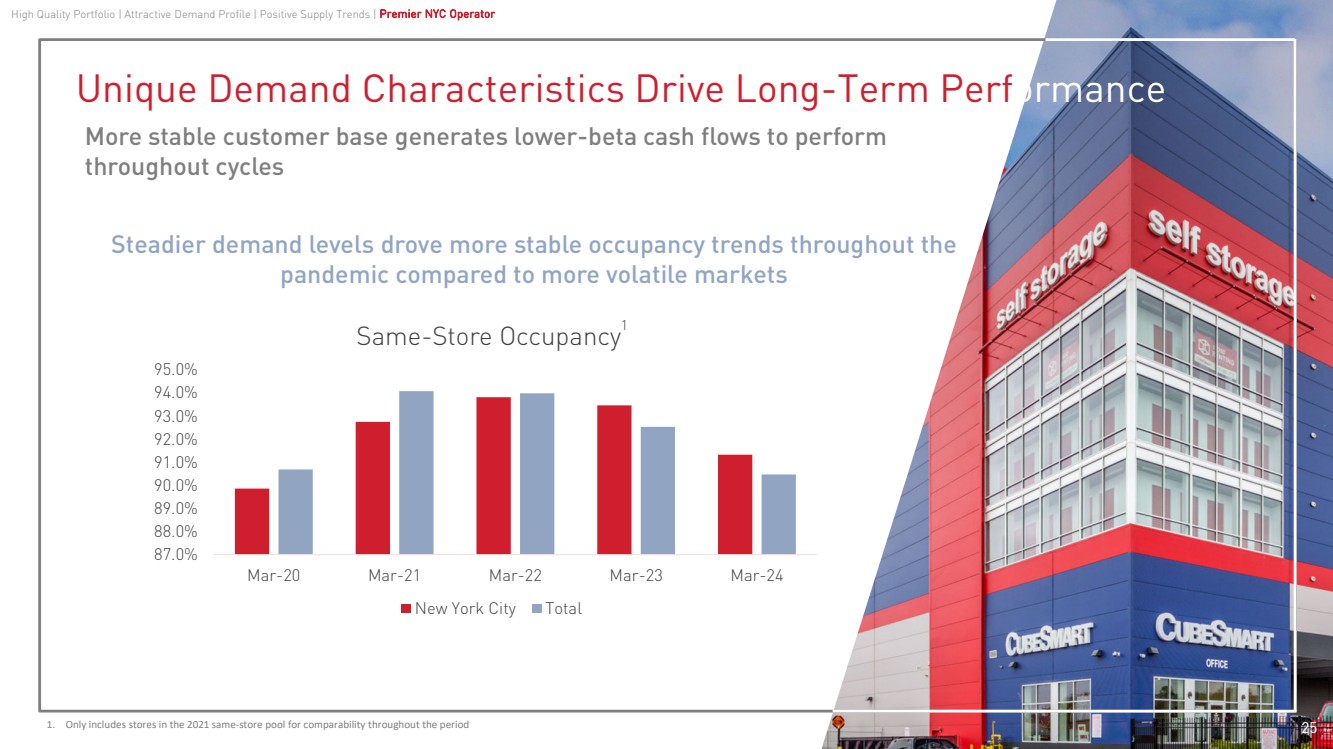
| 87.0%
88.0%
89.0%
90.0%
91.0%
92.0%
93.0%
94.0%
95.0%
Mar-20 Mar-21 Mar-22 Mar-23 Mar-24
Same-Store Occupancy
New York City Total
More stable customer base generates lower-beta cash flows to perform
throughout cycles
Unique Demand Characteristics Drive Long-Term Performance
24
Steadier demand levels drove more stable occupancy trends throughout the
pandemic compared to more volatile markets
25
High Quality Portfolio | Attractive Demand Profile | Positive Supply Trends | Premier NYC Operator
1. Only includes stores in the 2021 same-store pool for comparability throughout the period
1 |
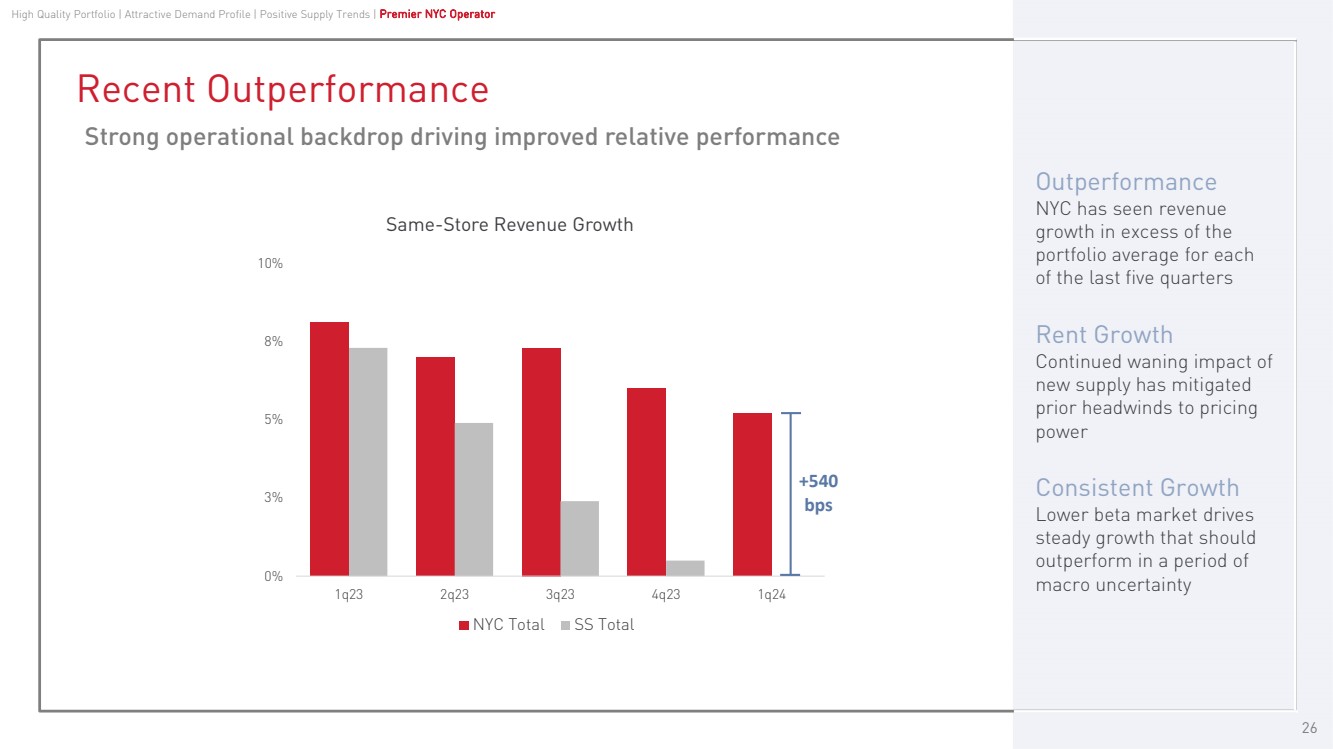
| Recent Outperformance
26
High Quality Portfolio | Attractive Demand Profile | Positive Supply Trends | Premier NYC Operator
Strong operational backdrop driving improved relative performance
Outperformance
NYC has seen revenue
growth in excess of the
portfolio average for each
of the last five quarters
Rent Growth
Continued waning impact of
new supply has mitigated
prior headwinds to pricing
power
Consistent Growth
Lower beta market drives
steady growth that should
outperform in a period of
macro uncertainty 0%
3%
5%
8%
10%
1q23 2q23 3q23 4q23 1q24
NYC Total SS Total
Same-Store Revenue Growth
+540
bps |
Document and Entity Information
|
May 06, 2024 |
| Document Type |
8-K
|
| Document Period End Date |
May 06, 2024
|
| Entity File Number |
001-32324
|
| Entity Registrant Name |
CUBESMART
|
| Entity Incorporation, State or Country Code |
MD
|
| Entity Tax Identification Number |
20-1024732
|
| Entity Address, Address Line One |
5 Old Lancaster Road
|
| Entity Address, City or Town |
Malvern
|
| Entity Address, State or Province |
PA
|
| Entity Address, Postal Zip Code |
19355
|
| City Area Code |
610
|
| Local Phone Number |
535-5000
|
| Title of 12(b) Security |
Common Shares, $0.01 par value per share, of CubeSmart
|
| Trading Symbol |
CUBE
|
| Security Exchange Name |
NYSE
|
| Written Communications |
false
|
| Soliciting Material |
false
|
| Pre-commencement Tender Offer |
false
|
| Pre-commencement Issuer Tender Offer |
false
|
| Entity Emerging Growth Company |
false
|
| Entity Central Index Key |
0001298675
|
| Amendment Flag |
false
|
| CUBESMART L.P. |
|
| Document Type |
8-K
|
| Document Period End Date |
May 06, 2024
|
| Entity File Number |
000-54462
|
| Entity Registrant Name |
CUBESMART, L.P.
|
| Entity Incorporation, State or Country Code |
DE
|
| Entity Tax Identification Number |
34-1837021
|
| Entity Address, Address Line One |
5 Old Lancaster Road
|
| Entity Address, City or Town |
Malvern
|
| Entity Address, State or Province |
PA
|
| Entity Address, Postal Zip Code |
19355
|
| City Area Code |
610
|
| Local Phone Number |
535-5000
|
| Written Communications |
false
|
| Soliciting Material |
false
|
| Pre-commencement Tender Offer |
false
|
| Pre-commencement Issuer Tender Offer |
false
|
| Entity Emerging Growth Company |
false
|
| Entity Central Index Key |
0001300485
|
| Amendment Flag |
false
|
| X |
- DefinitionBoolean flag that is true when the XBRL content amends previously-filed or accepted submission.
| Name: |
dei_AmendmentFlag |
| Namespace Prefix: |
dei_ |
| Data Type: |
xbrli:booleanItemType |
| Balance Type: |
na |
| Period Type: |
duration |
|
| X |
- DefinitionFor the EDGAR submission types of Form 8-K: the date of the report, the date of the earliest event reported; for the EDGAR submission types of Form N-1A: the filing date; for all other submission types: the end of the reporting or transition period. The format of the date is YYYY-MM-DD.
| Name: |
dei_DocumentPeriodEndDate |
| Namespace Prefix: |
dei_ |
| Data Type: |
xbrli:dateItemType |
| Balance Type: |
na |
| Period Type: |
duration |
|
| X |
- DefinitionThe type of document being provided (such as 10-K, 10-Q, 485BPOS, etc). The document type is limited to the same value as the supporting SEC submission type, or the word 'Other'.
| Name: |
dei_DocumentType |
| Namespace Prefix: |
dei_ |
| Data Type: |
dei:submissionTypeItemType |
| Balance Type: |
na |
| Period Type: |
duration |
|
| X |
- DefinitionAddress Line 1 such as Attn, Building Name, Street Name
| Name: |
dei_EntityAddressAddressLine1 |
| Namespace Prefix: |
dei_ |
| Data Type: |
xbrli:normalizedStringItemType |
| Balance Type: |
na |
| Period Type: |
duration |
|
| X |
- Definition
+ References
+ Details
| Name: |
dei_EntityAddressCityOrTown |
| Namespace Prefix: |
dei_ |
| Data Type: |
xbrli:normalizedStringItemType |
| Balance Type: |
na |
| Period Type: |
duration |
|
| X |
- DefinitionCode for the postal or zip code
| Name: |
dei_EntityAddressPostalZipCode |
| Namespace Prefix: |
dei_ |
| Data Type: |
xbrli:normalizedStringItemType |
| Balance Type: |
na |
| Period Type: |
duration |
|
| X |
- DefinitionName of the state or province.
| Name: |
dei_EntityAddressStateOrProvince |
| Namespace Prefix: |
dei_ |
| Data Type: |
dei:stateOrProvinceItemType |
| Balance Type: |
na |
| Period Type: |
duration |
|
| X |
- DefinitionA unique 10-digit SEC-issued value to identify entities that have filed disclosures with the SEC. It is commonly abbreviated as CIK. Reference 1: http://www.xbrl.org/2003/role/presentationRef
-Publisher SEC
-Name Exchange Act
-Number 240
-Section 12
-Subsection b-2
| Name: |
dei_EntityCentralIndexKey |
| Namespace Prefix: |
dei_ |
| Data Type: |
dei:centralIndexKeyItemType |
| Balance Type: |
na |
| Period Type: |
duration |
|
| X |
- DefinitionIndicate if registrant meets the emerging growth company criteria. Reference 1: http://www.xbrl.org/2003/role/presentationRef
-Publisher SEC
-Name Exchange Act
-Number 240
-Section 12
-Subsection b-2
| Name: |
dei_EntityEmergingGrowthCompany |
| Namespace Prefix: |
dei_ |
| Data Type: |
xbrli:booleanItemType |
| Balance Type: |
na |
| Period Type: |
duration |
|
| X |
- DefinitionCommission file number. The field allows up to 17 characters. The prefix may contain 1-3 digits, the sequence number may contain 1-8 digits, the optional suffix may contain 1-4 characters, and the fields are separated with a hyphen.
| Name: |
dei_EntityFileNumber |
| Namespace Prefix: |
dei_ |
| Data Type: |
dei:fileNumberItemType |
| Balance Type: |
na |
| Period Type: |
duration |
|
| X |
- DefinitionTwo-character EDGAR code representing the state or country of incorporation.
| Name: |
dei_EntityIncorporationStateCountryCode |
| Namespace Prefix: |
dei_ |
| Data Type: |
dei:edgarStateCountryItemType |
| Balance Type: |
na |
| Period Type: |
duration |
|
| X |
- DefinitionThe exact name of the entity filing the report as specified in its charter, which is required by forms filed with the SEC. Reference 1: http://www.xbrl.org/2003/role/presentationRef
-Publisher SEC
-Name Exchange Act
-Number 240
-Section 12
-Subsection b-2
| Name: |
dei_EntityRegistrantName |
| Namespace Prefix: |
dei_ |
| Data Type: |
xbrli:normalizedStringItemType |
| Balance Type: |
na |
| Period Type: |
duration |
|
| X |
- DefinitionThe Tax Identification Number (TIN), also known as an Employer Identification Number (EIN), is a unique 9-digit value assigned by the IRS. Reference 1: http://www.xbrl.org/2003/role/presentationRef
-Publisher SEC
-Name Exchange Act
-Number 240
-Section 12
-Subsection b-2
| Name: |
dei_EntityTaxIdentificationNumber |
| Namespace Prefix: |
dei_ |
| Data Type: |
dei:employerIdItemType |
| Balance Type: |
na |
| Period Type: |
duration |
|
| X |
- DefinitionLocal phone number for entity.
| Name: |
dei_LocalPhoneNumber |
| Namespace Prefix: |
dei_ |
| Data Type: |
xbrli:normalizedStringItemType |
| Balance Type: |
na |
| Period Type: |
duration |
|
| X |
- DefinitionBoolean flag that is true when the Form 8-K filing is intended to satisfy the filing obligation of the registrant as pre-commencement communications pursuant to Rule 13e-4(c) under the Exchange Act. Reference 1: http://www.xbrl.org/2003/role/presentationRef
-Publisher SEC
-Name Exchange Act
-Number 240
-Section 13e
-Subsection 4c
| Name: |
dei_PreCommencementIssuerTenderOffer |
| Namespace Prefix: |
dei_ |
| Data Type: |
xbrli:booleanItemType |
| Balance Type: |
na |
| Period Type: |
duration |
|
| X |
- DefinitionBoolean flag that is true when the Form 8-K filing is intended to satisfy the filing obligation of the registrant as pre-commencement communications pursuant to Rule 14d-2(b) under the Exchange Act. Reference 1: http://www.xbrl.org/2003/role/presentationRef
-Publisher SEC
-Name Exchange Act
-Number 240
-Section 14d
-Subsection 2b
| Name: |
dei_PreCommencementTenderOffer |
| Namespace Prefix: |
dei_ |
| Data Type: |
xbrli:booleanItemType |
| Balance Type: |
na |
| Period Type: |
duration |
|
| X |
- DefinitionTitle of a 12(b) registered security. Reference 1: http://www.xbrl.org/2003/role/presentationRef
-Publisher SEC
-Name Exchange Act
-Number 240
-Section 12
-Subsection b
| Name: |
dei_Security12bTitle |
| Namespace Prefix: |
dei_ |
| Data Type: |
dei:securityTitleItemType |
| Balance Type: |
na |
| Period Type: |
duration |
|
| X |
- DefinitionName of the Exchange on which a security is registered. Reference 1: http://www.xbrl.org/2003/role/presentationRef
-Publisher SEC
-Name Exchange Act
-Number 240
-Section 12
-Subsection d1-1
| Name: |
dei_SecurityExchangeName |
| Namespace Prefix: |
dei_ |
| Data Type: |
dei:edgarExchangeCodeItemType |
| Balance Type: |
na |
| Period Type: |
duration |
|
| X |
- DefinitionBoolean flag that is true when the Form 8-K filing is intended to satisfy the filing obligation of the registrant as soliciting material pursuant to Rule 14a-12 under the Exchange Act. Reference 1: http://www.xbrl.org/2003/role/presentationRef
-Publisher SEC
-Name Exchange Act
-Section 14a
-Number 240
-Subsection 12
| Name: |
dei_SolicitingMaterial |
| Namespace Prefix: |
dei_ |
| Data Type: |
xbrli:booleanItemType |
| Balance Type: |
na |
| Period Type: |
duration |
|
| X |
- DefinitionTrading symbol of an instrument as listed on an exchange.
| Name: |
dei_TradingSymbol |
| Namespace Prefix: |
dei_ |
| Data Type: |
dei:tradingSymbolItemType |
| Balance Type: |
na |
| Period Type: |
duration |
|
| X |
- DefinitionBoolean flag that is true when the Form 8-K filing is intended to satisfy the filing obligation of the registrant as written communications pursuant to Rule 425 under the Securities Act. Reference 1: http://www.xbrl.org/2003/role/presentationRef
-Publisher SEC
-Name Securities Act
-Number 230
-Section 425
| Name: |
dei_WrittenCommunications |
| Namespace Prefix: |
dei_ |
| Data Type: |
xbrli:booleanItemType |
| Balance Type: |
na |
| Period Type: |
duration |
|
| X |
- Details
| Name: |
dei_LegalEntityAxis=cube_CubesmartL.p.Member |
| Namespace Prefix: |
|
| Data Type: |
na |
| Balance Type: |
|
| Period Type: |
|
|
CubeSmart (NYSE:CUBE)
Historical Stock Chart
Von Apr 2024 bis Mai 2024

CubeSmart (NYSE:CUBE)
Historical Stock Chart
Von Mai 2023 bis Mai 2024
