Form 6-K - Report of foreign issuer [Rules 13a-16 and 15d-16]
25 Oktober 2023 - 10:31PM
Edgar (US Regulatory)
UNITED STATES
SECURITIES AND EXCHANGE COMMISSION
Washington, D.C. 20549
FORM 6-K
REPORT OF
FOREIGN PRIVATE ISSUER
PURSUANT TO RULE 13a-16 OR
15d-16
UNDER THE SECURITIES EXCHANGE ACT OF 1934
For the month of October 2023
Commission File Number: 001-35931
Constellium SE
(Translation of registrant’s name into English)
|
|
|
| Washington Plaza,
40-44 rue Washington
75008 Paris
France
(Head Office) |
|
300 East Lombard Street
Suite 1710 Baltimore, MD
21202 United States |
(Address of principal executive offices)
Indicate by check mark whether the registrant files or will file annual reports under cover of Form 20-F or Form 40-F:
Form 20-F ☒ Form 40-F ☐
Indicate by check mark if the registrant is submitting the Form
6-K in paper as permitted by Regulation S-T Rule 101(b)(1):
Yes ☐ No ☒
Indicate by check mark if the registrant is submitting the Form 6-K in paper as permitted by Regulation S-T Rule 101(b)(7):
Yes ☐ No ☒
INFORMATION CONTAINED IN THIS FORM 6-K REPORT
Attached hereto as Exhibit 99.1 is a copy of the press release of Constellium SE (the “Company”), dated October 25, 2023, announcing
its financial results for the third quarter ended September 30, 2023.
Attached hereto as Exhibit 99.2 is a copy of a presentation of the Company,
dated October 25, 2023, summarizing its financial results for the third quarter ended September 30, 2023.
Exhibit Index
The information contained in Exhibit 99.1 of this Form 6-K (except for the first
paragraph on page 2 containing certain quotes by the Chief Executive Officer, and the section titled “Outlook”), is incorporated by reference into any offering circular or registration statement (or into any prospectus that forms a part
thereof) filed by Constellium SE with the Securities and Exchange Commission. Exhibit 99.2 is not incorporated by reference.
SIGNATURE
Pursuant to the requirements of the Securities Exchange Act of 1934, the registrant has duly caused this report to be signed on its behalf by the undersigned,
thereunto duly authorized.
|
|
|
|
|
|
|
|
|
|
|
CONSTELLIUM SE
(Registrant) |
|
|
|
|
| October 25, 2023 |
|
|
|
By: |
|
/s/ Jack Guo |
|
|
|
|
Name: |
|
Jack Guo |
|
|
|
|
Title: |
|
Chief Financial Officer |
Exhibit 99.1

Constellium Reports Third Quarter 2023 Results
Paris, October 25, 2023 – Constellium SE (NYSE: CSTM) today reported results for the third quarter ended September 30,
2023.
Third quarter 2023 highlights:
| |
• |
|
Shipments of 369 thousand metric tons, down 5% compared to Q3 2022 |
| |
• |
|
Revenue of €1.7 billion, down 15% compared to Q3 2022 |
| |
• |
|
Value-Added Revenue (VAR) of €704 million, up 5% compared to Q3 2022
|
| |
• |
|
Net income of €64 million compared to net income of €131 million in Q3 2022
|
| |
• |
|
Adjusted EBITDA of €168 million, up 5% compared to Q3 2022 |
| |
• |
|
Cash from Operations of €154 million and Free Cash Flow of €78 million
|
Nine months ended September 30, 2023 highlights:
| |
• |
|
Shipments of 1.2 million metric tons, down 5% compared to YTD 2022 |
| |
• |
|
Revenue of €5.6 billion, down 10% compared to YTD 2022 |
| |
• |
|
VAR of €2.2 billion, up 11% compared to YTD 2022 |
| |
• |
|
Net income of €118 million compared to net income of €278 million in YTD 2022
|
| |
• |
|
Adjusted EBITDA of €542 million, up 3% compared to YTD 2022 |
| |
• |
|
Cash from Operations of €321 million and Free Cash Flow of €112 million
|
| |
• |
|
Net debt / LTM Adjusted EBITDA of 2.5x at September 30, 2023 |
Jean-Marc Germain, Constellium’s Chief Executive Officer said, “Constellium delivered strong results in the third quarter despite significant
inflationary pressures and demand headwinds in several end markets. Adjusted EBITDA of €168 million is a third quarter record and includes record third quarter performance by A&T. Looking across our end markets, aerospace demand
remains strong. Automotive demand decelerated slightly during the quarter but remains above prior year levels. Packaging shipments were down in the quarter though demand appears to have stabilized following the last several quarters of destocking.
We continued to experience weakness in most industrial markets, especially in Europe. Free Cash Flow generation in the third quarter was strong at €78 million and we reduced our leverage to 2.5x.”


Mr. Germain concluded, “We expect recent demand trends in our markets to continue through the
remainder of 2023. Based on our current outlook, in 2023 we still expect Adjusted EBITDA to be in the range of €700 million to €720 million and Free Cash Flow in excess of €150 million. We also remain confident in our
ability to deliver on our long-term target of Adjusted EBITDA over €800 million in 2025. Our focus remains on executing our strategy, driving operational performance, generating Free Cash Flow, achieving our ESG objectives and increasing
shareholder value.”
Group Summary
|
|
|
|
|
|
|
|
|
|
|
|
|
|
|
|
|
|
|
|
|
|
|
|
|
| |
|
Q3
2023 |
|
|
Q3
2022 |
|
|
Var. |
|
|
YTD
2023 |
|
|
YTD
2022 |
|
|
Var. |
|
| Shipments (k metric tons) |
|
|
369 |
|
|
|
387 |
|
|
|
(5 |
)% |
|
|
1,156 |
|
|
|
1,212 |
|
|
|
(5 |
)% |
| Revenue (€ millions) |
|
|
1,720 |
|
|
|
2,022 |
|
|
|
(15 |
)% |
|
|
5,626 |
|
|
|
6,276 |
|
|
|
(10 |
)% |
| VAR (€ millions) |
|
|
704 |
|
|
|
673 |
|
|
|
5 |
% |
|
|
2,243 |
|
|
|
2,029 |
|
|
|
11 |
% |
| Net income (€ millions) |
|
|
64 |
|
|
|
131 |
|
|
|
n.m. |
|
|
|
118 |
|
|
|
278 |
|
|
|
n.m. |
|
| Adjusted EBITDA (€ millions) |
|
|
168 |
|
|
|
160 |
|
|
|
5 |
% |
|
|
542 |
|
|
|
525 |
|
|
|
3 |
% |
| Adjusted EBITDA per metric ton (€) |
|
|
453 |
|
|
|
412 |
|
|
|
10 |
% |
|
|
469 |
|
|
|
433 |
|
|
|
8 |
% |
The difference between the sum of reported segment revenue and total group revenue includes revenue from certain non-core activities and inter-segment eliminations. The difference between the sum of reported segment Adjusted EBITDA and the Group Adjusted EBITDA is related to Holdings and Corporate.
For the third quarter of 2023, shipments of 369 thousand metric tons decreased 5% compared to the third quarter of last year due to lower shipments in
each of our segments. Revenue of €1.7 billion decreased 15% compared to the third quarter of the prior year primarily due to lower shipments and lower metal prices, partially offset by improved price and mix. VAR of €704 million
increased 5% compared to the third quarter of the prior year primarily due to improved price and mix, partially offset by lower shipments, unfavorable metal costs and unfavorable foreign exchange translation. Net income of €64 million
decreased €67 million compared to net income of €131 million in the third quarter of 2022. Adjusted EBITDA of €168 million increased 5% compared to the third quarter of last year due to stronger results in our A&T
segment, partially offset by weaker results in our P&ARP and AS&I segments.
For the first nine months of 2023, shipments of 1.2 million
metric tons decreased 5% compared to the first nine months of 2022 due to lower shipments in the P&ARP and AS&I segments. Revenue of €5.6 billion decreased 10% compared to the first nine months of 2022 primarily due to lower
shipments and lower metal prices, partially offset by improved price and mix. VAR of €2.2 billion increased 11% compared to the first nine months of 2022 primarily due to improved price and mix, partially offset by lower shipments,
unfavorable metal costs and unfavorable foreign exchange translation. Net income of €118 million decreased €160 million compared to net income of €278 million in the first nine months of 2022. Adjusted EBITDA of
€542 million increased 3% compared to the first nine months of 2022 due to stronger results in our A&T segment, partially offset by weaker results in our P&ARP and AS&I segments.
2
Results by Segment
Packaging & Automotive Rolled Products (P&ARP)
|
|
|
|
|
|
|
|
|
|
|
|
|
|
|
|
|
|
|
|
|
|
|
|
|
| |
|
Q3
2023 |
|
|
Q3
2022 |
|
|
Var. |
|
|
YTD
2023 |
|
|
YTD
2022 |
|
|
Var. |
|
| Shipments (k metric tons) |
|
|
261 |
|
|
|
267 |
|
|
|
(2 |
)% |
|
|
792 |
|
|
|
835 |
|
|
|
(5 |
)% |
| Revenue (€ millions) |
|
|
954 |
|
|
|
1,140 |
|
|
|
(16 |
)% |
|
|
3,033 |
|
|
|
3,656 |
|
|
|
(17 |
)% |
| Adjusted EBITDA (€ millions) |
|
|
67 |
|
|
|
78 |
|
|
|
(14 |
)% |
|
|
201 |
|
|
|
255 |
|
|
|
(21 |
)% |
| Adjusted EBITDA per metric ton (€) |
|
|
256 |
|
|
|
291 |
|
|
|
(12 |
)% |
|
|
254 |
|
|
|
305 |
|
|
|
(17 |
)% |
For the third quarter of 2023, Adjusted EBITDA of €67 million decreased 14% compared to the third quarter of 2022 as
a result of lower shipments, higher operating costs mainly due to inflation, operating challenges at our Muscle Shoals facility and unfavorable metal costs, and unfavorable foreign exchange translation, partially offset by improved price and mix.
Shipments of 261 thousand metric tons decreased 2% compared to the third quarter of the prior year due to lower shipments of packaging and specialty rolled products, partially offset by higher shipments of automotive rolled products. Revenue of
€1.0 billion decreased 16% compared to the third quarter of 2022 primarily due to lower shipments and lower metal prices, partially offset by improved price and mix.
For the first nine months of 2023, Adjusted EBITDA of €201 million decreased 21% compared to the first nine months of 2022 as a result of lower
shipments and higher operating costs mainly due to inflation, operating challenges at our Muscle Shoals facility and unfavorable metal costs, partially offset by improved price and mix. Shipments of 792 thousand metric tons decreased 5%
compared to the first nine months of 2022 due to lower shipments of packaging and specialty rolled products, partially offset by higher shipments of automotive rolled products. Revenue of €3.0 billion decreased 17% compared to the first
nine months of 2022 primarily due to lower shipments and lower metal prices, partially offset by improved price and mix.
3
Aerospace & Transportation (A&T)
|
|
|
|
|
|
|
|
|
|
|
|
|
|
|
|
|
|
|
|
|
|
|
|
|
| |
|
Q3
2023 |
|
|
Q3
2022 |
|
|
Var. |
|
|
YTD
2023 |
|
|
YTD
2022 |
|
|
Var. |
|
| Shipments (k metric tons) |
|
|
53 |
|
|
|
55 |
|
|
|
(3 |
)% |
|
|
171 |
|
|
|
170 |
|
|
|
1 |
% |
| Revenue (€ millions) |
|
|
404 |
|
|
|
432 |
|
|
|
(6 |
)% |
|
|
1,320 |
|
|
|
1,278 |
|
|
|
3 |
% |
| Adjusted EBITDA (€ millions) |
|
|
79 |
|
|
|
45 |
|
|
|
76 |
% |
|
|
248 |
|
|
|
161 |
|
|
|
55 |
% |
| Adjusted EBITDA per metric ton (€) |
|
|
1,480 |
|
|
|
807 |
|
|
|
83 |
% |
|
|
1,438 |
|
|
|
944 |
|
|
|
52 |
% |
For the third quarter of 2023, Adjusted EBITDA of €79 million increased 76% compared to the third quarter of 2022
primarily due to improved price and mix, partially offset by lower shipments, higher operating costs mainly due to inflation and unfavorable foreign exchange translation. Shipments of 53 thousand metric tons decreased 3% compared to the third
quarter of 2022 on higher shipments of aerospace rolled products, more than offset by lower shipments of transportation, industry and defense (TID) rolled products. Revenue of €404 million decreased 6% compared to the third quarter of 2022
primarily due to lower shipments, lower metal prices and unfavorable foreign exchange translation, partially offset by improved price and mix.
For the
first nine months of 2023, Adjusted EBITDA of €248 million increased 55% compared to the first nine months of 2022 primarily due to improved price and mix, partially offset by higher operating costs mainly due to inflation and increased
activity levels. Shipments of 171 thousand metric tons increased 1% compared to the first nine months of 2022 on higher shipments of aerospace rolled products, mostly offset by lower shipments of TID rolled products. Revenue of
€1.3 billion increased 3% compared to the first nine months of 2022 primarily due to improved price and mix, partially offset by lower metal prices.
Automotive Structures & Industry (AS&I)
|
|
|
|
|
|
|
|
|
|
|
|
|
|
|
|
|
|
|
|
|
|
|
|
|
| |
|
Q3
2023 |
|
|
Q3
2022 |
|
|
Var. |
|
|
YTD
2023 |
|
|
YTD
2022 |
|
|
Var. |
|
| Shipments (k metric tons) |
|
|
55 |
|
|
|
65 |
|
|
|
(15 |
)% |
|
|
193 |
|
|
|
207 |
|
|
|
(7 |
)% |
| Revenue (€ millions) |
|
|
370 |
|
|
|
473 |
|
|
|
(22 |
)% |
|
|
1,296 |
|
|
|
1,433 |
|
|
|
(10 |
)% |
| Adjusted EBITDA (€ millions) |
|
|
26 |
|
|
|
35 |
|
|
|
(27 |
)% |
|
|
108 |
|
|
|
118 |
|
|
|
(8 |
)% |
| Adjusted EBITDA per metric ton (€) |
|
|
467 |
|
|
|
544 |
|
|
|
(14 |
)% |
|
|
560 |
|
|
|
570 |
|
|
|
(2 |
)% |
For the third quarter of 2023, Adjusted EBITDA of €26 million decreased 27% compared to the third quarter of 2022
primarily due to lower shipments and higher operating costs mainly due to inflation, partially offset by improved price and mix. Shipments of 55 thousand metric tons decreased 15% compared to the third quarter of 2022 due to lower shipments of
automotive and other extruded products. Revenue of €370 million decreased 22% compared to the third quarter of 2022 primarily due to lower shipments and lower metal prices, partially offset by improved price and mix.
4
For the first nine months of 2023, Adjusted EBITDA of €108 million decreased 8% compared to the
first nine months of 2022 primarily due to lower shipments and higher operating costs mainly due to inflation, mostly offset by improved price and mix. Shipments of 193 thousand metric tons decreased 7% compared to the first nine months of 2022
due to lower shipments of other extruded products, partially offset by higher shipments of automotive extruded products. Revenue of €1.3 billion decreased 10% compared to the first nine months of 2022 primarily due to lower shipments and
lower metal prices, partially offset by improved price and mix.
Net Income
For the third quarter of 2023, net income of €64 million compares to net income of €131 million in the third quarter of the prior year. The
decrease in net income is primarily related to the recognition in the prior year of deferred tax assets previously unrecognized of €142 million, partially offset by a gain related to the sale of Constellium Extrusions Deutschland GmbH,
favorable changes in gains and losses on derivatives mostly related to our hedging positions, and higher gross profit.
For the first nine months of 2023,
net income of €118 million compares to net income of €278 million in the first nine months of the prior year. The decrease in net income is primarily related to the recognition in the prior year of deferred tax assets previously
unrecognized of €142 million and lower gross profit, partially offset by a gain related to the sale of Constellium Extrusions Deutschland GmbH.
Cash Flow
Free Cash Flow was €112 million in
the first nine months of 2023 compared to €160 million in the first nine months of the prior year. The decrease was primarily due to increased capital expenditures and higher cash interest, partially offset by stronger Adjusted EBITDA.
Cash flows from operating activities were €321 million for the first nine months of 2023 compared to cash flows from operating activities of
€323 million in the first nine months of the prior year.
Cash flows used in investing activities were €161 million for the first nine
months of 2023 compared to cash flows used in investing activities of €163 million in the first nine months of the prior year. In the first nine months of 2023, cash flows used in investing activities included €47 million of net
proceeds from the sale of Constellium Extrusion Deutschland GmbH in September 2023.
5
Cash flows used in financing activities were €167 million for the first nine months of 2023
compared to cash flows used in financing activities of €141 million in the first nine months of the prior year. In the first nine months of 2023, Constellium used cash on the balance sheet to reduce short-term borrowings and to redeem
$50 million of the $300 million outstanding aggregate principal amount of its 5.875% Senior Notes due 2026. In the first nine months of 2022, Constellium drew on the Pan-U.S. ABL due 2026 and used
the proceeds and cash on the balance sheet to repay the €180 million PGE French Facility due 2022 and the CHF 15 million Swiss Facility due 2025.
Liquidity and Net Debt
Liquidity at September 30,
2023 was €746 million, comprised of €159 million of cash and cash equivalents and €587 million available under our committed lending facilities and factoring arrangements.
Net debt was €1,750 million at September 30, 2023 compared to €1,891 million at December 31, 2022.
Outlook
Based on our current outlook, we expect Adjusted
EBITDA to be in the range of €700 million to €720 million and Free Cash Flow in excess of €150 million in 2023. We were not impacted by the United Auto Workers union strike in the third quarter, but we do expect some
impact in the fourth quarter, which is included in our guidance.
We are not able to provide a reconciliation of this Adjusted EBITDA guidance to net
income, the comparable GAAP measure, because certain items that are excluded from Adjusted EBITDA cannot be reasonably predicted or are not in our control. In particular, we are unable to forecast the timing or magnitude of realized and unrealized
gains and losses on derivative instruments, metal lag, impairment or restructuring charges, or taxes, without unreasonable efforts, and these items could significantly impact, either individually or in the aggregate, future net income.
6
Forward-looking statements
Certain statements contained in this press release may constitute forward-looking statements within the meaning of the Private Securities Litigation Reform Act
of 1995. This press release may contain “forward-looking statements” with respect to our business, results of operations and financial condition, and our expectations or beliefs concerning future events and conditions. You can identify
forward-looking statements because they contain words such as, but not limited to, “believes,” “expects,” “may,” “should,” “approximately,” “anticipates,” “estimates,”
“intends,” “plans,” “targets,” likely,” “will,” “would,” “could” and similar expressions (or the negative of these terminologies or expressions). All forward-looking statements involve
risks and uncertainties. Many risks and uncertainties are inherent in our industry and markets, while others are more specific to our business and operations. These risks and uncertainties include, but are not limited to: market competition;
economic downturn; disruption to business operations, including the length and magnitude of disruption resulting from the global COVID-19 pandemic; the Russian war on Ukraine; the inability to meet customer
demand and quality requirements; the loss of key customers, suppliers or other business relationships; supply disruptions; excessive inflation; the capacity and effectiveness of our hedging policy activities; the loss of key employees; levels of
indebtedness which could limit our operating flexibility and opportunities; and other risk factors set forth under the heading “Risk Factors” in our Annual Report on Form 20-F, and as described from
time to time in subsequent reports filed with the U.S. Securities and Exchange Commission. The occurrence of the events described and the achievement of the expected results depend on many events, some or all of which are not predictable or within
our control. Consequently, actual results may differ materially from the forward-looking statements contained in this press release. We undertake no obligation to update or revise any forward-looking statement as a result of new information, future
events or otherwise, except as required by law.
About Constellium
Constellium (NYSE: CSTM) is a global sector leader that develops innovative, value-added aluminium products for a broad scope of markets and applications,
including packaging, automotive and aerospace. Constellium generated €8.1 billion of revenue in 2022.
Constellium’s earnings materials for
the third quarter ended September 30, 2023 are also available on the company’s website (www.constellium.com).
7
CONSOLIDATED INCOME STATEMENT (UNAUDITED)
|
|
|
|
|
|
|
|
|
|
|
|
|
|
|
|
|
| |
|
Three months ended
September 30, |
|
|
Nine months ended
September 30, |
|
| (in millions of Euros) |
|
2023 |
|
|
2022 |
|
|
2023 |
|
|
2022 |
|
| Revenue |
|
|
1,720 |
|
|
|
2,022 |
|
|
|
5,626 |
|
|
|
6,276 |
|
| Cost of sales |
|
|
(1,562 |
) |
|
|
(1,889 |
) |
|
|
(5,094 |
) |
|
|
(5,711 |
) |
|
|
|
|
|
|
|
|
|
|
|
|
|
|
|
|
|
| Gross profit |
|
|
158 |
|
|
|
133 |
|
|
|
532 |
|
|
|
565 |
|
|
|
|
|
|
|
|
|
|
|
|
|
|
|
|
|
|
| Selling and administrative expenses |
|
|
(70 |
) |
|
|
(63 |
) |
|
|
(221 |
) |
|
|
(206 |
) |
| Research and development expenses |
|
|
(11 |
) |
|
|
(11 |
) |
|
|
(37 |
) |
|
|
(32 |
) |
| Other gains and losses - net |
|
|
41 |
|
|
|
(29 |
) |
|
|
(15 |
) |
|
|
(53 |
) |
|
|
|
|
|
|
|
|
|
|
|
|
|
|
|
|
|
| Income from operations |
|
|
118 |
|
|
|
30 |
|
|
|
259 |
|
|
|
274 |
|
|
|
|
|
|
|
|
|
|
|
|
|
|
|
|
|
|
| Finance costs - net |
|
|
(36 |
) |
|
|
(36 |
) |
|
|
(106 |
) |
|
|
(98 |
) |
|
|
|
|
|
|
|
|
|
|
|
|
|
|
|
|
|
| Income / (loss) before tax |
|
|
82 |
|
|
|
(6 |
) |
|
|
153 |
|
|
|
176 |
|
|
|
|
|
|
|
|
|
|
|
|
|
|
|
|
|
|
| Income tax (expense) / benefit |
|
|
(18 |
) |
|
|
137 |
|
|
|
(35 |
) |
|
|
102 |
|
|
|
|
|
|
|
|
|
|
|
|
|
|
|
|
|
|
| Net income |
|
|
64 |
|
|
|
131 |
|
|
|
118 |
|
|
|
278 |
|
|
|
|
|
|
|
|
|
|
|
|
|
|
|
|
|
|
| Net income attributable to: |
|
|
|
|
|
|
|
|
|
|
|
|
|
|
|
|
| Equity holders of Constellium |
|
|
64 |
|
|
|
130 |
|
|
|
115 |
|
|
|
273 |
|
| Non-controlling interests |
|
|
— |
|
|
|
1 |
|
|
|
3 |
|
|
|
5 |
|
|
|
|
|
|
|
|
|
|
|
|
|
|
|
|
|
|
| Net income |
|
|
64 |
|
|
|
131 |
|
|
|
118 |
|
|
|
278 |
|
|
|
|
|
|
|
|
|
|
|
|
|
|
|
|
|
|
| Earnings per share attributable to the equity holders of Constellium, (in Euros) |
|
|
|
|
|
|
|
|
|
|
|
|
|
|
|
|
| Basic |
|
|
0.44 |
|
|
|
0.90 |
|
|
|
0.79 |
|
|
|
1.90 |
|
| Diluted |
|
|
0.43 |
|
|
|
0.88 |
|
|
|
0.77 |
|
|
|
1.86 |
|
| Weighted average number of shares, (in thousands) |
|
|
|
|
|
|
|
|
|
|
|
|
|
|
|
|
| Basic |
|
|
146,820 |
|
|
|
144,302 |
|
|
|
145,897 |
|
|
|
143,398 |
|
| Diluted |
|
|
148,704 |
|
|
|
146,759 |
|
|
|
148,704 |
|
|
|
146,759 |
|
|
|
|
|
|
|
|
|
|
|
|
|
|
|
|
|
|
8
CONSOLIDATED STATEMENT OF COMPREHENSIVE INCOME / (LOSS) (UNAUDITED)
|
|
|
|
|
|
|
|
|
|
|
|
|
|
|
|
|
| |
|
Three months ended
September 30, |
|
|
Nine months ended
September 30, |
|
| (in millions of Euros) |
|
2023 |
|
|
2022 |
|
|
2023 |
|
|
2022 |
|
| Net income |
|
|
64 |
|
|
|
131 |
|
|
|
118 |
|
|
|
278 |
|
|
|
|
|
|
|
|
|
|
|
|
|
|
|
|
|
|
| Other comprehensive income |
|
|
|
|
|
|
|
|
|
|
|
|
|
|
|
|
| Items that will not be reclassified subsequently to the consolidated income
statement |
|
|
|
|
|
|
|
|
|
|
|
|
|
|
|
|
| Remeasurement on post-employment benefit obligations |
|
|
26 |
|
|
|
26 |
|
|
|
30 |
|
|
|
181 |
|
| Income tax on remeasurement on post-employment benefit obligations |
|
|
(6 |
) |
|
|
(9 |
) |
|
|
(8 |
) |
|
|
(39 |
) |
| Items that may be reclassified subsequently to the consolidated income
statement |
|
|
|
|
|
|
|
|
|
|
|
|
|
|
|
|
| Cash flow hedges |
|
|
(6 |
) |
|
|
(12 |
) |
|
|
(2 |
) |
|
|
(27 |
) |
| Income tax on cash flow hedges |
|
|
2 |
|
|
|
3 |
|
|
|
1 |
|
|
|
7 |
|
| Currency translation differences |
|
|
20 |
|
|
|
47 |
|
|
|
7 |
|
|
|
89 |
|
|
|
|
|
|
|
|
|
|
|
|
|
|
|
|
|
|
| Other comprehensive income |
|
|
36 |
|
|
|
55 |
|
|
|
28 |
|
|
|
211 |
|
|
|
|
|
|
|
|
|
|
|
|
|
|
|
|
|
|
| Total comprehensive income |
|
|
100 |
|
|
|
186 |
|
|
|
146 |
|
|
|
489 |
|
|
|
|
|
|
|
|
|
|
|
|
|
|
|
|
|
|
| Attributable to: |
|
|
|
|
|
|
|
|
|
|
|
|
|
|
|
|
| Equity holders of Constellium |
|
|
99 |
|
|
|
184 |
|
|
|
143 |
|
|
|
483 |
|
| Non-controlling interests |
|
|
1 |
|
|
|
2 |
|
|
|
3 |
|
|
|
6 |
|
|
|
|
|
|
|
|
|
|
|
|
|
|
|
|
|
|
| Total comprehensive income |
|
|
100 |
|
|
|
186 |
|
|
|
146 |
|
|
|
489 |
|
|
|
|
|
|
|
|
|
|
|
|
|
|
|
|
|
|
9
CONSOLIDATED STATEMENT OF FINANCIAL POSITION (UNAUDITED)
|
|
|
|
|
|
|
|
|
| (in millions of Euros) |
|
At September 30, 2023 |
|
|
At December 31, 2022 |
|
| Assets |
|
|
|
|
|
|
|
|
| Current assets |
|
|
|
|
|
|
|
|
| Cash and cash equivalents |
|
|
159 |
|
|
|
166 |
|
| Trade receivables and other |
|
|
642 |
|
|
|
539 |
|
| Inventories |
|
|
1,137 |
|
|
|
1,320 |
|
| Other financial assets |
|
|
34 |
|
|
|
31 |
|
|
|
|
|
|
|
|
|
|
|
|
|
1,972 |
|
|
|
2,056 |
|
|
|
|
|
|
|
|
|
|
| Non-current assets |
|
|
|
|
|
|
|
|
| Property, plant and equipment |
|
|
2,020 |
|
|
|
2,017 |
|
| Goodwill |
|
|
482 |
|
|
|
478 |
|
| Intangible assets |
|
|
50 |
|
|
|
54 |
|
| Deferred tax assets |
|
|
228 |
|
|
|
271 |
|
| Trade receivables and other |
|
|
40 |
|
|
|
43 |
|
| Other financial assets |
|
|
3 |
|
|
|
8 |
|
|
|
|
|
|
|
|
|
|
|
|
|
2,823 |
|
|
|
2,871 |
|
|
|
|
|
|
|
|
|
|
| Assets of disposal group classified as held for sale |
|
|
— |
|
|
|
14 |
|
|
|
|
|
|
|
|
|
|
| Total Assets |
|
|
4,795 |
|
|
|
4,941 |
|
|
|
|
|
|
|
|
|
|
| Liabilities |
|
|
|
|
|
|
|
|
| Current liabilities |
|
|
|
|
|
|
|
|
| Trade payables and other |
|
|
1,354 |
|
|
|
1,467 |
|
| Borrowings |
|
|
54 |
|
|
|
148 |
|
| Other financial liabilities |
|
|
46 |
|
|
|
41 |
|
| Income tax payable |
|
|
15 |
|
|
|
16 |
|
| Provisions |
|
|
21 |
|
|
|
21 |
|
|
|
|
|
|
|
|
|
|
|
|
|
1,490 |
|
|
|
1,693 |
|
|
|
|
|
|
|
|
|
|
| Non-current liabilities |
|
|
|
|
|
|
|
|
| Trade payables and other |
|
|
64 |
|
|
|
43 |
|
| Borrowings |
|
|
1,855 |
|
|
|
1,908 |
|
| Other financial liabilities |
|
|
14 |
|
|
|
14 |
|
| Pension and other post-employment benefit obligations |
|
|
369 |
|
|
|
403 |
|
| Provisions |
|
|
88 |
|
|
|
90 |
|
| Deferred tax liabilities |
|
|
4 |
|
|
|
28 |
|
|
|
|
|
|
|
|
|
|
|
|
|
2,394 |
|
|
|
2,486 |
|
|
|
|
|
|
|
|
|
|
| Liabilities of disposal group classified as held for sale |
|
|
— |
|
|
|
10 |
|
|
|
|
|
|
|
|
|
|
| Total Liabilities |
|
|
3,884 |
|
|
|
4,189 |
|
|
|
|
|
|
|
|
|
|
| Equity |
|
|
|
|
|
|
|
|
| Share capital |
|
|
3 |
|
|
|
3 |
|
| Share premium |
|
|
420 |
|
|
|
420 |
|
| Retained earnings and other reserves |
|
|
466 |
|
|
|
308 |
|
|
|
|
|
|
|
|
|
|
| Equity attributable to equity holders of Constellium |
|
|
889 |
|
|
|
731 |
|
| Non-controlling interests |
|
|
22 |
|
|
|
21 |
|
|
|
|
|
|
|
|
|
|
| Total Equity |
|
|
911 |
|
|
|
752 |
|
|
|
|
|
|
|
|
|
|
| Total Equity and Liabilities |
|
|
4,795 |
|
|
|
4,941 |
|
|
|
|
|
|
|
|
|
|
10
CONSOLIDATED STATEMENT OF CHANGES IN EQUITY (UNAUDITED)
|
|
|
|
|
|
|
|
|
|
|
|
|
|
|
|
|
|
|
|
|
|
|
|
|
|
|
|
|
|
|
|
|
|
|
|
|
|
|
|
|
| (in millions of Euros) |
|
Share
capital |
|
|
Share
premium |
|
|
Re-
measure
ment |
|
|
Cash
flow
hedges |
|
|
Foreign
currency
translation
reserve |
|
|
Other
reserves |
|
|
Retained
earnings |
|
|
Total |
|
|
Non-
controlling
interests |
|
|
Total
equity |
|
| At January 1, 2023 |
|
|
3 |
|
|
|
420 |
|
|
|
28 |
|
|
|
(10 |
) |
|
|
41 |
|
|
|
101 |
|
|
|
148 |
|
|
|
731 |
|
|
|
21 |
|
|
|
752 |
|
| Net income |
|
|
— |
|
|
|
— |
|
|
|
— |
|
|
|
— |
|
|
|
— |
|
|
|
— |
|
|
|
115 |
|
|
|
115 |
|
|
|
3 |
|
|
|
118 |
|
| Other comprehensive income / (loss) |
|
|
— |
|
|
|
— |
|
|
|
22 |
|
|
|
(1 |
) |
|
|
7 |
|
|
|
— |
|
|
|
— |
|
|
|
28 |
|
|
|
— |
|
|
|
28 |
|
|
|
|
|
|
|
|
|
|
|
|
|
|
|
|
|
|
|
|
|
|
|
|
|
|
|
|
|
|
|
|
|
|
|
|
|
|
|
|
|
|
| Total comprehensive income / (loss) |
|
|
— |
|
|
|
— |
|
|
|
22 |
|
|
|
(1 |
) |
|
|
7 |
|
|
|
— |
|
|
|
115 |
|
|
|
143 |
|
|
|
3 |
|
|
|
146 |
|
|
|
|
|
|
|
|
|
|
|
|
|
|
|
|
|
|
|
|
|
|
|
|
|
|
|
|
|
|
|
|
|
|
|
|
|
|
|
|
|
|
| Share-based compensation |
|
|
— |
|
|
|
— |
|
|
|
— |
|
|
|
— |
|
|
|
— |
|
|
|
15 |
|
|
|
— |
|
|
|
15 |
|
|
|
— |
|
|
|
15 |
|
| Other |
|
|
— |
|
|
|
— |
|
|
|
(1 |
) |
|
|
— |
|
|
|
— |
|
|
|
— |
|
|
|
1 |
|
|
|
— |
|
|
|
— |
|
|
|
— |
|
| Transactions with non-controlling interests |
|
|
— |
|
|
|
— |
|
|
|
— |
|
|
|
— |
|
|
|
— |
|
|
|
— |
|
|
|
— |
|
|
|
— |
|
|
|
(2 |
) |
|
|
(2 |
) |
|
|
|
|
|
|
|
|
|
|
|
|
|
|
|
|
|
|
|
|
|
|
|
|
|
|
|
|
|
|
|
|
|
|
|
|
|
|
|
|
|
| At September 30, 2023 |
|
|
3 |
|
|
|
420 |
|
|
|
49 |
|
|
|
(11 |
) |
|
|
48 |
|
|
|
116 |
|
|
|
264 |
|
|
|
889 |
|
|
|
22 |
|
|
|
911 |
|
|
|
|
|
|
|
|
|
|
|
|
|
|
|
|
|
|
|
|
|
|
|
|
|
|
|
|
|
|
|
|
|
|
|
|
|
|
|
|
|
|
|
|
|
|
|
|
|
|
|
|
|
| (in millions of Euros) |
|
Share
capital |
|
|
Share
premium |
|
|
Re-
measure
ment |
|
|
Cash
flow
hedges |
|
|
Foreign
currency
translation
reserve |
|
|
Other
reserves |
|
|
Retained
(deficit) /
earnings |
|
|
Total |
|
|
Non-
controlling
interests |
|
|
Total
equity |
|
| At January 1, 2022 |
|
|
3 |
|
|
|
420 |
|
|
|
(94 |
) |
|
|
(4 |
) |
|
|
19 |
|
|
|
83 |
|
|
|
(153 |
) |
|
|
274 |
|
|
|
17 |
|
|
|
291 |
|
| Net income |
|
|
— |
|
|
|
— |
|
|
|
— |
|
|
|
— |
|
|
|
— |
|
|
|
— |
|
|
|
273 |
|
|
|
273 |
|
|
|
5 |
|
|
|
278 |
|
| Other comprehensive income / (loss) |
|
|
— |
|
|
|
— |
|
|
|
142 |
|
|
|
(20 |
) |
|
|
88 |
|
|
|
— |
|
|
|
— |
|
|
|
210 |
|
|
|
1 |
|
|
|
211 |
|
|
|
|
|
|
|
|
|
|
|
|
|
|
|
|
|
|
|
|
|
|
|
|
|
|
|
|
|
|
|
|
|
|
|
|
|
|
|
|
|
|
| Total comprehensive income / (loss) |
|
|
— |
|
|
|
— |
|
|
|
142 |
|
|
|
(20 |
) |
|
|
88 |
|
|
|
— |
|
|
|
273 |
|
|
|
483 |
|
|
|
6 |
|
|
|
489 |
|
|
|
|
|
|
|
|
|
|
|
|
|
|
|
|
|
|
|
|
|
|
|
|
|
|
|
|
|
|
|
|
|
|
|
|
|
|
|
|
|
|
| Share-based compensation |
|
|
— |
|
|
|
— |
|
|
|
— |
|
|
|
— |
|
|
|
— |
|
|
|
13 |
|
|
|
— |
|
|
|
13 |
|
|
|
— |
|
|
|
13 |
|
| Transactions with non-controlling interests |
|
|
— |
|
|
|
— |
|
|
|
— |
|
|
|
— |
|
|
|
— |
|
|
|
— |
|
|
|
— |
|
|
|
— |
|
|
|
— |
|
|
|
— |
|
|
|
|
|
|
|
|
|
|
|
|
|
|
|
|
|
|
|
|
|
|
|
|
|
|
|
|
|
|
|
|
|
|
|
|
|
|
|
|
|
|
| At September 30, 2022 |
|
|
3 |
|
|
|
420 |
|
|
|
48 |
|
|
|
(24 |
) |
|
|
107 |
|
|
|
96 |
|
|
|
120 |
|
|
|
770 |
|
|
|
23 |
|
|
|
793 |
|
|
|
|
|
|
|
|
|
|
|
|
|
|
|
|
|
|
|
|
|
|
|
|
|
|
|
|
|
|
|
|
|
|
|
|
|
|
|
|
|
|
11
CONSOLIDATED STATEMENT OF CASH FLOWS (UNAUDITED)
|
|
|
|
|
|
|
|
|
|
|
|
|
|
|
|
|
| |
|
Three months ended
September 30, |
|
|
Nine months ended
September 30, |
|
| (in millions of Euros) |
|
2023 |
|
|
2022 |
|
|
2023 |
|
|
2022 |
|
| Net income |
|
|
64 |
|
|
|
131 |
|
|
|
118 |
|
|
|
278 |
|
| Adjustments |
|
|
|
|
|
|
|
|
|
|
|
|
|
|
|
|
| Depreciation and amortization |
|
|
77 |
|
|
|
73 |
|
|
|
221 |
|
|
|
209 |
|
| Pension and other post-employment benefits service costs |
|
|
5 |
|
|
|
7 |
|
|
|
16 |
|
|
|
18 |
|
| Finance costs - net |
|
|
36 |
|
|
|
36 |
|
|
|
106 |
|
|
|
98 |
|
| Income tax expense / (benefit) |
|
|
18 |
|
|
|
(137 |
) |
|
|
35 |
|
|
|
(102 |
) |
| Unrealized (gains) / losses on derivatives - net and from remeasurement of monetary assets and
liabilities - net |
|
|
(23 |
) |
|
|
(18 |
) |
|
|
5 |
|
|
|
67 |
|
| (Gains) / losses on disposal |
|
|
(36 |
) |
|
|
1 |
|
|
|
(30 |
) |
|
|
2 |
|
| Other - net |
|
|
5 |
|
|
|
4 |
|
|
|
15 |
|
|
|
12 |
|
| Change in working capital |
|
|
|
|
|
|
|
|
|
|
|
|
|
|
|
|
| Inventories |
|
|
25 |
|
|
|
18 |
|
|
|
175 |
|
|
|
(238 |
) |
| Trade receivables |
|
|
133 |
|
|
|
195 |
|
|
|
(91 |
) |
|
|
(92 |
) |
| Trade payables |
|
|
(109 |
) |
|
|
(119 |
) |
|
|
(123 |
) |
|
|
206 |
|
| Other |
|
|
14 |
|
|
|
(1 |
) |
|
|
20 |
|
|
|
3 |
|
| Change in provisions |
|
|
(1 |
) |
|
|
(3 |
) |
|
|
(3 |
) |
|
|
(7 |
) |
| Pension and other post-employment benefits paid |
|
|
(11 |
) |
|
|
(12 |
) |
|
|
(30 |
) |
|
|
(33 |
) |
| Interest paid |
|
|
(33 |
) |
|
|
(31 |
) |
|
|
(96 |
) |
|
|
(85 |
) |
| Income tax paid |
|
|
(10 |
) |
|
|
10 |
|
|
|
(17 |
) |
|
|
(13 |
) |
|
|
|
|
|
|
|
|
|
|
|
|
|
|
|
|
|
| Net cash flows from operating activities |
|
|
154 |
|
|
|
154 |
|
|
|
321 |
|
|
|
323 |
|
|
|
|
|
|
|
|
|
|
|
|
|
|
|
|
|
|
| Purchases of property, plant and equipment |
|
|
(76 |
) |
|
|
(80 |
) |
|
|
(210 |
) |
|
|
(164 |
) |
| Property, plant and equipment grants received |
|
|
— |
|
|
|
— |
|
|
|
1 |
|
|
|
1 |
|
| Proceeds from disposals, net of cash |
|
|
48 |
|
|
|
— |
|
|
|
48 |
|
|
|
— |
|
|
|
|
|
|
|
|
|
|
|
|
|
|
|
|
|
|
| Net cash flows used in investing activities |
|
|
(28 |
) |
|
|
(80 |
) |
|
|
(161 |
) |
|
|
(163 |
) |
|
|
|
|
|
|
|
|
|
|
|
|
|
|
|
|
|
| Repayments of long-term borrowings |
|
|
(46 |
) |
|
|
(2 |
) |
|
|
(51 |
) |
|
|
(188 |
) |
| Net change in revolving credit facilities and short-term borrowings |
|
|
(90 |
) |
|
|
(57 |
) |
|
|
(83 |
) |
|
|
67 |
|
| Lease repayments |
|
|
(13 |
) |
|
|
(7 |
) |
|
|
(29 |
) |
|
|
(27 |
) |
| Payment of financing costs and redemption fees |
|
|
— |
|
|
|
(1 |
) |
|
|
— |
|
|
|
(1 |
) |
| Transactions with non-controlling interests |
|
|
— |
|
|
|
— |
|
|
|
(3 |
) |
|
|
(2 |
) |
| Other financing activities |
|
|
1 |
|
|
|
5 |
|
|
|
(1 |
) |
|
|
10 |
|
|
|
|
|
|
|
|
|
|
|
|
|
|
|
|
|
|
| Net cash flows used in financing activities |
|
|
(148 |
) |
|
|
(62 |
) |
|
|
(167 |
) |
|
|
(141 |
) |
|
|
|
|
|
|
|
|
|
|
|
|
|
|
|
|
|
| Net (decrease) / increase in cash and cash equivalent |
|
|
(22 |
) |
|
|
12 |
|
|
|
(7 |
) |
|
|
19 |
|
| Cash and cash equivalents - beginning of period |
|
|
178 |
|
|
|
156 |
|
|
|
166 |
|
|
|
147 |
|
| Transfer of cash and cash equivalents classified from / (to) assets classified as held for
sale |
|
|
2 |
|
|
|
— |
|
|
|
1 |
|
|
|
— |
|
| Effect of exchange rate changes on cash and cash equivalents |
|
|
1 |
|
|
|
3 |
|
|
|
(1 |
) |
|
|
5 |
|
|
|
|
|
|
|
|
|
|
|
|
|
|
|
|
|
|
| Cash and cash equivalents - end of period |
|
|
159 |
|
|
|
171 |
|
|
|
159 |
|
|
|
171 |
|
|
|
|
|
|
|
|
|
|
|
|
|
|
|
|
|
|
12
SEGMENT ADJUSTED EBITDA
|
|
|
|
|
|
|
|
|
|
|
|
|
|
|
|
|
| |
|
Three months ended
September 30, |
|
|
Nine months ended
September 30, |
|
| (in millions of Euros) |
|
2023 |
|
|
2022 |
|
|
2023 |
|
|
2022 |
|
| P&ARP |
|
|
67 |
|
|
|
78 |
|
|
|
201 |
|
|
|
255 |
|
| A&T |
|
|
79 |
|
|
|
45 |
|
|
|
248 |
|
|
|
161 |
|
| AS&I |
|
|
26 |
|
|
|
35 |
|
|
|
108 |
|
|
|
118 |
|
| Holdings and Corporate |
|
|
(4 |
) |
|
|
2 |
|
|
|
(15 |
) |
|
|
(9 |
) |
|
|
|
|
|
|
|
|
|
|
|
|
|
|
|
|
|
| Total |
|
|
168 |
|
|
|
160 |
|
|
|
542 |
|
|
|
525 |
|
|
|
|
|
|
|
|
|
|
|
|
|
|
|
|
|
|
SHIPMENTS AND REVENUE BY PRODUCT LINE
|
|
|
|
|
|
|
|
|
|
|
|
|
|
|
|
|
| |
|
Three months ended
September 30, |
|
|
Nine months ended
September 30, |
|
| (in k metric tons) |
|
2023 |
|
|
2022 |
|
|
2023 |
|
|
2022 |
|
| Packaging rolled products |
|
|
187 |
|
|
|
196 |
|
|
|
564 |
|
|
|
623 |
|
| Automotive rolled products |
|
|
68 |
|
|
|
64 |
|
|
|
209 |
|
|
|
184 |
|
| Specialty and other thin-rolled products |
|
|
6 |
|
|
|
7 |
|
|
|
19 |
|
|
|
28 |
|
| Aerospace rolled products |
|
|
23 |
|
|
|
19 |
|
|
|
74 |
|
|
|
55 |
|
| Transportation, industry, defense and other rolled products |
|
|
30 |
|
|
|
36 |
|
|
|
97 |
|
|
|
115 |
|
| Automotive extruded products |
|
|
27 |
|
|
|
29 |
|
|
|
93 |
|
|
|
89 |
|
| Other extruded products |
|
|
28 |
|
|
|
36 |
|
|
|
100 |
|
|
|
118 |
|
|
|
|
|
|
|
|
|
|
|
|
|
|
|
|
|
|
| Total shipments |
|
|
369 |
|
|
|
387 |
|
|
|
1,156 |
|
|
|
1,212 |
|
|
|
|
|
|
|
|
|
|
|
|
|
|
|
|
|
|
|
|
|
|
|
| (in millions of Euros) |
|
|
|
|
|
|
|
|
|
|
|
|
| Packaging rolled products |
|
|
630 |
|
|
|
792 |
|
|
|
2,014 |
|
|
|
2,629 |
|
| Automotive rolled products |
|
|
286 |
|
|
|
308 |
|
|
|
902 |
|
|
|
879 |
|
| Specialty and other thin-rolled products |
|
|
38 |
|
|
|
40 |
|
|
|
117 |
|
|
|
148 |
|
| Aerospace rolled products |
|
|
234 |
|
|
|
184 |
|
|
|
758 |
|
|
|
510 |
|
| Transportation, industry, defense and other rolled products |
|
|
171 |
|
|
|
248 |
|
|
|
562 |
|
|
|
768 |
|
| Automotive extruded products |
|
|
213 |
|
|
|
248 |
|
|
|
723 |
|
|
|
721 |
|
| Other extruded products |
|
|
157 |
|
|
|
225 |
|
|
|
573 |
|
|
|
712 |
|
| Other and inter-segment eliminations |
|
|
(9 |
) |
|
|
(23 |
) |
|
|
(23 |
) |
|
|
(91 |
) |
|
|
|
|
|
|
|
|
|
|
|
|
|
|
|
|
|
| Total revenue |
|
|
1,720 |
|
|
|
2,022 |
|
|
|
5,626 |
|
|
|
6,276 |
|
|
|
|
|
|
|
|
|
|
|
|
|
|
|
|
|
|
13
NON-GAAP MEASURES
Reconciliation of Revenue to VAR (a non-GAAP measure)
|
|
|
|
|
|
|
|
|
|
|
|
|
|
|
|
|
| |
|
Three months ended
September 30, |
|
|
Nine months ended
September 30, |
|
| (in millions of Euros) |
|
2023 |
|
|
2022 |
|
|
2023 |
|
|
2022 |
|
| Revenue |
|
|
1,720 |
|
|
|
2,022 |
|
|
|
5,626 |
|
|
|
6,276 |
|
| Hedged cost of alloyed metal |
|
|
(1,037 |
) |
|
|
(1,414 |
) |
|
|
(3,435 |
) |
|
|
(4,191 |
) |
| Revenue from incidental activities |
|
|
(6 |
) |
|
|
(5 |
) |
|
|
(20 |
) |
|
|
(16 |
) |
| Metal price lag |
|
|
27 |
|
|
|
70 |
|
|
|
72 |
|
|
|
(40 |
) |
|
|
|
|
|
|
|
|
|
|
|
|
|
|
|
|
|
| VAR |
|
|
704 |
|
|
|
673 |
|
|
|
2,243 |
|
|
|
2,029 |
|
|
|
|
|
|
|
|
|
|
|
|
|
|
|
|
|
|
Reconciliation of net income to Adjusted EBITDA (a non-GAAP measure)
|
|
|
|
|
|
|
|
|
|
|
|
|
|
|
|
|
| |
|
Three months ended
September 30, |
|
|
Nine months ended
September 30, |
|
| (in millions of Euros) |
|
2023 |
|
|
2022 |
|
|
2023 |
|
|
2022 |
|
| Net income |
|
|
64 |
|
|
|
131 |
|
|
|
118 |
|
|
|
278 |
|
| Income tax expense / (benefit) |
|
|
18 |
|
|
|
(137 |
) |
|
|
35 |
|
|
|
(102 |
) |
|
|
|
|
|
|
|
|
|
|
|
|
|
|
|
|
|
| Income / (loss) before tax |
|
|
82 |
|
|
|
(6 |
) |
|
|
153 |
|
|
|
176 |
|
| Finance costs - net |
|
|
36 |
|
|
|
36 |
|
|
|
106 |
|
|
|
98 |
|
|
|
|
|
|
|
|
|
|
|
|
|
|
|
|
|
|
| Income from operations |
|
|
118 |
|
|
|
30 |
|
|
|
259 |
|
|
|
274 |
|
| Depreciation and amortization |
|
|
77 |
|
|
|
73 |
|
|
|
221 |
|
|
|
209 |
|
| Unrealized (gains) / losses on derivatives |
|
|
(23 |
) |
|
|
(19 |
) |
|
|
5 |
|
|
|
65 |
|
| Unrealized exchange losses from the remeasurement of monetary assets and liabilities -
net |
|
|
— |
|
|
|
1 |
|
|
|
— |
|
|
|
2 |
|
| Share based compensation costs |
|
|
5 |
|
|
|
4 |
|
|
|
15 |
|
|
|
13 |
|
| Metal price lag (A) |
|
|
27 |
|
|
|
70 |
|
|
|
72 |
|
|
|
(40 |
) |
| (Gains) / losses on disposal |
|
|
(36 |
) |
|
|
1 |
|
|
|
(30 |
) |
|
|
2 |
|
|
|
|
|
|
|
|
|
|
|
|
|
|
|
|
|
|
| Adjusted EBITDA |
|
|
168 |
|
|
|
160 |
|
|
|
542 |
|
|
|
525 |
|
|
|
|
|
|
|
|
|
|
|
|
|
|
|
|
|
|
| (A) |
Metal price lag represents the financial impact of the timing difference between when aluminium prices included
within Constellium’s Revenue are established and when aluminium purchase prices included in Cost of sales are established. The Group accounts for inventory using a weighted average price basis and this adjustment aims to remove the effect of
volatility in LME prices. The calculation of the Group metal price lag adjustment is based on a standardized methodology calculated at each of Constellium’s manufacturing sites and is primarily calculated as the average value of product
recorded in inventory, which approximates the spot price in the market, less the average value transferred out of inventory, which is the weighted average of the metal element of cost of sales, based on the quantity sold in the period.
|
14
Reconciliation of net cash flows from operating activities to Free Cash Flow (a non-GAAP measure)
|
|
|
|
|
|
|
|
|
|
|
|
|
|
|
|
|
| |
|
Three months ended
September 30, |
|
|
Nine months ended
September 30, |
|
| (in millions of Euros) |
|
2023 |
|
|
2022 |
|
|
2023 |
|
|
2022 |
|
| Net cash flows from operating activities |
|
|
154 |
|
|
|
154 |
|
|
|
321 |
|
|
|
323 |
|
| Purchases of property, plant and equipment, net of grants received |
|
|
(76 |
) |
|
|
(80 |
) |
|
|
(209 |
) |
|
|
(163 |
) |
|
|
|
|
|
|
|
|
|
|
|
|
|
|
|
|
|
| Free Cash Flow |
|
|
78 |
|
|
|
74 |
|
|
|
112 |
|
|
|
160 |
|
|
|
|
|
|
|
|
|
|
|
|
|
|
|
|
|
|
Reconciliation of borrowings to Net debt (a non-GAAP measure)
|
|
|
|
|
|
|
|
|
| (in millions of Euros) |
|
At September 30, 2023 |
|
|
At December 31, 2022 |
|
| Borrowings |
|
|
1,909 |
|
|
|
2,056 |
|
| Fair value of net debt derivatives, net of margin calls |
|
|
— |
|
|
|
1 |
|
| Cash and cash equivalents |
|
|
(159 |
) |
|
|
(166 |
) |
|
|
|
|
|
|
|
|
|
| Net debt |
|
|
1,750 |
|
|
|
1,891 |
|
|
|
|
|
|
|
|
|
|
15
Non-GAAP measures
In addition to the results reported in accordance with International Financial Reporting Standards (“IFRS”), this press release includes information
regarding certain financial measures which are not prepared in accordance with IFRS (“non-GAAP measures”). The non-GAAP measures used in this press release
are: VAR, Adjusted EBITDA, Adjusted EBITDA per metric ton, Free Cash Flow and Net debt. Reconciliations to the most directly comparable IFRS financial measures are presented in the schedules to this press release. We believe these non-GAAP measures are important supplemental measures of our operating and financial performance. By providing these measures, together with the reconciliations, we believe we are enhancing investors’
understanding of our business, our results of operations and our financial position, as well as assisting investors in evaluating the extent to which we are executing our strategic initiatives. However, these
non-GAAP financial measures supplement our IFRS disclosures and should not be considered an alternative to the IFRS measures and may not be comparable to similarly titled measures of other companies.
Value-Added Revenue (“VAR”) is defined as revenue, excluding revenue from incidental activities, minus cost of metal which includes, cost of
aluminium adjusted for metal lag, cost of other alloying metals, freight out costs, and realized gains and losses from hedging. Management believes that VAR is a useful measure of our activity as it eliminates the impact of metal costs from our
revenue and reflects the value-added elements of our activity. VAR eliminates the impact of metal price fluctuations which are not under our control and which we generally pass-through to our customers and facilitates comparisons from period to
period. VAR is not a presentation made in accordance with IFRS and should not be considered as an alternative to revenue determined in accordance with IFRS.
In considering the financial performance of the business, management and our chief operational decision maker, as defined by IFRS, analyze the primary
financial performance measure of Adjusted EBITDA in all of our business segments. The most directly comparable IFRS measure to Adjusted EBITDA is our net income or loss for the period. We believe Adjusted EBITDA, as defined below, is useful to
investors and is used by our management for measuring profitability because it excludes the impact of certain non-cash charges, such as depreciation, amortization, impairment and unrealized gains and losses on
derivatives as well as items that do not impact the day-to-day operations and that management in many cases does not directly control or influence. Therefore, such
adjustments eliminate items which have less bearing on our core operating performance.
Adjusted EBITDA measures are frequently used by securities
analysts, investors and other interested parties in their evaluation of Constellium and in comparison to other companies, many of which present an Adjusted EBITDA-related performance measure when reporting their results.
16
Adjusted EBITDA is defined as income / (loss) from continuing operations before income taxes, results from
joint ventures, net finance costs, other expenses and depreciation and amortization as adjusted to exclude restructuring costs, impairment charges, unrealized gains or losses on derivatives and on foreign exchange differences on transactions which
do not qualify for hedge accounting, metal price lag, share based compensation expense, effects of certain purchase accounting adjustments, start-up and development costs or acquisition, integration and
separation costs, certain incremental costs and other exceptional, unusual or generally non-recurring items.
Adjusted EBITDA is the measure of performance used by management in evaluating our operating performance, in preparing internal forecasts and budgets
necessary for managing our business and, specifically in relation to the exclusion of the effect of favorable or unfavorable metal price lag, this measure allows management and the investor to assess operating results and trends without the impact
of our accounting for inventories. We use the weighted average cost method in accordance with IFRS which leads to the purchase price paid for metal impacting our cost of goods sold and therefore profitability in the period subsequent to when the
related sales price impacts our revenues. Management believes this measure also provides additional information used by our lending facilities providers with respect to the ongoing performance of our underlying business activities. Historically, we
have used Adjusted EBITDA in calculating our compliance with financial covenants under certain of our loan facilities.
Adjusted EBITDA is not a
presentation made in accordance with IFRS, is not a measure of financial condition, liquidity or profitability and should not be considered as an alternative to profit or loss for the period, revenues or operating cash flows determined in accordance
with IFRS.
Free Cash Flow is defined as net cash flow from operating activities less capital expenditure, net of grants received. Management believes
that Free Cash Flow is a useful measure of the net cash flow generated or used by the business as it takes into account both the cash generated or consumed by operating activities, including working capital, and the capital expenditure requirements
of the business. However, Free Cash Flow is not a presentation made in accordance with IFRS and should not be considered as an alternative to operating cash flows determined in accordance with IFRS. Free Cash Flow has certain inherent limitations,
including the fact that it does not represent residual cash flows available for discretionary spending, notably because it does not reflect principal repayments required in connection with our debt or capital lease obligations.
Net debt is defined as borrowings plus or minus the fair value of cross currency basis swaps net of margin calls less cash and cash equivalents and cash
pledged for the issuance of guarantees. Management believes that Net debt is a useful measure of indebtedness because it takes into account the cash and cash equivalent balances held by the Company as well as the total external debt of the Company.
Net debt is not a presentation made in accordance with IFRS, and should not be considered as an alternative to borrowings determined in accordance with IFRS.
17
Exhibit 99.2
Third Quarter 2023 Earnings Call October 25, 2023
Forward-Looking Statements Certain statements contained in this presentation may constitute forward-looking statements within the
meaning of the Private Securities Litigation Reform Act of 1995. This presentation may contain “forward-looking statements” with respect to our business, results of operations and financial condition, and our expectations or beliefs
concerning future events and conditions. You can identify forward-looking statements because they contain words such as, but not limited to, “believes,” “expects,” “may,” “should,” “approximately,”
“anticipates,” “estimates,” “intends,” “plans,” “targets,” likely,” “will,” “would,” “could” and similar expressions (or the negative of these terminologies or
expressions). All forward-looking statements involve risks and uncertainties. Many risks and uncertainties are inherent in our industry and markets, while others are more specific to our business and operations. These risks and uncertainties
include, but are not limited to: market competition; economic downturn; disruption to business operations; the Russian war on Ukraine; the inability to meet customer demand and quality requirements; the loss of key customers, suppliers or other
business relationships; supply disruptions; excessive inflation; the capacity and effectiveness of our hedging policy activities; the loss of key employees; levels of indebtedness which could limit our operating flexibility and opportunities; and
other risk factors set forth under the heading “Risk Factors” in our Annual Report on Form 20-F, and as described from time to time in subsequent reports filed with the U.S. Securities and Exchange
Commission. The occurrence of the events described and the achievement of the expected results depend on many events, some or all of which are not predictable or within our control. Consequently, actual results may differ materially from the
forward-looking statements contained in this press release. We undertake no obligation to update or revise any forward-looking statement as a result of new information, future events or otherwise, except as required by law.
Non-GAAP Measures This presentation includes information regarding certain non-GAAP financial measures, including VAR, Adjusted EBITDA, Adjusted EBITDA per metric ton, Free Cash Flow and Net debt. These measures are presented because management uses this information to monitor and evaluate
financial results and trends and believes this information to also be useful for investors. Adjusted EBITDA measures are frequently used by securities analysts, investors and other interested parties in their evaluation of Constellium and in
comparison to other companies, many of which present an adjusted EBITDA-related performance measure when reporting their results. VAR, Adjusted EBITDA, Adjusted EBITDA per Metric Ton, Free Cash Flow and Net debt are not presentations made in
accordance with IFRS and may not be comparable to similarly titled measures of other companies. These non-GAAP financial measures supplement our IFRS disclosures and should not be considered an alternative to
the IFRS measures. This presentation provides a reconciliation of non-GAAP financial measures to the most directly comparable GAAP financial measures. We are not able to provide a reconciliation of Adjusted
EBITDA guidance to net income, the comparable GAAP measure, because certain items that are excluded from Adjusted EBITDA cannot be reasonably predicted or are not in our control. In particular, we are unable to forecast the timing or magnitude of
realized and unrealized gains and losses on derivative instruments, metal lag, impairment or restructuring charges, or taxes without unreasonable efforts, and these items could significantly impact, either individually or in the aggregate, our net
income in the future.
Jean-Marc Germain Chief Executive Officer

Q3 2023 Highlights Adjusted EBITDA Bridge ØSafety: YTD recordable case rate(1) of 2.1 € in millions ØShipments:
369kt (-5% YoY) ØRevenue: €1.7 billion (-15% YoY) ØValue-Added Revenue: €704 million (+5% YoY) +5% ØNet income:
€64 million ØRecord Q3 Adj. EBITDA: €168 million (+5% YoY) ØRecord Q3 Adj. EBITDA in A&T Net Debt / LTM Adjusted EBITDA ØCash from Operations: €154 million Down ØFree Cash Flow:
€78 million 0.5x ØIn addition, closed the sale of our soft alloy extrusion business in Germany for cash consideration of €48.8 million ØLeverage: 2.5x at September 30, 2023 (1) Recordable case rate measures the
number of fatalities, serious injuries, lost-time injuries, restricted work injuries, or medical treatments per one million hours worked. Strong Q3 results despite significant inflationary pressure and demand headwinds

Jack Guo Chief Financial Officer

Value-Added Revenue Bridge Q3 2023 vs. Q3 2022 € millions +5%
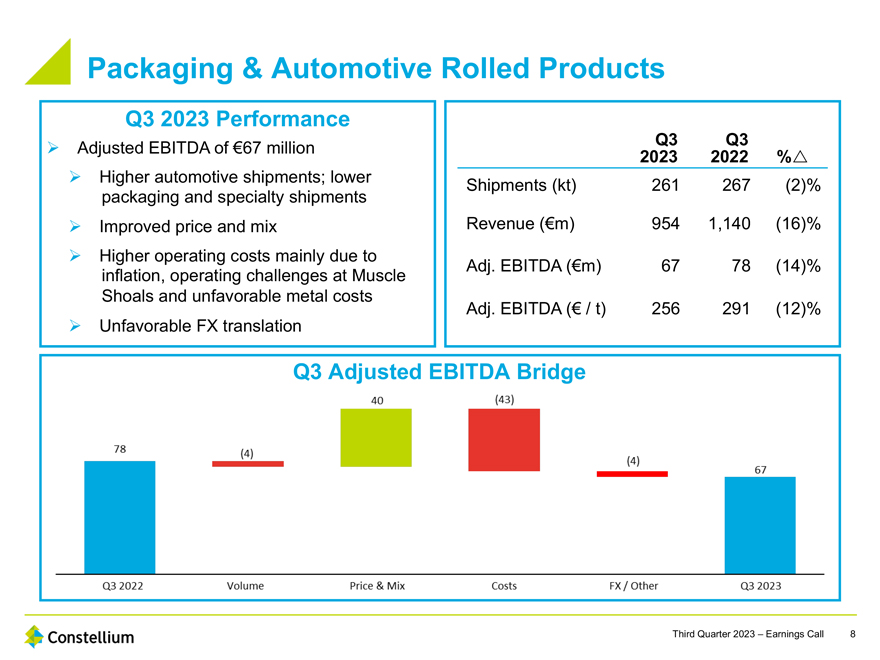
Packaging & Automotive Rolled Products Q3 2023 Performance ØAdjusted EBITDA of €67 million ØHigher
automotive shipments; lower packaging and specialty shipments ØImproved price and mix ØHigher operating costs mainly due to inflation, operating challenges at Muscle Shoals and unfavorable metal costs ØUnfavorable FX translation
Q3 Q3 2023 2022 %r Shipments (kt) 261 267 (2)% Revenue (€m) 954 1,140 (16)% Adj. EBITDA (€m) 67 78 (14)% Adj. EBITDA (€ / t) 256 291 (12)% Q3 Adjusted EBITDA Bridge
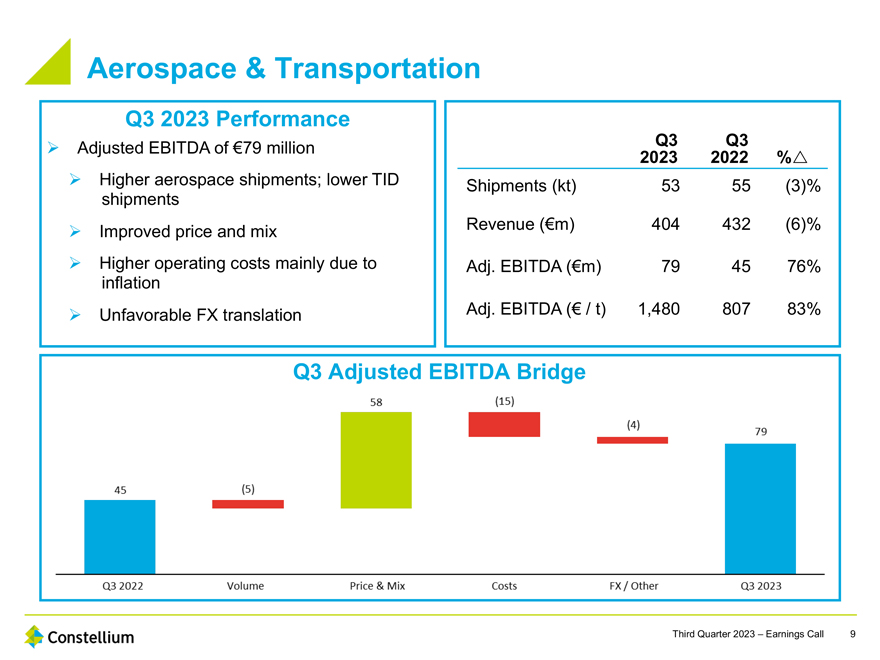
Aerospace & Transportation Q3 2023 Performance ØAdjusted EBITDA of €79 million ØHigher aerospace
shipments; lower TID shipments ØImproved price and mix ØHigher operating costs mainly due to inflation ØUnfavorable FX translation Q3 Q3 2023 2022 %r Shipments (kt) 53 55 (3)% Revenue (€m) 404 432 (6)% Adj. EBITDA (€m)
79 45 76% Adj. EBITDA (€ / t) 1,480 807 83% Q3 Adjusted EBITDA Bridge
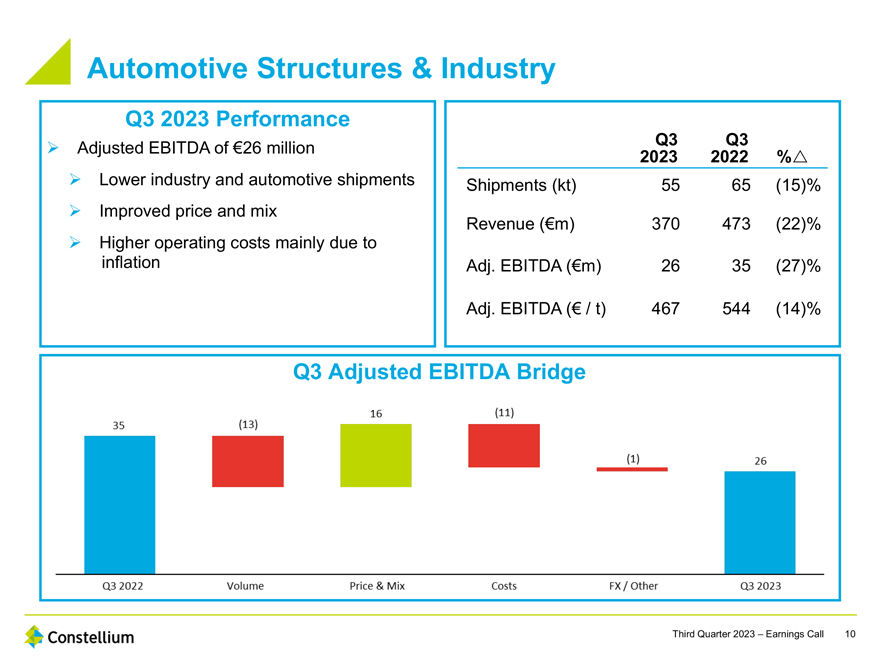
Automotive Structures & Industry Q3 2023 Performance ØAdjusted EBITDA of €26 million ØLower industry
and automotive shipments ØImproved price and mix ØHigher operating costs mainly due to inflation Q3 Q3 2023 2022 %r Shipments (kt) 55 65 (15)% Revenue (€m) 370 473 (22)% Adj. EBITDA (€m) 26 35 (27)% Adj. EBITDA (€ /
t) 467 544 (14)% Q3 Adjusted EBITDA Bridge

Managing the Current Inflationary Environment Cost Pressures and Mitigants â–ª Broad based and significant inflationary
pressures expected to continue throughout 2023 – Labor and other non-metal costs higher, particularly European energy â–ª A number of tools working to offset inflation: – Solid cost
control by businesses, including Vision ‘25 initiatives – Inflationary protections (i.e. PPI inflators) – Contracts with better pricing and better protections Addressing Inflationary Pressures YTD Adjusted EBITDA Bridge (2023 vs.
2022) € millions Inflation is significant but manageable; largely offset by improved pricing and our relentless focus on cost control

Free Cash Flow YTD 2023 Free Cash Flow Highlights ØFree Cash Flow of €112 million YTD 2023, with strong performance in
Q3 of €78 million; compared to YTD 2022: ØStronger Adjusted EBITDA ØHigher capital expenditures ØHigher cash interest YTD 2023 YTD 2022 € in millions Net cash flows from 321 323 operating activities Purchases
of property, plant and equipment, (209) (163) net of grants received Free Cash Flow 112 160 Track Record of Free Cash Flow Generation millions in € Current 2023 Expectations ØFree Cash Flow: >€150 million ØCapex:
€340-350 million ØCash interest: ~€120 million ØCash taxes: ~€30 million ØTWC/Other: modest use of cash

Net Debt and Liquidity Net Debt and Leverage € in millions Leverage: Net Debt / LTM Adjusted EBITDA Debt / Liquidity
Highlights ØLeverage at 2.5x, a multi-year low; reached the high end of leverage target ØTarget leverage range of 1.5x to 2.5x ØReduced short-term borrowings ØCompleted redemption of $50 million of 2026 bonds in July
2023 ØNo near-term bond maturities ØStrong liquidity position Maturity Profile(1) € in millions Liquidity € in millions Strong balance sheet and improved financial flexibility give us confidence to manage
varying business conditions

Jean-Marc Germain Chief Executive Officer
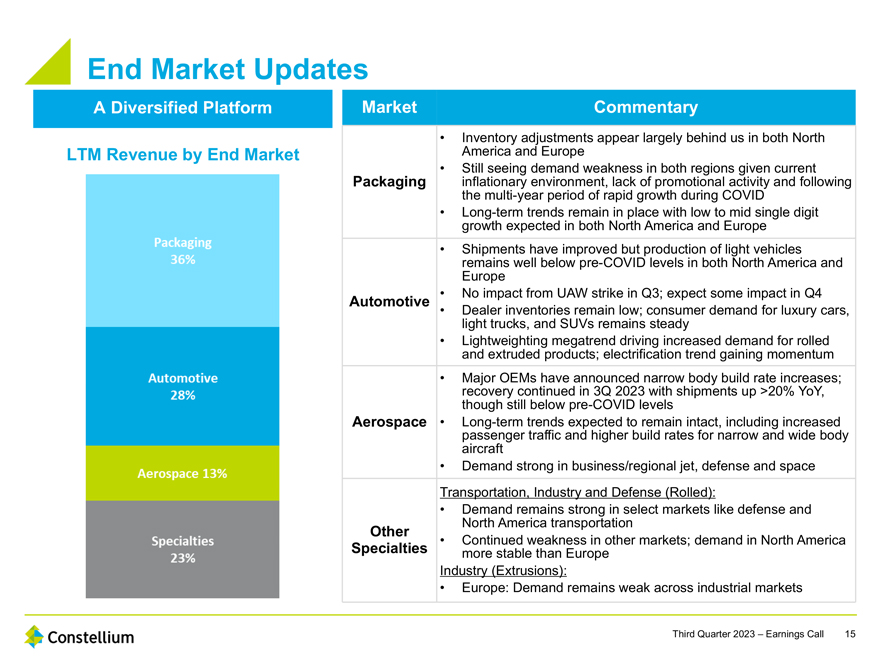
End Market Updates A Diversified Platform LTM Revenue by End Market Market Commentary • Inventory adjustments appear largely behind
us in both North America and Europe • Still seeing demand weakness in both regions given current Packaging inflationary environment, lack of promotional activity and following the multi-year period of rapid growth during COVID • Long-term
trends remain in place with low to mid single digit growth expected in both North America and Europe • Shipments have improved but production of light vehicles remains well below pre-COVID levels in both
North America and Europe • No impact from UAW strike in Q3; expect some impact in Q4 Automotive • Dealer inventories remain low; consumer demand for luxury cars, light trucks, and SUVs remains steady • Lightweighting megatrend driving
increased demand for rolled and extruded products; electrification trend gaining momentum • Major OEMs have announced narrow body build rate increases; recovery continued in 3Q 2023 with shipments up >20% YoY, though still below pre-COVID levels Aerospace • Long-term trends expected to remain intact, including increased passenger traffic and higher build rates for narrow and wide body aircraft • Demand strong in business/regional
jet, defense and space Transportation, Industry and Defense (Rolled): • Demand remains strong in select markets like defense and North America transportation Other • Continued weakness in other markets; demand in North America
Specialties more stable than Europe Industry (Extrusions): • Europe: Demand remains weak across industrial markets
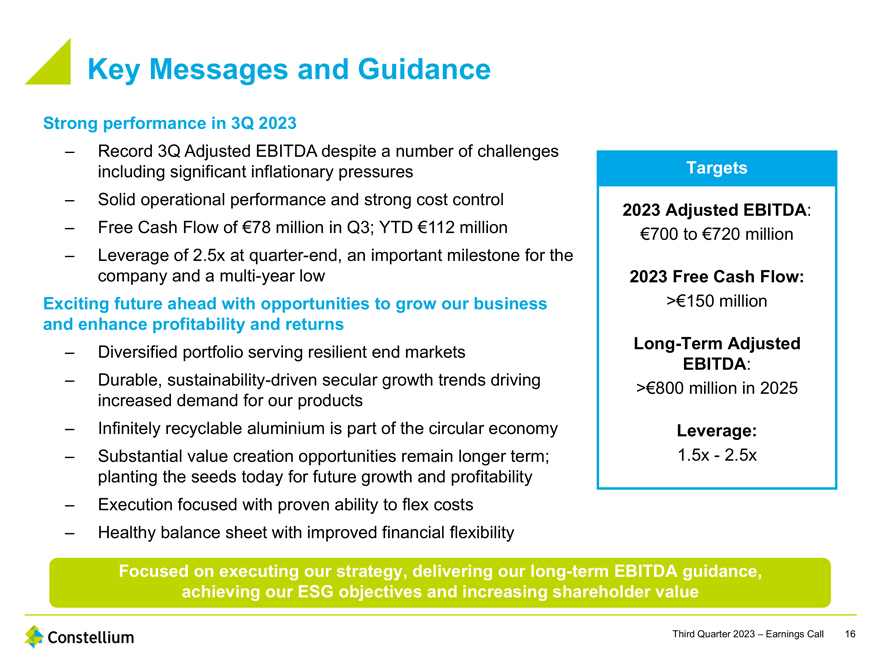
Key Messages and Guidance Strong performance in 3Q 2023 – Record 3Q Adjusted EBITDA despite a number of challenges including
significant inflationary pressures Targets – Solid operational performance and strong cost control 2023 Adjusted EBITDA: – Free Cash Flow of €78 million in Q3; YTD €112 million €700 to €720 million –
Leverage of 2.5x at quarter-end, an important milestone for the company and a multi-year low 2023 Free Cash Flow: Exciting future ahead with opportunities to grow our business >€150 million and
enhance profitability and returns Long-Term Adjusted – Diversified portfolio serving resilient end markets – Durable, sustainability-driven secular growth trends driving EBITDA: >€800 million in 2025 increased demand for our
products – Infinitely recyclable aluminium is part of the circular economy Leverage: – Substantial value creation opportunities remain longer term; 1.5x—2.5x planting the seeds today for future growth and profitability –
Execution focused with proven ability to flex costs – Healthy balance sheet with improved financial flexibility Focused on executing our strategy, delivering our long-term EBITDA guidance, achieving our ESG objectives and increasing shareholder
value
Appendix
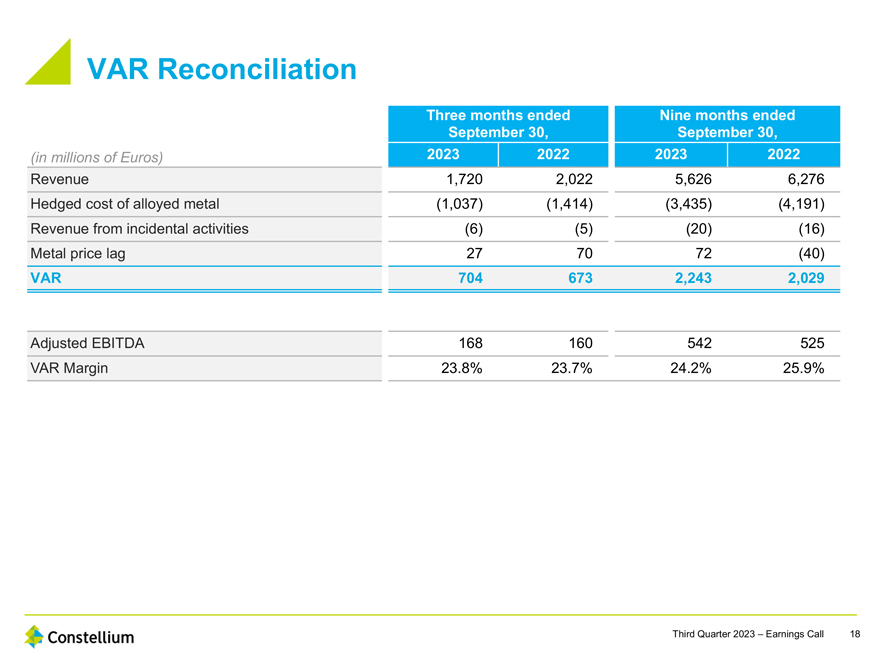
VAR Reconciliation Three months ended Nine months ended September 30, September 30, (in millions of
Euros) 2023 2022 2023 2022 Revenue 1,720 2,022 5,626 6,276 Hedged cost of alloyed metal (1,037) (1,414) (3,435) (4,191) Revenue from incidental activities (6) (5) (20) (16) Metal price lag 27 70 72 (40) VAR 704 673 2,243 2,029 Adjusted EBITDA 168
160 542 525 VAR Margin 23.8% 23.7% 24.2% 25.9%
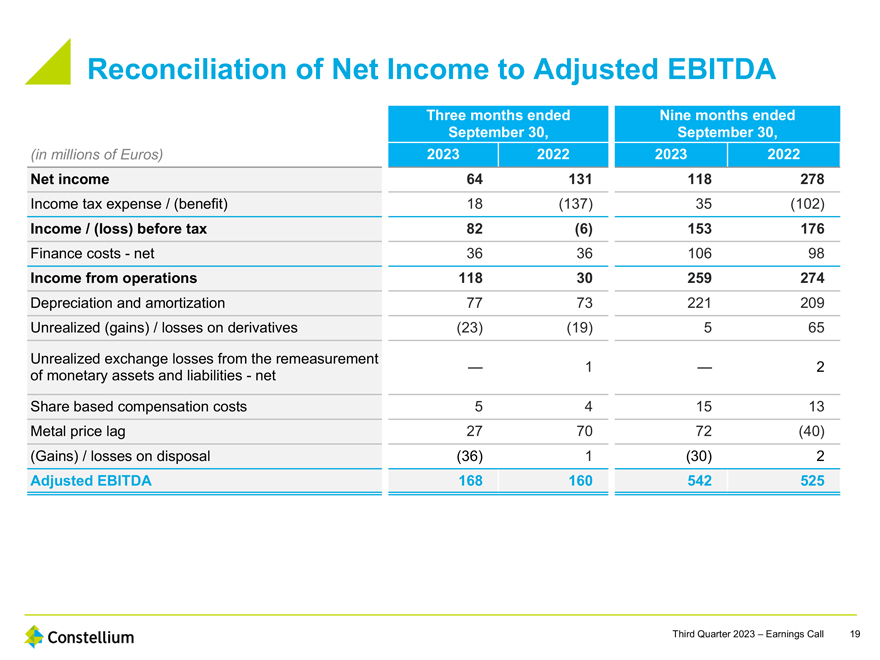
Reconciliation of Net Income to Adjusted EBITDA Three months ended Nine months ended September 30,
September 30, (in millions of Euros) 2023 2022 2023 2022 Net income 64 131 118 278 Income tax expense / (benefit) 18 (137) 35 (102) Income / (loss) before tax 82 (6) 153 176 Finance costs—net 36 36 106 98 Income from operations 118 30 259
274 Depreciation and amortization 77 73 221 209 Unrealized (gains) / losses on derivatives (23) (19) 5 65 Unrealized exchange losses from the remeasurement — 1 — 2 of monetary assets and liabilities—net Share based compensation
costs 5 4 15 13 Metal price lag 27 70 72 (40) (Gains) / losses on disposal (36) 1 (30) 2 Adjusted EBITDA 168 160 542 525

Free Cash Flow Reconciliation Three months ended Nine months ended September 30, September 30, (in
millions of Euros) 2023 2022 2023 2022 Net cash flows from operating activities 154 154 321 323 Purchases of property, plant and equipment, (76) (80) (209) (163) net of grants received Free Cash Flow 78 74 112 160 Q3 2023 Q2 2023 Q1 2023 Q4 2022 Q3
2022 Q2 2022 Q1 2022 Q4 2021 (in millions of Euros) Net cash flows from operating activities 154 133 34 128 154 111 58 118 Purchases of property, plant and equipment, (76) (65) (68) (106) (80) (51) (32) (104) net of grants received Free Cash Flow 78
68 (34) 22 74 60 26 14 Q3 2021 Q2 2021 Q1 2021 Q4 2020 Q3 2020 Q2 2020 Q1 2020 Q4 2019 (in millions of Euros) Net cash flows from operating activities 91 73 75 71 111 8 144 107 Purchases of property, plant and equipment, (51) (38) (29) (43) (36)
(41) (57) (91) net of grants received Free Cash Flow 40 35 46 28 75 (33) 87 16
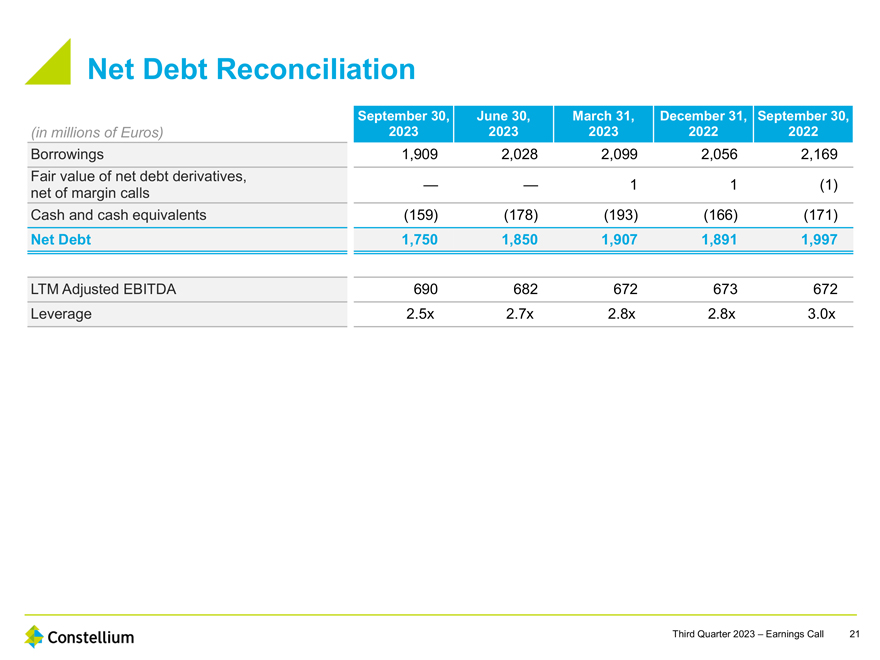
Net Debt Reconciliation September 30, June 30, March 31, December 31, September 30, (in millions of Euros) 2023
2023 2023 2022 2022 Borrowings 1,909 2,028 2,099 2,056 2,169 Fair value of net debt derivatives, — — 1 1 (1) net of margin calls Cash and cash equivalents (159) (178) (193) (166) (171) Net Debt 1,750 1,850 1,907 1,891 1,997 LTM
Adjusted EBITDA 690 682 672 673 672 Leverage 2.5x 2.7x 2.8x 2.8x 3.0x
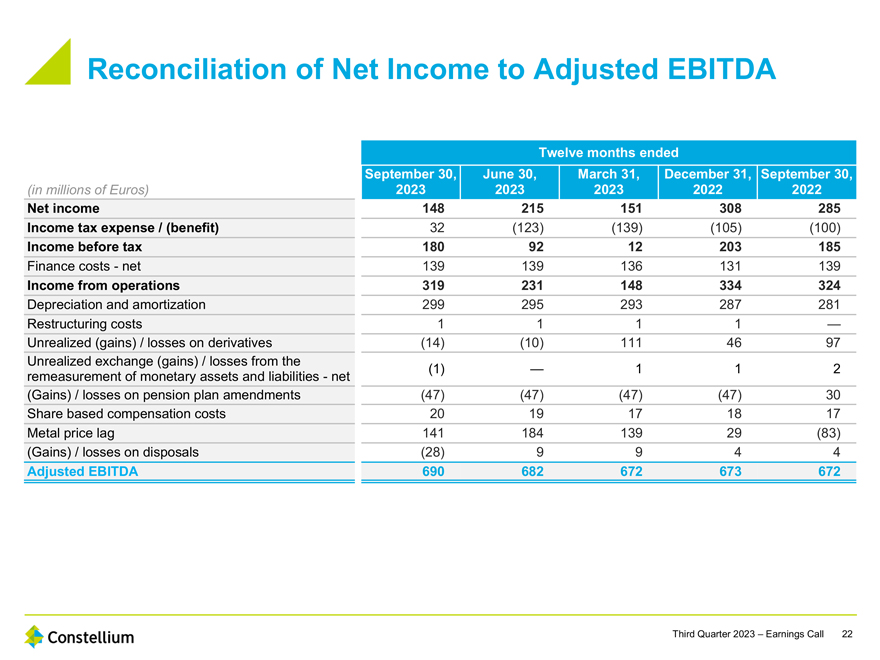
Reconciliation of Net Income to Adjusted EBITDA Twelve months ended September 30, June 30, March 31, December 31,
September 30, (in millions of Euros) 2023 2023 2023 2022 2022 Net income 148 215 151 308 285 Income tax expense / (benefit) 32 (123) (139) (105) (100) Income before tax 180 92 12 203 185 Finance costs—net 139 139 136 131 139 Income from
operations 319 231 148 334 324 Depreciation and amortization 299 295 293 287 281 Restructuring costs 1 1 1 1 — Unrealized (gains) / losses on derivatives (14) (10) 111 46 97 Unrealized exchange (gains) / losses from the (1) — 1 1 2
remeasurement of monetary assets and liabilities—net (Gains) / losses on pension plan amendments (47) (47) (47) (47) 30 Share based compensation costs 20 19 17 18 17 Metal price lag 141 184 139 29 (83) (Gains) / losses on disposals (28) 9 9 4 4
Adjusted EBITDA 690 682 672 673 672
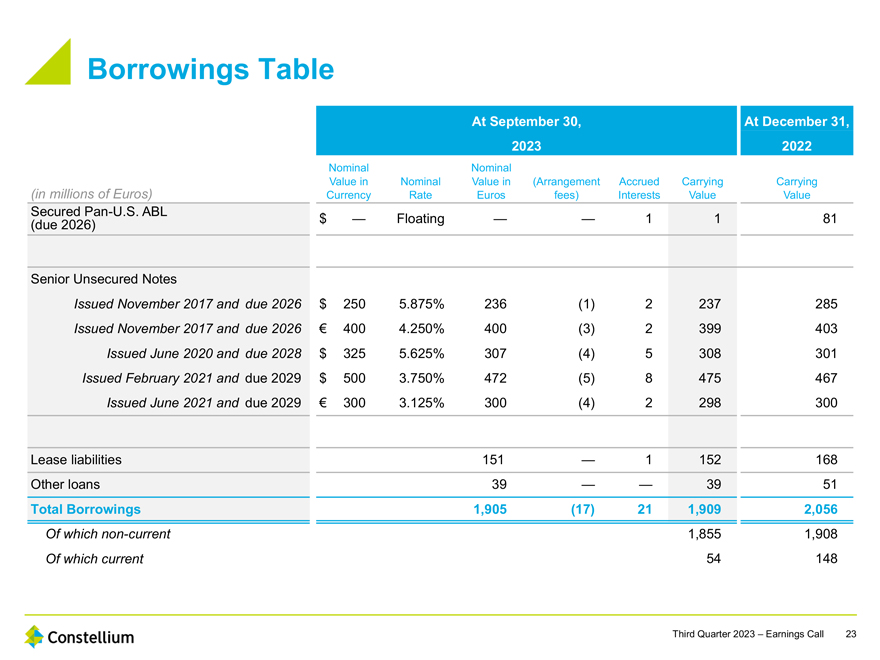
Borrowings Table At September 30, At December 31, 2023 2022 Nominal Nominal Value in Nominal Value in (Arrangement Accrued
Carrying Carrying (in millions of Euros) Currency Rate Euros fees) Interests Value Value Secured Pan-U.S. ABL $ — Floating — — 1 1 81 (due 2026) Senior Unsecured Notes Issued November 2017 and
due 2026 $ 250 5.875% 236 (1) 2 237 285 Issued November 2017 and due 2026 € 400 4.250% 400 (3) 2 399 403 Issued June 2020 and due 2028 $ 325 5.625% 307 (4) 5 308 301 Issued February 2021 and due 2029 $ 500 3.750% 472 (5) 8 475 467 Issued
June 2021 and due 2029 € 300 3.125% 300 (4) 2 298 300 Lease liabilities 151 — 1 152 168 Other loans 39 — — 39 51 Total Borrowings 1,905 (17) 21 1,909 2,056 Of which
non-current 1,855 1,908 Of which current 54 148
Constellium (NYSE:CSTM)
Historical Stock Chart
Von Mai 2024 bis Jun 2024

Constellium (NYSE:CSTM)
Historical Stock Chart
Von Jun 2023 bis Jun 2024
