São Paulo, August 14, 2023 - COSAN S.A. (B3: CSAN3; NYSE: CSAN) announces today its results for the second quarter (April, May and June) of 2023 (2Q23). The results are presented in conformity with the accounting practices adopted in Brazil and International Financial Reporting Standards (IFRS). The comparisons made in this report consider 2Q23 vs. 2Q22, except where otherwise indicated. Executive Summary Cosan pro forma¹ 2Q23 2Q22 Change 1Q23 Change 6M23 6M22 Change BRL mln (apr-jun) (apr-jun) 2Q23 x 2Q22 (jan-mar) 2Q23 x 1Q23 (jan-jun) (jan-jun) 6M23 x 6M22 Net revenue 34,498.6 42,776.9 -19.4% 37,160.4 -7.2% 71,658.9 77,496.7 -7.5% Adjusted EBITDA² 4,424.1 4,144.6 6.7% 5,363.2 -17.5% 9,787.3 6,844.7 43.0% Raízen (50%) 1,632.5 1,825.8 -10.6% 2,956.2 -44.8% 4,588.8 2,715.7 69.0% Rumo 1,447.8 1,197.9 20.9% 1,180.5 22.6% 2,628.3 2,199.9 19.5% Compass 968.2 878.0 10.3% 957.7 1.1% 1,925.9 1,580.6 21.8% Moove 302.4 232.1 30.3% 275.5 9.8% 578.0 405.5 42.5% Cosan Investimentos 174.2 104.8 66.3% 118.2 47.4% 292.4 123.2 n/a Corporate (100.7) (69.3) 45.3% (103.9) -3.0% (204.6) (151.0) 35.5% Eliminations (0.4) (24.7) -98.4% (21.1) -98.1% (21.5) (29.1) -26.2% Investments³ 2,385.9 2,027.4 17.7% 3,657.9 -34.8% 6,043.9 4,643.2 30.2% Leverage4 2.0x 2.4x -0.4x 1.7x 0.3x 2.0x 2.4x -0.4x Cosan Corporate 5 Adjusted net income (loss)² 145.2 (178.6) n/a (686.5) n/a (541.3) 340.2 n/a Net debt 13,854.0 12,611.8 9.8% 12,553.9 10.4% 13,854.0 12,611.8 9.8% Dividends and interest on equity received6 229.9 128.6 78.8% 672.5 -65.8% 902.4 647.2 39.4% Managerial cash flow 4,519.4 1,408.1 n/a (397.5) n/a 4,121.9 988.1 n/a Notes: (1) Considers the consolidation of 50% of the results of Raízen S.A. and of 100% of the other operations. (2) Adjusted EBITDA and Net Income exclude non-recurring effects, as detailed on page 17 of this report. (3) Pro forma investments accounted for on a cash basis and excluding M&A; (4) Pro forma Net Debt/EBITDA in the last 12 months (LTM), adjusted by lease liabilities (IFRS 16); (5) Cosan Corporate includes the holding company Cosan S.A., offshore financial companies, intermediary holding companies with interests in subsidiaries and other investments, as detailed on page 3. (6) Considering the amount net of taxes and other shareholders received at Cosan Corporate. Cosan’s business portfolio delivered yet another quarter of strong operational performance, reaching pro forma adjusted EBITDA of R$4.4 billion, increasing 7% versus 2Q22. At Raízen, the highlight was the acceleration in crushing and the significant gains in agricultural yields, despite the adverse effects from losses in fuel inventories. At Rumo, the result was driven by the higher transported volumes and increase in consolidated average tariff, reflecting the competitiveness of the rail mode. At Compass, the richer mix due to growth in the residential and commercial segments offset the lower industrial volume in the quarter. Growth at Moove was leveraged by the greater volume and better mix of products sold in all markets. At Cosan Investimentos, which the main investment is the Land segment, the portfolio’s appreciation, combined with higher revenue from leases, contributed positively to the result. This solid improvement in our businesses performance is due to the disciplined execution of our long-term strategy, which is yielding a sustainable combination of organic growth and acquisitions. Accordingly, the higher investments (+18%), in line with the plan for the year, are being allocated to efficient maintenance of operations and to key projects ensuring the next cycle of portfolio expansion. Meanwhile, the group’s pro forma leverage ratio fell to 2.0x compared to 2.4x in 2Q22, reflecting the higher EBITDA in the last 12 months. At Cosan Corporate, adjusted net income was R$145 million, supported by performance of our businesses, as well as the mark-to-market adjustment of the Total Return Swap (TRS) of the Company’s shares, which appreciated 18%, and the Perpetual Notes, due to the stronger Real. As explained throughout this report, it is important to remember that Cosan Corporate’s results do not include the effects from Cosan’s interest in Vale. Cosan Corporate’s net debt ended the quarter at R$13.8 billion (+10%), with the highlight of the issuances carried out in the local and international markets to optimize the capital structure and guarantee competitive funding for investments in its portfolio. These liability management transactions include two debenture issues of R$1 billion each, as well as the 2030 Bonds, which marked the first issue of Senior Notes by high-yield Brazilian companies after more than a year with no activity in this market, and raised USD 550 million at a very competitive cost considering the swaps for CDI. As a result, managerial cash flow generation was R$4.5 billion, supported by the new funding transactions and by the dividends received in the period.
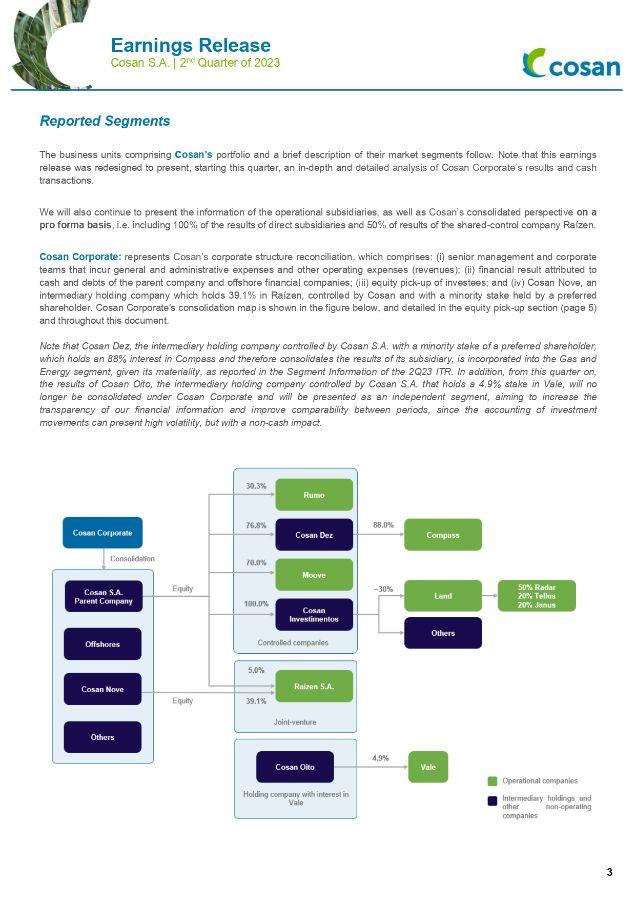
Reported Segments The business units comprising Cosan’s portfolio and a brief description of their market segments follow. Note that this earnings release was redesigned to present, starting this quarter, an in-depth and detailed analysis of Cosan Corporate’s results and cash transactions. We will also continue to present the information of the operational subsidiaries, as well as Cosan’s consolidated perspective on a pro forma basis, i.e. including 100% of the results of direct subsidiaries and 50% of results of the shared-control company Raízen. Cosan Corporate: represents Cosan’s corporate structure reconciliation, which comprises: (i) senior management and corporate teams that incur general and administrative expenses and other operating expenses (revenues); (ii) financial result attributed to cash and debts of the parent company and offshore financial companies; (iii) equity pick-up of investees; and (iv) Cosan Nove, an intermediary holding company which holds 39.1% in Raízen, controlled by Cosan and with a minority stake held by a preferred shareholder. Cosan Corporate's consolidation map is shown in the figure below, and detailed in the equity pick-up section (page 5) and throughout this document. Note that Cosan Dez, the intermediary holding company controlled by Cosan S.A. with a minority stake of a preferred shareholder, which holds an 88% interest in Compass and therefore consolidates the results of its subsidiary, is incorporated into the Gas and Energy segment, given its materiality, as reported in the Segment Information of the 2Q23 ITR. In addition, from this quarter on, the results of Cosan Oito, the intermediary holding company controlled by Cosan S.A. that holds a 4.9% stake in Vale, will no longer be consolidated under Cosan Corporate and will be presented as an independent segment, aiming to increase the transparency of our financial information and improve comparability between periods, since the accounting of investment movements can present high volatility, but with a non-cash impact.
Business Portfolio: Raízen: A joint venture created by Cosan and Shell in 2011. With an integrated and unique ecosystem, Raízen operates from the production and processing of sugarcane to the production and marketing of sugar and renewable energy, including even the distribution of fuels and operations in the convenience and proximity store segment. Since August 2021, Raízen’s shares are listed on the São Paulo Stock Exchange (B3) under the ticker "RAIZ4." The Renewables business comprises the production, sourcing, marketing and trading of ethanol; production and marketing of bioenergy; resale and trading of electricity; and production and marketing of other renewable products (solar power and biogas). Meanwhile, the Sugar business involves the production, sourcing, marketing and trading of sugar. The Mobility segment encompasses the distribution of fuel and lubricants and the convenience and proximity store operations in Brazil, Argentina and Paraguay, under the Shell brand. In Brazil, we operate in the proximity segment under the brands Shell Select and OXXO, in partnership with FEMSA Comércio, through the JV Nós Group. In Argentina, the segment also includes oil refining. The Financial Statements and Earnings Release of Raízen are available at: ri.raizen.com.br. Rumo: Brazil’s largest independent rail logistics operator, connecting the country’s main agricultural commodity producing regions to the country’s main ports. It also operates in port loading and goods storage at terminals. Through Brado, Rumo also offers container operations serving both the domestic and international markets. Rumo has been listed under the ticker "RAIL3" since 2015 on the Novo Mercado, the listing segment of the São Paulo Stock Exchange (B3) with the highest corporate governance standards. The Financial Statements and Earnings Release of Rumo are available at: ri.rumolog.com. Compass: Based on all the experienced amassed in the management of Comgás, Compass was created in 2020 with the purpose of creating options for an increasingly less regulated natural gas market. It offers client-centered services and solutions to expand access to natural gas safely, efficiently and competitively, which contributes to energy safety, economic development and expansion of Brazil’s infrastructure. In the natural gas distribution segment, Compass has Comgás, Brazil’s largest piped gas distributor, and Commit, which holds interests in 11 concessionaires in various Brazilian states, including Sulgás and Gasbrasiliano. Compass’ portfolio also includes projects in the Natural Gas and Energy sectors, such as the São Paulo LNG Regasification Terminal (TRSP). The Financial Statements and Earnings Release of Compass are available at: compassbr.com. Moove: Moove produces and distributes products under the Mobil and Comma brands, with operations in Brazil and other countries in South America (Argentina, Bolivia, Uruguay, and Paraguay), as well as in the United States and Europe (United Kingdom, Spain, Portugal, and France). It markets lubricants and other products for applications in the automotive and industrial segments, and is an importer and distributor of base oils in the Brazilian market. Cosan Investimentos: Cosan’s company for new businesses and innovation, with investments in projects adjacent to its current portfolio. The following assets are part of Cosan Investimentos’ current portfolio: Land – segment of agricultural land management companies, with interest held in Radar, Tellus and Janus; the Port of São Luís, in Maranhão; and investments in the Climate Tech Fund and Ventures SPV, both managed by Fifth Wall, one of the largest venture capital firms specializing in technological innovation. Cosan Oito: Cosan’s vehicle for investing in interest in Vale S.A., a Brazilian company that operates in 20 countries in the segments of mining, logistics (e.g., rail, ports, terminals, and infrastructure), energy and steel. It includes shares acquired in the spot market (direct interest), financial derivative instruments (collar and call spread) and debts contracted. For more information, refer to Note 1.1 to the Quarterly Financial Statements of 2Q23.
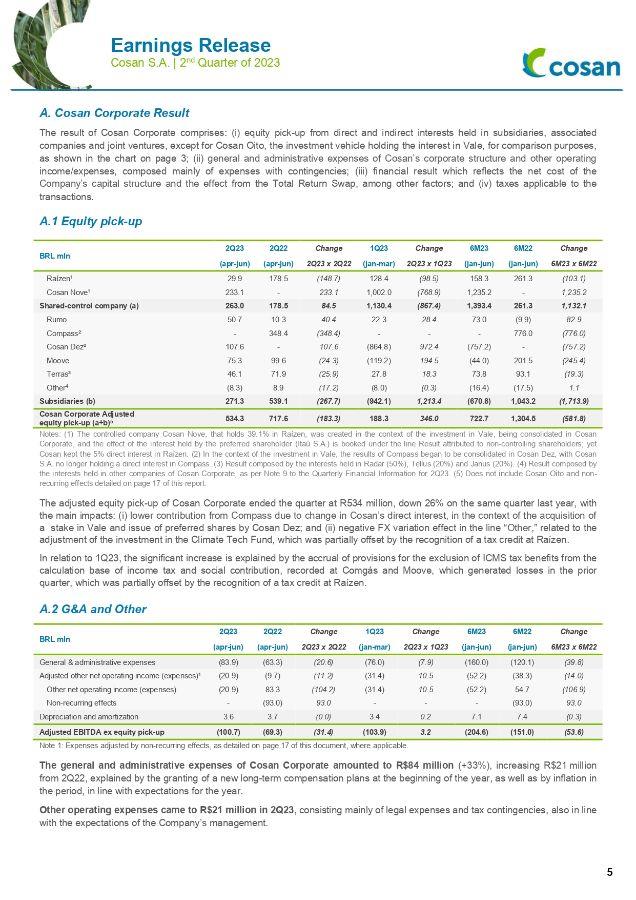
A. Cosan Corporate Result The result of Cosan Corporate comprises: (i) equity pick-up from direct and indirect interests held in subsidiaries, associated companies and joint ventures, except for Cosan Oito, the investment vehicle holding the interest in Vale, for comparison purposes, as shown in the chart on page 3; (ii) general and administrative expenses of Cosan’s corporate structure and other operating income/expenses, composed mainly of expenses with contingencies; (iii) financial result which reflects the net cost of the Company’s capital structure and the effect from the Total Return Swap, among other factors; and (iv) taxes applicable to the transactions. A.1 Equity pick-up BRL mln 2Q23 2Q22 Change 1Q23 Change 6M23 6M22 Change (apr-jun) (apr-jun) 2Q23 x 2Q22 (jan-mar) 2Q23 x 1Q23 (jan-jun) (jan-jun) 6M23 x 6M22 Raízen¹ 29.9 178.5 (148.7) 128.4 (98.5) 158.3 261.3 (103.1) Cosan Nove¹ 233.1 - 233.1 1,002.0 (768.9) 1,235.2 - 1,235.2 Shared-control company (a) 263.0 178.5 84.5 1,130.4 (867.4) 1,393.4 261.3 1,132.1 Rumo 50.7 10.3 40.4 22.3 28.4 73.0 (9.9) 82.9 Compass² - 348.4 (348.4) - - - 776.0 (776.0) Cosan Dez² 107.6 - 107.6 (864.8) 972.4 (757.2) - (757.2) Moove 75.3 99.6 (24.3) (119.2) 194.5 (44.0) 201.5 (245.4) Terras³ 46.1 71.9 (25.9) 27.8 18.3 73.8 93.1 (19.3) Other4 (8.3) 8.9 (17.2) (8.0) (0.3) (16.4) (17.5) 1.1 Subsidiaries (b) 271.3 539.1 (267.7) (942.1) 1,213.4 (670.8) 1,043.2 (1,713.9) Cosan Corporate Adjusted equity pick-up (a+b)5 534.3 717.6 (183.3) 188.3 346.0 722.7 1,304.5 (581.8) Notes: (1) The controlled company Cosan Nove, that holds 39.1% in Raízen, was created in the context of the investment in Vale, being consolidated in Cosan Corporate, and the effect of the interest held by the preferred shareholder (Itaú S.A.) is booked under the line Result attributed to non-controlling shareholders; yet Cosan kept the 5% direct interest in Raízen. (2) In the context of the investment in Vale, the results of Compass began to be consolidated in Cosan Dez, with Cosan S.A. no longer holding a direct interest in Compass. (3) Result composed by the interests held in Radar (50%), Tellus (20%) and Janus (20%). (4) Result composed by the interests held in other companies of Cosan Corporate, as per Note 9 to the Quarterly Financial Information for 2Q23. (5) Does not include Cosan Oito and non-recurring effects detailed on page 17 of this report. The adjusted equity pick-up of Cosan Corporate ended the quarter at R534 million, down 26% on the same quarter last year, with the main impacts: (i) lower contribution from Compass due to change in Cosan’s direct interest, in the context of the acquisition of a stake in Vale and issue of preferred shares by Cosan Dez; and (ii) negative FX variation effect in the line “Other,” related to the adjustment of the investment in the Climate Tech Fund, which was partially offset by the recognition of a tax credit at Raízen. In relation to 1Q23, the significant increase is explained by the accrual of provisions for the exclusion of ICMS tax benefits from the calculation base of income tax and social contribution, recorded at Comgás and Moove, which generated losses in the prior quarter, which was partially offset by the recognition of a tax credit at Raízen. A.2 G&A and Other BRL mln 2Q23 2Q22 Change 1Q23 Change 6M23 6M22 Change (apr-jun) (apr-jun) 2Q23 x 2Q22 (jan-mar) 2Q23 x 1Q23 (jan-jun) (jan-jun) 6M23 x 6M22 General & administrative expenses (83.9) (63.3) (20.6) (76.0) (7.9) (160.0) (120.1) (39.8) Adjusted other net operating income (expenses)¹ (20.9) (9.7) (11.2) (31.4) 10.5 (52.2) (38.3) (14.0) Other net operating income (expenses) (20.9) 83.3 (104.2) (31.4) 10.5 (52.2) 54.7 (106.9) Non-recurring effects - (93.0) 93.0 - - - (93.0) 93.0 Depreciation and amortization 3.6 3.7 (0.0) 3.4 0.2 7.1 7.4 (0.3) Adjusted EBITDA ex equity pick-up (100.7) (69.3) (31.4) (103.9) 3.2 (204.6) (151.0) (53.6) Note 1: Expenses adjusted by non-recurring effects, as detailed on page 17 of this document, where applicable. The general and administrative expenses of Cosan Corporate amounted to R$84 million (+33%), increasing R$21 million from 2Q22, explained by the granting of a new long-term compensation plans at the beginning of the year, as well as by inflation in the period, in line with expectations for the year. Other operating expenses came to R$21 million in 2Q23, consisting mainly of legal expenses and tax contingencies, also in line with the expectations of the Company’s management.
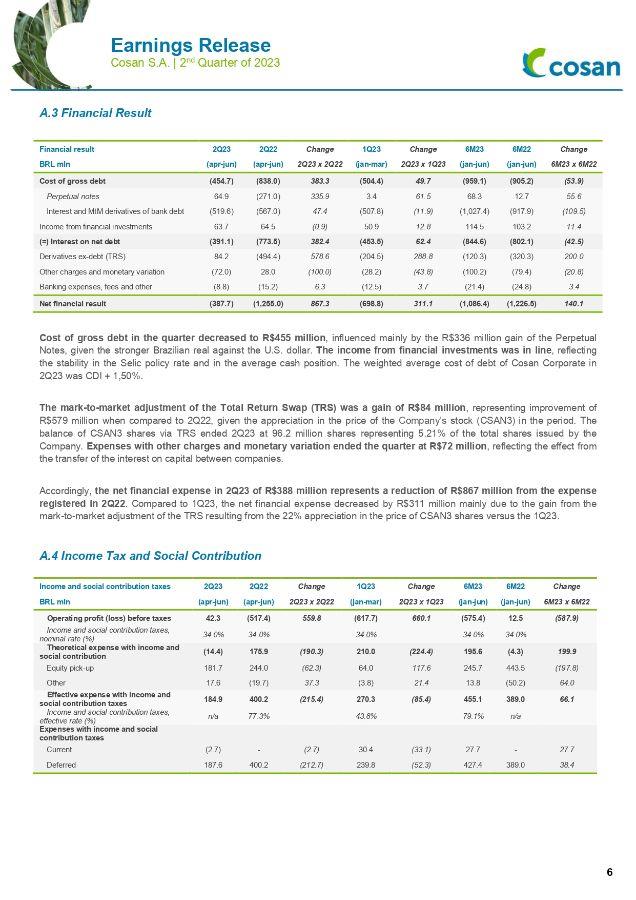
A.3 Financial Result Financial result 2Q23 2Q22 Change 1Q23 Change 6M23 6M22 Change BRL mln (apr-jun) (apr-jun) 2Q23 x 2Q22 (jan-mar) 2Q23 x 1Q23 (jan-jun) (jan-jun) 6M23 x 6M22 Cost of gross debt (454.7) (838.0) 383.3 (504.4) 49.7 (959.1) (905.2) (53.9) Perpetual notes 64.9 (271.0) 335.9 3.4 61.5 68.3 12.7 55.6 Interest and MtM derivatives of bank debt (519.6) (567.0) 47.4 (507.8) (11.9) (1,027.4) (917.9) (109.5) Income from financial investments 63.7 64.5 (0.9) 50.9 12.8 114.5 103.2 11.4 (=) Interest on net debt (391.1) (773.5) 382.4 (453.5) 62.4 (844.6) (802.1) (42.5) Derivatives ex-debt (TRS) 84.2 (494.4) 578.6 (204.5) 288.8 (120.3) (320.3) 200.0 Other charges and monetary variation (72.0) 28.0 (100.0) (28.2) (43.8) (100.2) (79.4) (20.8) Banking expenses, fees and other (8.8) (15.2) 6.3 (12.5) 3.7 (21.4) (24.8) 3.4 Net financial result (387.7) (1,255.0) 867.3 (698.8) 311.1 (1,086.4) (1,226.5) 140.1 Cost of gross debt in the quarter decreased to R$455 million, influenced mainly by the R$336 million gain of the Perpetual Notes, given the stronger Brazilian real against the U.S. dollar. The income from financial investments was in line, reflecting the stability in the Selic policy rate and in the average cash position. The weighted average cost of debt of Cosan Corporate in 2Q23 was CDI + 1,50%. The mark-to-market adjustment of the Total Return Swap (TRS) was a gain of R$84 million, representing improvement of R$579 million when compared to 2Q22, given the appreciation in the price of the Company’s stock (CSAN3) in the period. The balance of CSAN3 shares via TRS ended 2Q23 at 96.2 million shares representing 5.21% of the total shares issued by the Company. Expenses with other charges and monetary variation ended the quarter at R$72 million, reflecting the effect from the transfer of the interest on capital between companies. Accordingly, the net financial expense in 2Q23 of R$388 million represents a reduction of R$867 million from the expense registered in 2Q22. Compared to 1Q23, the net financial expense decreased by R$311 million mainly due to the gain from the mark-to-market adjustment of the TRS resulting from the 22% appreciation in the price of CSAN3 shares versus the 1Q23. A.4 Income Tax and Social Contribution Income and social contribution taxes 2Q23 2Q22 Change 1Q23 Change 6M23 6M22 Change BRL mln (apr-jun) (apr-jun) 2Q23 x 2Q22 (jan-mar) 2Q23 x 1Q23 (jan-jun) (jan-jun) 6M23 x 6M22 Operating profit (loss) before taxes 42.3 (517.4) 559.8 (617.7) 660.1 (575.4) 12.5 (587.9) Income and social contribution taxes, nominal rate (%) 34.0% 34.0% 34.0% 34.0% 34.0% Theoretical expense with income and social contribution (14.4) 175.9 (190.3) 210.0 (224.4) 195.6 (4.3) 199.9 Equity pick-up 181.7 244.0 (62.3) 64.0 117.6 245.7 443.5 (197.8) Other 17.6 (19.7) 37.3 (3.8) 21.4 13.8 (50.2) 64.0 Effective expense with income and social contribution taxes 184.9 400.2 (215.4) 270.3 (85.4) 455.1 389.0 66.1 Income and social contribution taxes, effective rate (%) n/a 77.3% 43.8% 79.1% n/a Expenses with income and social contribution taxes Current (2.7) - (2.7) 30.4 (33.1) 27.7 - 27.7 Deferred 187.6 400.2 (212.7) 239.8 (52.3) 427.4 389.0 38.4
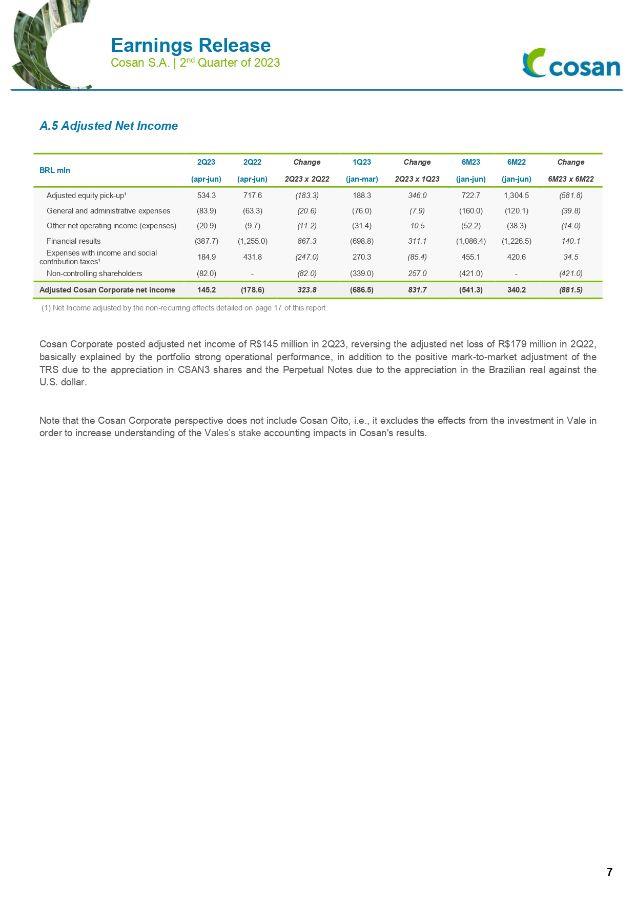
A.5 Adjusted Net Income BRL mln 2Q23 2Q22 Change 1Q23 Change 6M23 6M22 Change (apr-jun) (apr-jun) 2Q23 x 2Q22 (jan-mar) 2Q23 x 1Q23 (jan-jun) (jan-jun) 6M23 x 6M22 Adjusted equity pick-up¹ 534.3 717.6 (183.3) 188.3 346.0 722.7 1,304.5 (581.8) General and administrative expenses (83.9) (63.3) (20.6) (76.0) (7.9) (160.0) (120.1) (39.8) Other net operating income (expenses) (20.9) (9.7) (11.2) (31.4) 10.5 (52.2) (38.3) (14.0) Financial results (387.7) (1,255.0) 867.3 (698.8) 311.1 (1,086.4) (1,226.5) 140.1 Expenses with income and social contribution taxes¹ 184.9 431.8 (247.0) 270.3 (85.4) 455.1 420.6 34.5 Non-controlling shareholders (82.0) - (82.0) (339.0) 257.0 (421.0) - (421.0) Adjusted Cosan Corporate net income 145.2 (178.6) 323.8 (686.5) 831.7 (541.3) 340.2 (881.5) (1) Net Income adjusted by the non-recurring effects detailed on page 17 of this report. Cosan Corporate posted adjusted net income of R$145 million in 2Q23, reversing the adjusted net loss of R$179 million in 2Q22, basically explained by the portfolio strong operational performance, in addition to the positive mark-to-market adjustment of the TRS due to the appreciation in CSAN3 shares and the Perpetual Notes due to the appreciation in the Brazilian real against the U.S. dollar. Note that the Cosan Corporate perspective does not include Cosan Oito, i.e., it excludes the effects from the investment in Vale in order to increase understanding of the Vales’s stake accounting impacts in Cosan's results.
B. Cosan Oito – Investment in Vale To ensure the transparency of recognitions and a normalized comparison basis, we present below a description of the effects of the acquisition of the interest in Vale on Cosan’s result, as well as pro forma consolidated EBITDA and Net Income excluding such adjustments: • Other net operating income (expenses): dividends and IOC received from Vale by Cosan Oito (4,9% stake); • Financial Result: • Update of financial investment on listed entities: Mark-to-market adjustment of the direct participation (1.5%) and the collar participation (3.4%) shares; • MtM adjustment of derivatives: Fair value adjustment of derivatives linked to the collar participation (3,4%) and call spread (1.6%); and • Debt interest: interest on 4131 loans (accrual) including NDFs and swaps related; and • Derivative expense banks: transfer to the banks participating in the transaction of a fraction of the dividends received from Vale due to the collar structure. • Income Tax: impact referring to the changes in result listed above, except for dividends that are not taxable. BRL mln 2Q23 1Q23 Change 6M23 (apr-jun) (jan-mar) 2Q23 x 1Q23 (jan-jun) VALE3 quotation (BRL) 64.22 80.29 -20.0% 64.22 Other net operating income (expenses) - 402.8 n/a 402.8 Total EBITDA adjustments (a) (0.0) 402.8 n/a 402.8 Financial investment update on listed entities (3,464.2) (1,804.9) 91.9% (5,269.2) Direct participation (1.5%) (1,059.7) (552.1) 91.9% (1,611.9) Collar participation (3.4%) (2,404.5) (1,252.8) 91.9% (3,657.3) Derivatives MtM 2,353.0 1,407.8 67.1% 3,760.8 Collar participation (3.4%) 2,570.7 1,477.5 74.0% 4,048.2 Call spread (1.6%) (217.7) (69.7) n/a (287.4) Interest of bank debt¹ (671.9) (310.7) n/a (982.6) Derivative expense banks - (215.3) n/a (215.3) Net financial result (b) (1,783.2) (923.1) 93.2% (2,706.3) Income tax and social contribution (c) 606.3 313.9 93.1% 920.1 Total Net income adjustments (a+b+c) (1,176.9) (206.4) n/a (1,383.3) (1) Includes the swap of fixed rate to floating rate of 4131 loans. With the 20% devaluation of VALE3 shares in the period, the market to market effect held via direct participation (1.5%) was negative by R$ 1.1 billion. In the collar participation, the share loss value was mitigated by the appreciation of the derivative, achieving the initial objective of protecting part of Cosan's stake against potential volatility in Vale's share price. Finally, the net effect of the call spread was marginally negative. In the quarter, the net value investment impact in Cosan was R$1.2 billion, very close to the direct stake, demonstrating the effectiveness of the structure. Financial rescue value of preferred shares To enable a better understanding of the full Vale investment transaction, as from this quarter we are reporting the updated financial value of a potential rescue of the Cosan Nove and Cosan Dez preferred shares investment, in case it was carried out. This amount is calculated based on the initial values that totals R$8.1 billion adjusted by the average rate of CDI + 1.25%, less the dividends received by non-controlling shareholders, as shown below (for more information, see Note 1.1 Equity interest in Vale of the 2Q23 ITR). Preferred shares may be redeemed after the third year, at Cosan's discretion. BRL mln Initial financial rescue value of preferred shares Update Dividends paid Updated financial rescue value Cosan Nove 4,115.0 274.1 (123.0) 4,266.1 Cosan Dez 4,000.0 290.4 - 4,290.4 Total 8,115.0 564.5 (123.0) 8,556.5
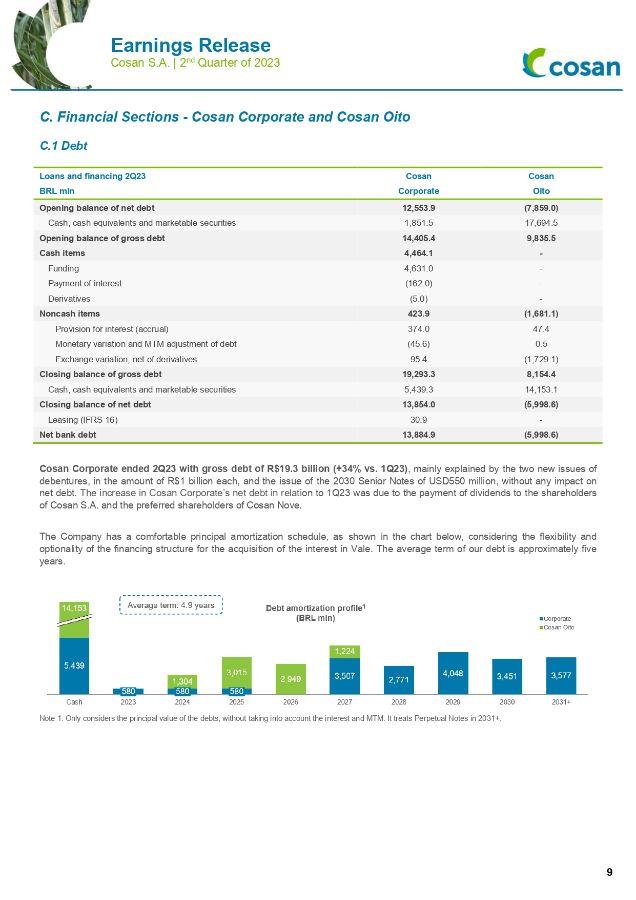
C. Financial Sections - Cosan Corporate and Cosan Oito C.1 Debt Loans and financing 2Q23 Cosan Cosan BRL mln Corporate Oito Opening balance of net debt 12,553.9 (7,859.0) Cash, cash equivalents and marketable securities 1,851.5 17,694.5 Opening balance of gross debt 14,405.4 9,835.5 Cash items 4,464.1 - Funding 4,631.0 - Payment of interest (162.0) - Derivatives (5.0) - Noncash items 423.9 (1,681.1) Provision for interest (accrual) 374.0 47.4 Monetary variation and MTM adjustment of debt (45.6) 0.5 Exchange variation, net of derivatives 95.4 (1,729.1) Closing balance of gross debt 19,293.3 8,154.4 Cash, cash equivalents and marketable securities 5,439.3 14,153.1 Closing balance of net debt 13,854.0 (5,998.6) Leasing (IFRS 16) 30.9 - Net bank debt 13,884.9 (5,998.6) Cosan Corporate ended 2Q23 with gross debt of R$19.3 billion (+34% vs. 1Q23), mainly explained by the two new issues of debentures, in the amount of R$1 billion each, and the issue of the 2030 Senior Notes of USD550 million, without any impact on net debt. The increase in Cosan Corporate’s net debt in relation to 1Q23 was due to the payment of dividends to the shareholders of Cosan S.A. and the preferred shareholders of Cosan Nove. The Company has a comfortable principal amortization schedule, as shown in the chart below, considering the flexibility and optionality of the financing structure for the acquisition of the interest in Vale. The average term of our debt is approximately five years. Note 1: Only considers the principal value of the debts, without taking into account the interest and MTM. It treats Perpetual Notes in 2031+.
C.1.1 Pro Forma Leverage Pro forma Leverage 2Q23 2Q22 Change 1Q23 Change BRL mln (apr-jun) (apr-jun) 2Q23 x 2Q22 (jan-mar) 2Q23 x 1Q23 Gross debt (a) 73,413.8 57,730.8 27.2% 67,323.5 9.0% Cosan Corporate 19,293.3 15,087.4 27.9% 14,405.7 33.9% Cosan Oito (Vale) 8,154.4 - n/a 9,835.2 -17.1% Debts 4131¹ 8,608.5 - n/a 9,180.7 -6.2% MTM Derivatives (454.0) - n/a 654.6 n/a Business 45,966.0 42,643.4 7.8% 43,082.6 6.7% Cash, cash equivalents and marketable securities (b) 35,484.9 19,518.7 81.8% 36,804.3 -3.6% Cosan Corporate 5,439.3 2,475.6 n/a 1,851.5 n/a Cash, cash equivalents and marketable securities 5,439.3 2,475.6 n/a 1,851.5 n/a Cosan Oito (Vale) 14,153.1 - n/a 17,694.5 -20.0% Cash, cash equivalents and marketable securities 1.1 - n/a 1.3 -14.3% Marketable securities - Vale 14,151.9 - n/a 17,693.2 -20.0% Business 15,892.5 17,043.1 -6.8% 17,258.3 -7.9% Net debt for leverage² (c = a - b) 37,928.9 38,212.1 -0.7% 30,519.2 24.3% EBITDA LTM³ (d) 20,763.8 17,506.7 18.6% 20,237.3 2.6% Effect of lease liabilities (IFRS16) (e) (2,069.0) (1,883.2) 9.9% (2,138.3) -3.2% EBITDA LTM (ex-IFRS16) (f = d + e) 18,694.8 15,623.5 19.7% 18,098.9 3.3% Pro forma Leverage (g = c / f) 2.0x 2.4x n/a 1.7x n/a Note 1: Considering the updated amount of debt, net of derivatives. Note 2: Pro forma net debt, i.e., includes 50% of Raízen’s results and excludes lease liabilities (IFRS16). Note 3: Pro forma EBITDA in the last 12 months (LTM), i.e., including 50% of Raízen before any non-recurring adjustments. The proforma leverage ratio (net debt/EBITDA LTM) was 2.0x in 2Q23 vs. 2.4x in 2Q22 and 1.7x in 1Q23. The reduction in the annual comparison was due to the higher EBITDA in the last twelve months, evidencing the portfolio strong operational performance. The increase in relation to the previous quarter was due to the balance of marketable securities, reflecting the depreciation of the price of Vale stock (non-cash) and by the increase in Raízen's net debt due to seasonal effects at the beginning of the crop year, such as building up inventories, which lead to an increase in operating cash consumption. Note that despite the increase in 2Q23 vs. 1Q23, the leverage ratio remains at an adequate level for the group. Excluding the effects of Cosan Oito (Vale) pro forma leverage would be 2.4x in 2Q23.
C.2 Statement of Cash Flow – Cosan Corporate Cash flow statement Cosan Corporate Cosan Oito 2Q23 2Q22 Change 6M23 6M22 Change 2Q23 2Q22 BRL mln (apr-jun) (apr-jun) 2Q23 x 2Q22 (jan-jun) (jan-jun) 6M23 x 6M22 (apr-jun) (apr-jun) Dividends and interest on equity received6 229.9 128.6 101.3 902.4 647.2 255.2 - 457.4 Asset sales 15.0 - 15.0 15.0 - 15.0 - - Funding 4,647.5 1,494.1 3,153.4 4,647.5 1,494.1 3,153.4 - - Operational cash flow¹ (79.0) 15.9 (94.9) (294.2) (37.3) (256.9) (0.2) (12.8) CAPEX (1.6) (0.3) (1.4) (2.7) (0.9) (1.8) - - Interest Payment (164.2) (53.3) (110.9) (723.5) (652.8) (70.6) - - Derivatives (5.0) (176.9) 171.9 (299.7) (462.2) 162.5 - (247.2) Preferred Dividends (123.0) - (123.0) (123.0) - (123.0) - (247.2) Managerial Cash Flow generation (consumption) 4,519.4 1,408.1 3,111.3 4,121.9 988.1 3,133.8 (0.2) (49.6) Dividends paid (798.2) (799.3) 1.1 (798.2) (799.3) 1.1 - (203.5) Acquisitions - (5.5) 5.5 - (416.7) 416.7 - - Capital payment - - - (4.0) - (4.0) - 4.0 Cash Flow generation (consumption) before other effect 3,721.2 603.3 3,117.9 3,319.6 (228.0) 3,547.6 (0.2) (249.2) Other cash effects² (133.3) 50.7 (184.1) (110.7) (288.0) 177.3 - 247.2 Free Cash Flow generation (consumption) 3,587.8 654.0 2,933.8 3,208.9 (516.0) 3,724.9 (0.2) (2.0) Initial cash and equivalents 1,851.5 1,821.5 29.9 2,230.4 2,991.5 (761.2) 17,694.5 19,589.3 Cash generation (consumption) 3,587.8 654.0 2,933.8 3,208.9 (516.0) 3,724.9 (0.2) (2.0) Final cash and equivalents 5,439.3 2,475.6 2,963.8 5,439.3 2,475.6 2,963.8 14,153.1 14,153.1 Note 1: Operational cash flow composed of operating expenses, working capital variation, tax payments, among others; (2) primarily composed of offshore cash flow exchange rate variation. As from this quarter, we will present Cosan Corporate’s direct cash. In this new format, it is possible to analyze the main cash impacts and have greater clarity of the holding’s cash inflows and outflows. The Managerial Cash Flow Generation (Consumption) reflects the balance of sources and uses movements before capital allocation decisions. The main movement of 2Q23 in this line was the issue of the three new debt instruments, mentioned in the previous section, in addition to the first dividends payment to the preferred shareholders of Cosan Nove, in the amount of R$123 million. Lastly, as a capital allocation decision, we had the distribution of R$798 million in dividends to Cosan’s shareholders, ending the 2Q23 with R$ 3.6 billion Net Cash Flow Generation at Cosan Corporate. C.3 Dividends The table below shows a reconciliation of the dividends and interest on equity, on a cash basis, received by Cosan Corporate, detailed by subsidiary, as well as the dividends paid by Cosan to its shareholders. Dividends and interest on equity received/paid 2Q23 2Q22 Change 2Q23 LTM 2Q22 LTM Change Dividends receivable 2Q23 BRL mln (apr-jun) (apr-jun) 2Q23 x 2Q22 (jul-jun) (jul-jun) Dividends received 266.9 21.1 n/a 3,239.7 1,664.9 94.6% 365.1 Raízen - 0.2 n/a 955.7 1,001.8 -4.6% - Cosan Dez - - n/a 1,386.9 635.8 n/a 11.7 Cosan Oito - - n/a 203.5 - n/a 124.2 Rumo 37.1 - n/a 37.1 - n/a - Moove 172.3 20.9 n/a 419.4 27.3 n/a - Land 57.5 - n/a 237.1 - n/a 229.2 Interest on equity received (37.0) 107.5 n/a 39.9 332.8 -88.0% - Raízen - 107.5 n/a - 280.4 n/a - Compass¹ (37.0) - n/a 39.9 52.4 -23.9% - Total dividends and interest on equity received 229.9 128.6 78.8% 3,279.6 1,997.7 64.2% 365.1 Total dividends and Interest on equity paid (921.2) (799.3) 15.3% (921.2) (1,782.3) -48.3% - Shareholders Cosan S.A. (798.2) (799.3) -0.1% (798.2) (1,499.3) -46.8% - For preferred shareholders of CIP - - n/a - (283.0) n/a - For preferred shareholders of Cosan Nove (123.0) - n/a (123.0) - n/a - Notes: (1) Effect from the transfer of interest on equity received directly at Cosan S.A. in 1Q23 to Cosan Dez in 2Q23.
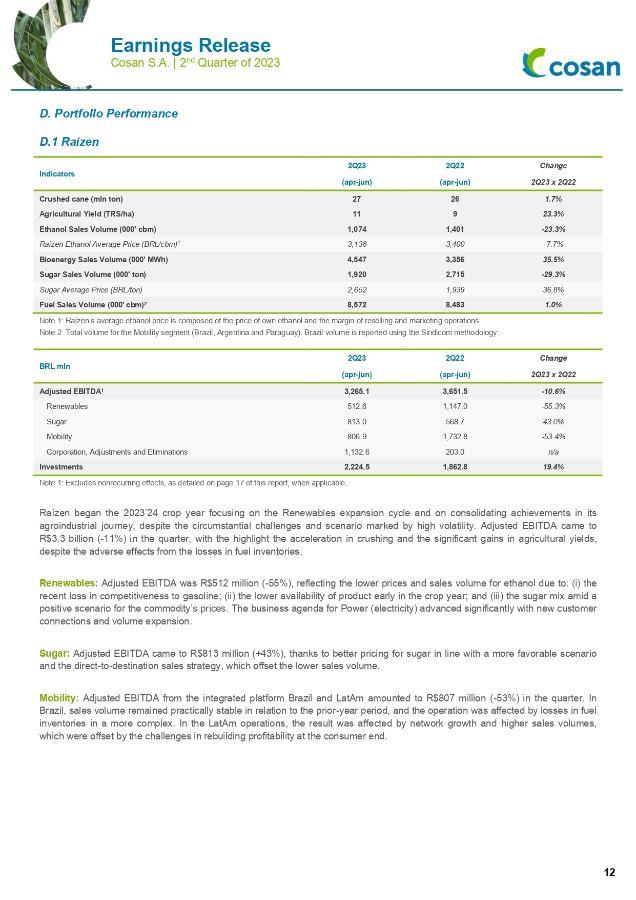
D. Portfolio Performance D.1 Raízen Indicators 2Q23 2Q22 Change (apr-jun) (apr-jun) 2Q23 x 2Q22 Crushed cane (mln ton) 27 26 1.7% Agricultural Yield (TRS/ha) 11 9 23.3% Ethanol Sales Volume (000' cbm) 1,074 1,401 -23.3% Raízen Ethanol Average Price (BRL/cbm)1 3,138 3,400 -7.7% Bioenergy Sales Volume (000' MWh) 4,547 3,356 35.5% Sugar Sales Volume (000' ton) 1,920 2,715 -29.3% Sugar Average Price (BRL/ton) 2,652 1,939 36.8% Fuel Sales Volume (000' cbm)2 8,572 8,483 1.0% Note 1: Raízen’s average ethanol price is composed of the price of own ethanol and the margin of reselling and marketing operations. Note 2: Total volume for the Mobility segment (Brazil, Argentina and Paraguay). Brazil volume is reported using the Sindicom methodology. BRL mln 2Q23 2Q22 Change (apr-jun) (apr-jun) 2Q23 x 2Q22 Adjusted EBITDA1 3,265.1 3,651.5 -10.6% Renewables 512.6 1,147.0 -55.3% Sugar 813.0 568.7 43.0% Mobility 806.9 1,732.8 -53.4% Corporation, Adjustments and Eliminations 1,132.6 203.0 n/a Investments 2,224.5 1,862.8 19.4% Note 1: Excludes nonrecurring effects, as detailed on page 17 of this report, when applicable. Raízen began the 2023’24 crop year focusing on the Renewables expansion cycle and on consolidating achievements in its agroindustrial journey, despite the circumstantial challenges and scenario marked by high volatility. Adjusted EBITDA came to R$3.3 billion (-11%) in the quarter, with the highlight the acceleration in crushing and the significant gains in agricultural yields, despite the adverse effects from the losses in fuel inventories. Renewables: Adjusted EBITDA was R$512 million (-55%), reflecting the lower prices and sales volume for ethanol due to: (i) the recent loss in competitiveness to gasoline; (ii) the lower availability of product early in the crop year; and (iii) the sugar mix amid a positive scenario for the commodity’s prices. The business agenda for Power (electricity) advanced significantly with new customer connections and volume expansion. Sugar: Adjusted EBITDA came to R$813 million (+43%), thanks to better pricing for sugar in line with a more favorable scenario and the direct-to-destination sales strategy, which offset the lower sales volume. Mobility: Adjusted EBITDA from the integrated platform Brazil and LatAm amounted to R$807 million (-53%) in the quarter. In Brazil, sales volume remained practically stable in relation to the prior-year period, and the operation was affected by losses in fuel inventories in a more complex. In the LatAm operations, the result was affected by network growth and higher sales volumes, which were offset by the challenges in rebuilding profitability at the consumer end.
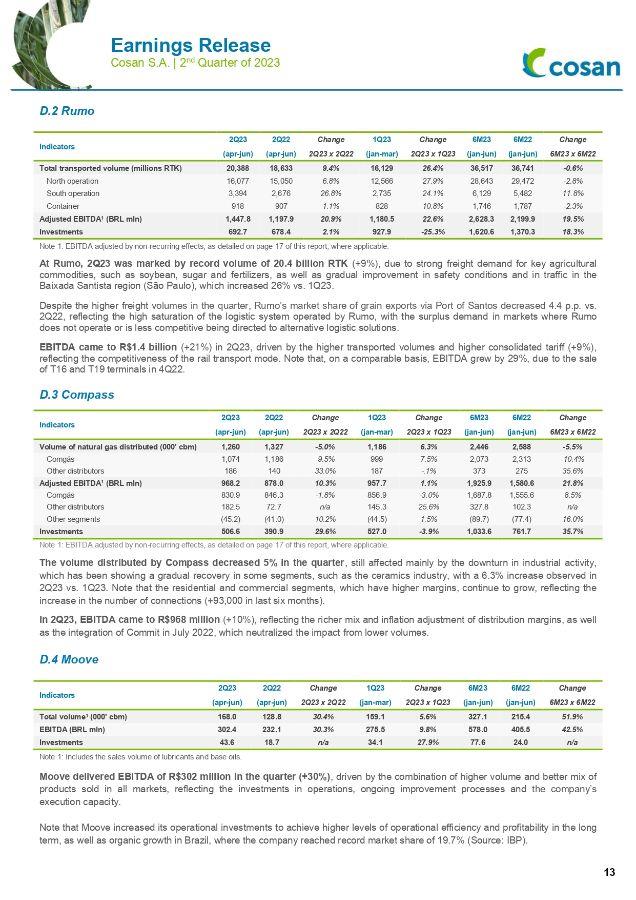
D.2 Rumo Indicators 2Q23 2Q22 Change 1Q23 Change 6M23 6M22 Change (apr-jun) (apr-jun) 2Q23 x 2Q22 (jan-mar) 2Q23 x 1Q23 (jan-jun) (jan-jun) 6M23 x 6M22 Total transported volume (millions RTK) 20,388 18,633 9.4% 16,129 26.4% 36,517 36,741 -0.6% North operation 16,077 15,050 6.8% 12,566 27.9% 28,643 29,472 -2.8% South operation 3,394 2,676 26.8% 2,735 24.1% 6,129 5,482 11.8% Container 918 907 1.1% 828 10.8% 1,746 1,787 -2.3% Adjusted EBITDA1 (BRL mln) 1,447.8 1,197.9 20.9% 1,180.5 22.6% 2,628.3 2,199.9 19.5% Investments 692.7 678.4 2.1% 927.9 -25.3% 1,620.6 1,370.3 18.3% Note 1: EBITDA adjusted by non-recurring effects, as detailed on page 17 of this report, where applicable. At Rumo, 2Q23 was marked by record volume of 20.4 billion RTK (+9%), due to strong freight demand for key agricultural commodities, such as soybean, sugar and fertilizers, as well as gradual improvement in safety conditions and in traffic in the Baixada Santista region (São Paulo), which increased 26% vs. 1Q23. Despite the higher freight volumes in the quarter, Rumo’s market share of grain exports via Port of Santos decreased 4.4 p.p. vs. 2Q22, reflecting the high saturation of the logistic system operated by Rumo, with the surplus demand in markets where Rumo does not operate or is less competitive being directed to alternative logistic solutions. EBITDA came to R$1.4 billion (+21%) in 2Q23, driven by the higher transported volumes and higher consolidated tariff (+9%), reflecting the competitiveness of the rail transport mode. Note that, on a comparable basis, EBITDA grew by 29%, due to the sale of T16 and T19 terminals in 4Q22. D.3 Compass Indicators 2Q23 2Q22 Change 1Q23 Change 6M23 6M22 Change (apr-jun) (apr-jun) 2Q23 x 2Q22 (jan-mar) 2Q23 x 1Q23 (jan-jun) (jan-jun) 6M23 x 6M22 Volume of natural gas distributed (000' cbm) 1,260 1,327 -5.0% 1,186 6.3% 2,446 2,588 -5.5% Comgás 1,074 1,186 -9.5% 999 7.5% 2,073 2,313 -10.4% Other distributors 186 140 33.0% 187 -.1% 373 275 35.6% Adjusted EBITDA1 (BRL mln) 968.2 878.0 10.3% 957.7 1.1% 1,925.9 1,580.6 21.8% Comgás 830.9 846.3 -1.8% 856.9 -3.0% 1,687.8 1,555.6 8.5% Other distributors 182.5 72.7 n/a 145.3 25.6% 327.8 102.3 n/a Other segments (45.2) (41.0) 10.2% (44.5) 1.5% (89.7) (77.4) 16.0% Investments 506.6 390.9 29.6% 527.0 -3.9% 1,033.6 761.7 35.7% Note 1: EBITDA adjusted by non-recurring effects, as detailed on page 17 of this report, where applicable. The volume distributed by Compass decreased 5% in the quarter, still affected mainly by the downturn in industrial activity, which has been showing a gradual recovery in some segments, such as the ceramics industry, with a 6.3% increase observed in 2Q23 vs. 1Q23. Note that the residential and commercial segments, which have higher margins, continue to grow, reflecting the increase in the number of connections (+93,000 in last six months). In 2Q23, EBITDA came to R$968 million (+10%), reflecting the richer mix and inflation adjustment of distribution margins, as well as the integration of Commit in July 2022, which neutralized the impact from lower volumes. D.4 Moove Indicators 2Q23 2Q22 Change 1Q23 Change 6M23 6M22 Change (apr-jun) (apr-jun) 2Q23 x 2Q22 (jan-mar) 2Q23 x 1Q23 (jan-jun) (jan-jun) 6M23 x 6M22 Total volume1 (000' cbm) 168.0 128.8 30.4% 159.1 5.6% 327.1 215.4 51.9% EBITDA (BRL mln) 302.4 232.1 30.3% 275.5 9.8% 578.0 405.5 42.5% Investments 43.6 18.7 n/a 34.1 27.9% 77.6 24.0 n/a Note 1: Includes the sales volume of lubricants and base oils. Moove delivered EBITDA of R$302 million in the quarter (+30%), driven by the combination of higher volume and better mix of products sold in all markets, reflecting the investments in operations, ongoing improvement processes and the company’s execution capacity. Note that Moove increased its operational investments to achieve higher levels of operational efficiency and profitability in the long term, as well as organic growth in Brazil, where the company reached record market share of 19.7% (Source: IBP).
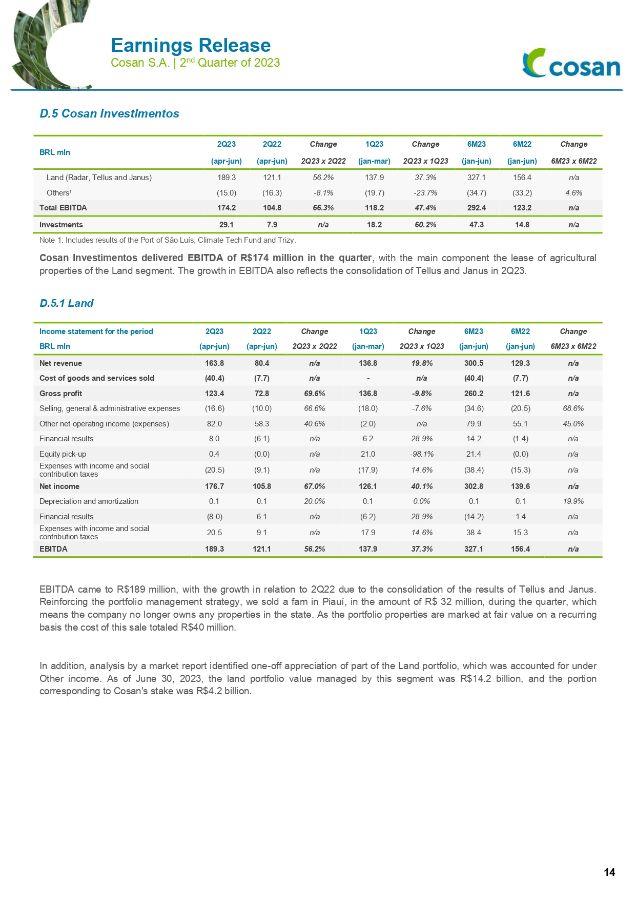
D.5 Cosan Investimentos BRL mln 2Q23 2Q22 Change 1Q23 Change 6M23 6M22 Change (apr-jun) (apr-jun) 2Q23 x 2Q22 (jan-mar) 2Q23 x 1Q23 (jan-jun) (jan-jun) 6M23 x 6M22 Land (Radar, Tellus and Janus) 189.3 121.1 56.2% 137.9 37.3% 327.1 156.4 n/a Others1 (15.0) (16.3) -8.1% (19.7) -23.7% (34.7) (33.2) 4.6% Total EBITDA 174.2 104.8 66.3% 118.2 47.4% 292.4 123.2 n/a Investments 29.1 7.9 n/a 18.2 60.2% 47.3 14.8 n/a Note 1: Includes results of the Port of São Luís, Climate Tech Fund and Trizy. Cosan Investimentos delivered EBITDA of R$174 million in the quarter, with the main component the lease of agricultural properties of the Land segment. The growth in EBITDA also reflects the consolidation of Tellus and Janus in 2Q23. D.5.1 Land Income statement for the period 2Q23 2Q22 Change 1Q23 Change 6M23 6M22 Change BRL mln (apr-jun) (apr-jun) 2Q23 x 2Q22 (jan-mar) 2Q23 x 1Q23 (jan-jun) (jan-jun) 6M23 x 6M22 Net revenue 163.8 80.4 n/a 136.8 19.8% 300.5 129.3 n/a Cost of goods and services sold (40.4) (7.7) n/a - n/a (40.4) (7.7) n/a Gross profit 123.4 72.8 69.6% 136.8 -9.8% 260.2 121.6 n/a Selling, general & administrative expenses (16.6) (10.0) 66.6% (18.0) -7.6% (34.6) (20.5) 68.6% Other net operating income (expenses) 82.0 58.3 40.6% (2.0) n/a 79.9 55.1 45.0% Financial results 8.0 (6.1) n/a 6.2 28.9% 14.2 (1.4) n/a Equity pick-up 0.4 (0.0) n/a 21.0 -98.1% 21.4 (0.0) n/a Expenses with income and social contribution taxes (20.5) (9.1) n/a (17.9) 14.6% (38.4) (15.3) n/a Net income 176.7 105.8 67.0% 126.1 40.1% 302.8 139.6 n/a Depreciation and amortization 0.1 0.1 20.0% 0.1 0.0% 0.1 0.1 19.9% Financial results (8.0) 6.1 n/a (6.2) 28.9% (14.2) 1.4 n/a Expenses with income and social contribution taxes 20.5 9.1 n/a 17.9 14.6% 38.4 15.3 n/a EBITDA 189.3 121.1 56.2% 137.9 37.3% 327.1 156.4 n/a EBITDA came to R$189 million, with the growth in relation to 2Q22 due to the consolidation of the results of Tellus and Janus. Reinforcing the portfolio management strategy, we sold a fam in Piauí, in the amount of R$ 32 million, during the quarter, which means the company no longer owns any properties in the state. As the portfolio properties are marked at fair value on a recurring basis the cost of this sale totaled R$40 million. In addition, analysis by a market report identified one-off appreciation of part of the Land portfolio, which was accounted for under Other income. As of June 30, 2023, the land portfolio value managed by this segment was R$14.2 billion, and the portion corresponding to Cosan's stake was R$4.2 billion.
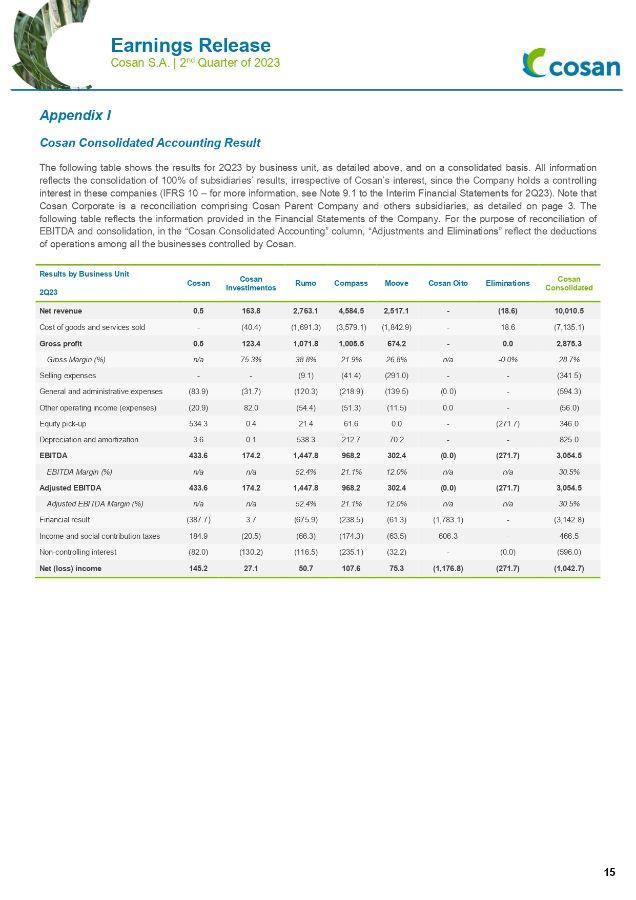
Appendix I Cosan Consolidated Accounting Result The following table shows the results for 2Q23 by business unit, as detailed above, and on a consolidated basis. All information reflects the consolidation of 100% of subsidiaries’ results, irrespective of Cosan’s interest, since the Company holds a controlling interest in these companies (IFRS 10 – for more information, see Note 9.1 to the Interim Financial Statements for 2Q23). Note that Cosan Corporate is a reconciliation comprising Cosan Parent Company and others subsidiaries, as detailed on page 3. The following table reflects the information provided in the Financial Statements of the Company. For the purpose of reconciliation of EBITDA and consolidation, in the “Cosan Consolidated Accounting” column, “Adjustments and Eliminations” reflect the deductions of operations among all the businesses controlled by Cosan. Results by Business Unit Cosan Cosan Investimentos Rumo Compass Moove Cosan Oito Eliminations Cosan Consolidated 2Q23 Net revenue 0.5 163.8 2,763.1 4,584.5 2,517.1 - (18.6) 10,010.5 Cost of goods and services sold - (40.4) (1,691.3) (3,579.1) (1,842.9) - 18.6 (7,135.1) Gross profit 0.5 123.4 1,071.8 1,005.5 674.2 - 0.0 2,875.3 Gross Margin (%) n/a 75.3% 38.8% 21.9% 26.8% n/a -0.0% 28.7% Selling expenses - - (9.1) (41.4) (291.0) - - (341.5) General and administrative expenses (83.9) (31.7) (120.3) (218.9) (139.5) (0.0) - (594.3) Other operating income (expenses) (20.9) 82.0 (54.4) (51.3) (11.5) 0.0 - (56.0) Equity pick-up 534.3 0.4 21.4 61.6 0.0 - (271.7) 346.0 Depreciation and amortization 3.6 0.1 538.3 212.7 70.2 - - 825.0 EBITDA 433.6 174.2 1,447.8 968.2 302.4 (0.0) (271.7) 3,054.5 EBITDA Margin (%) n/a n/a 52.4% 21.1% 12.0% n/a n/a 30.5% Adjusted EBITDA 433.6 174.2 1,447.8 968.2 302.4 (0.0) (271.7) 3,054.5 Adjusted EBITDA Margin (%) n/a n/a 52.4% 21.1% 12.0% n/a n/a 30.5% Financial result (387.7) 3.7 (675.9) (238.5) (61.3) (1,783.1) - (3,142.8) Income and social contribution taxes 184.9 (20.5) (66.3) (174.3) (63.5) 606.3 - 466.5 Non-controlling interest (82.0) (130.2) (116.5) (235.1) (32.2) - (0.0) (596.0) Net (loss) income 145.2 27.1 50.7 107.6 75.3 (1,176.8) (271.7) (1,042.7)
Cosan Consolidated Pro Forma Result To provide a better analysis of the operational and financial performance of Cosan’s business portfolio, we present consolidated financial information on a pro forma basis, i.e., including 100% of the results of direct subsidiaries, as explained above, and 50% of results of the shared-control company Raízen. The pro forma information is presented for clarification purposes only and should not be interpreted as a representation of the accounting results. Results by Business Unit Cosan Consolidated Raízen 50% Raízen Eliminations Consolidated Pro forma 2Q23 Net revenue 10,010.5 48,806.0 (24,403.0) 85.2 34,498.6 Cost of goods and services sold (7,135.1) (46,046.8) 23,023.4 (85.2) (30,243.7) Gross profit 2,875.3 2,759.2 (1,379.6) 0.0 4,254.9 Gross Margin (%) 28.7% 5.7% 5.7% .0% 12.3% Selling expenses (341.5) (1,325.0) 662.5 - (1,004.0) General and administrative expenses (594.3) (703.8) 351.9 - (946.2) Other operating income (expenses) (56.0) 1,617.0 (808.5) - 752.5 Equity pick-up 346.0 (79.1) 39.6 (263.0) 43.5 Depreciation and amortization 825.0 1,848.8 (924.4) - 1,749.4 EBITDA 3,054.5 4,117.0 (2,058.5) (263.0) 4,850.0 EBITDA Margin (%) 30.5% 8.4% 8.4% n/a 14.1% Adjusted EBITDA 3,054.5 3,265.1 (1,632.5) (263.0) 4,424.1 Adjusted EBITDA Margin (%) 30.5% 6.7% 6.7% n/a 12.8% Financial result (3,142.8) (1,375.8) 687.9 - (3,830.7) Income and social contribution taxes 466.5 (263.6) 131.8 - 334.7 Non-controlling interest (596.0) (33.4) 16.7 (34.7) (647.3) Net (loss) income (1,042.7) 595.4 (297.7) (297.7) (1,042.7) Results by Business Unit Cosan Consolidated Raízen 50% Raízen Eliminations Consolidated Pro forma 6M23 Net revenue 19,641.8 103,757.2 (51,878.6) 138.6 71,658.9 Cost of goods and services sold (14,267.6) (94,053.1) 47,026.5 (138.6) (61,432.7) Gross profit 5,374.1 9,704.1 (4,852.1) - 10,226.2 Gross Margin (%) 27.4% 9.4% 9.4% - 14.3% Selling expenses (681.2) (2,587.5) 1,293.8 - (1,975.0) General and administrative expenses (1,144.1) (1,546.2) 773.1 - (1,917.1) Other operating income (expenses) 305.8 2,106.3 (1,053.2) - 1,359.0 Equity pick-up 1,529.4 (112.9) 56.5 (1,393.4) 79.5 Depreciation and amortization 1,610.2 3,367.6 (1,683.8) - 3,294.0 EBITDA 6,994.3 10,931.4 (5,465.7) (1,393.4) 11,066.6 EBITDA Margin (%) 35.6% 10.5% 10.5% n/a 15.4% Adjusted EBITDA 6,591.7 9,177.9 (4,588.9) (1,393.4) 9,787.3 Adjusted EBITDA Margin (%) 33.6% 8.8% 8.8% n/a 13.7% Financial result (5,911.9) (2,739.2) 1,369.6 - (7,281.5) Income and social contribution taxes (337.7) (1,568.7) 784.3 - (1,122.0) Non-controlling interest (1,081.4) (101.3) 50.6 (183.9) (1,315.9) Net (loss) income (1,946.8) 3,154.6 (1,577.3) (1,577.3) (1,946.8)
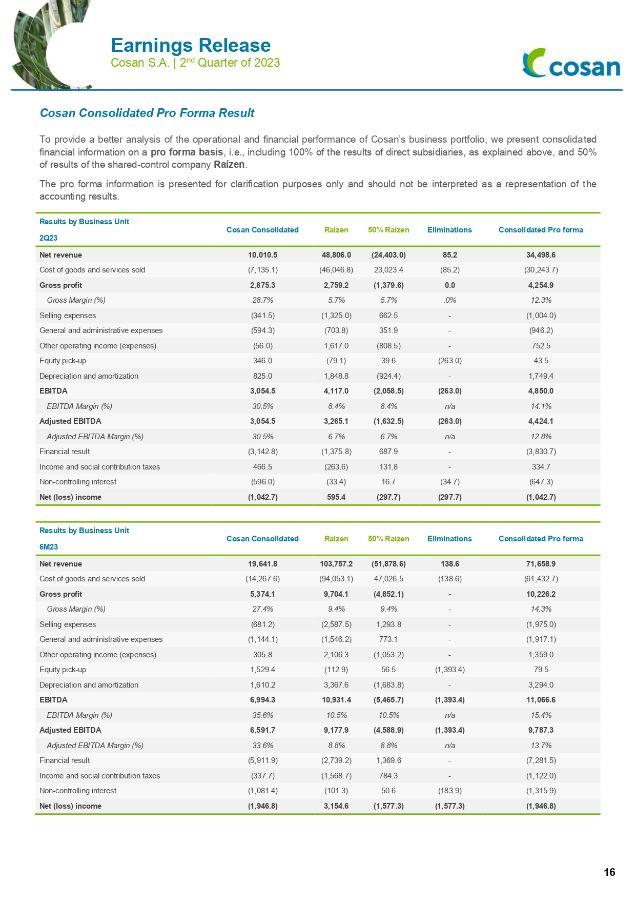
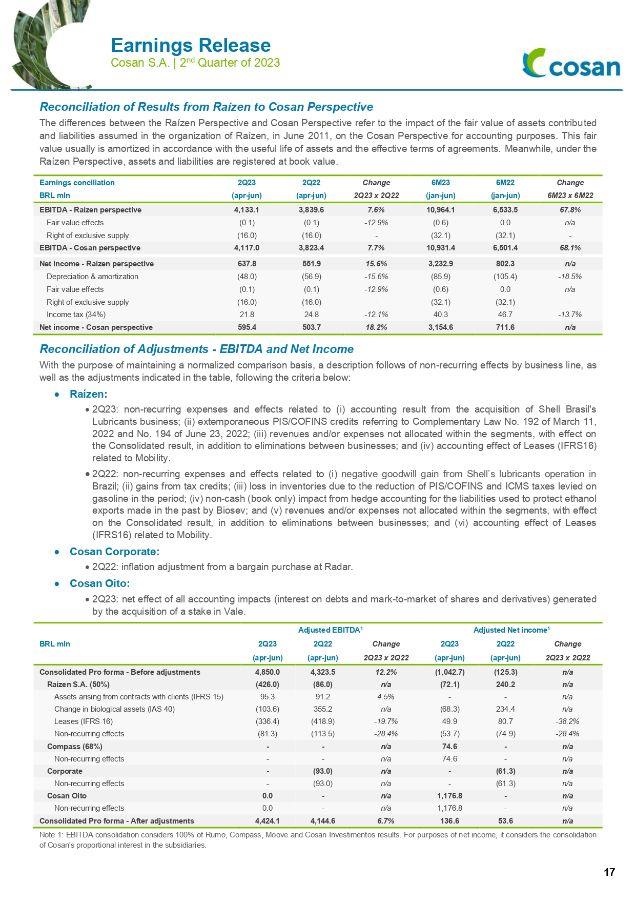
Reconciliation of Results from Raízen to Cosan Perspective The differences between the Raízen Perspective and Cosan Perspective refer to the impact of the fair value of assets contributed and liabilities assumed in the organization of Raízen, in June 2011, on the Cosan Perspective for accounting purposes. This fair value usually is amortized in accordance with the useful life of assets and the effective terms of agreements. Meanwhile, under the Raízen Perspective, assets and liabilities are registered at book value. Earnings conciliation 2Q23 2Q22 Change 6M23 6M22 Change BRL mln (apr-jun) (apr-jun) 2Q23 x 2Q22 (jan-jun) (jan-jun) 6M23 x 6M22 EBITDA - Raízen perspective 4,133.1 3,839.6 7.6% 10,964.1 6,533.5 67.8% Fair value effects (0.1) (0.1) -12.9% (0.6) 0.0 n/a Right of exclusive supply (16.0) (16.0) - (32.1) (32.1) - EBITDA - Cosan perspective 4,117.0 3,823.4 7.7% 10,931.4 6,501.4 68.1% Net income - Raízen perspective 637.8 551.9 15.6% 3,232.9 802.3 n/a Depreciation & amortization (48.0) (56.9) -15.6% (85.9) (105.4) -18.5% Fair value effects (0.1) (0.1) -12.9% (0.6) 0.0 n/a Right of exclusive supply (16.0) (16.0) - (32.1) (32.1) - Income tax (34%) 21.8 24.8 -12.1% 40.3 46.7 -13.7% Net income - Cosan perspective 595.4 503.7 18.2% 3,154.6 711.6 n/a Reconciliation of Adjustments - EBITDA and Net Income With the purpose of maintaining a normalized comparison basis, a description follows of non-recurring effects by business line, as well as the adjustments indicated in the table, following the criteria below: • Raízen: • 2Q23: non-recurring expenses and effects related to (i) accounting result from the acquisition of Shell Brasil's Lubricants business; (ii) extemporaneous PIS/COFINS credits referring to Complementary Law No. 192 of March 11, 2022 and No. 194 of June 23, 2022; (iii) revenues and/or expenses not allocated within the segments, with effect on the Consolidated result, in addition to eliminations between businesses; and (iv) accounting effect of Leases (IFRS16) related to Mobility. • 2Q22: non-recurring expenses and effects related to (i) negative goodwill gain from Shell’s lubricants operation in Brazil; (ii) gains from tax credits; (iii) loss in inventories due to the reduction of PIS/COFINS and ICMS taxes levied on gasoline in the period; (iv) non-cash (book only) impact from hedge accounting for the liabilities used to protect ethanol exports made in the past by Biosev; and (v) revenues and/or expenses not allocated within the segments, with effect on the Consolidated result, in addition to eliminations between businesses; and (vi) accounting effect of Leases (IFRS16) related to Mobility. • Cosan Corporate: • 2Q22: inflation adjustment from a bargain purchase at Radar. • Cosan Oito: • 2Q23: net effect of all accounting impacts (interest on debts and mark-to-market of shares and derivatives) generated by the acquisition of a stake in Vale. BRL mln Adjusted EBITDA1 Adjusted Net income1 2Q23 2Q22 Change 2Q23 2Q22 Change (apr-jun) (apr-jun) 2Q23 x 2Q22 (apr-jun) (apr-jun) 2Q23 x 2Q22 Consolidated Pro forma - Before adjustments 4,850.0 4,323.5 12.2% (1,042.7) (125.3) n/a Raízen S.A. (50%) (426.0) (86.0) n/a (72.1) 240.2 n/a Assets arising from contracts with clients (IFRS 15) 95.3 91.2 4.5% - - n/a Change in biological assets (IAS 40) (103.6) 355.2 n/a (68.3) 234.4 n/a Leases (IFRS 16) (336.4) (418.9) -19.7% 49.9 80.7 -38.2% Non-recurring effects (81.3) (113.5) -28.4% (53.7) (74.9) -28.4% Compass (68%) - - n/a 74.6 - n/a Non-recurring effects - - n/a 74.6 - n/a Corporate - (93.0) n/a - (61.3) n/a Non-recurring effects - (93.0) n/a - (61.3) n/a Cosan Oito 0.0 - n/a 1,176.8 - n/a Non-recurring effects 0.0 - n/a 1,176.8 - n/a Consolidated Pro forma - After adjustments 4,424.1 4,144.6 6.7% 136.6 53.6 n/a Note 1: EBITDA consolidation considers 100% of Rumo, Compass, Moove and Cosan Investimentos results. For purposes of net income, it considers the consolidation of Cosan's proportional interest in the subsidiaries.
Appendix II - ESG Highlights and Relevant Matters Publication of Sustainability Report – Cosan, Moove and RaízenIn June, Cosan published its Annual Sustainability Report, for the year 2022. The report introduced the ESG Vision 2030, which presents the main transversal material topics for the Cosan group and the goals and key drivers of this strategy to improve the group’s ESG aspects in the coming years. Moove also published its 2022 report with the highlight its improvement in the climate agenda via the CDP, as well as other commitments, such as having more women in leadership positions, incorporating recyclable resins into packaging and improving the Movement for Racial Equity (MOVER) to formulate guidelines, share experiences and learn how to build workplaces and societies that are racially equal. For the first time, Raízen presented its information in the Integrated Report format, formally adopting the framework of the International Integrated Reporting Council (IIRC). The report features the actions and developments that marked the 2022/23 crop year, as well as Raízen’s path to achieve 25% of leadership positions held by women and the construction of the 2GE plants. More information is available on the Sustainability page of Cosan’s website https://www.cosan.com.br/informacoes-financeiras/central-de-resultados/. Evolution in ESG agenda – ESG Integrity Yearbook 2022 For the first time, Cosan was included in the ESG Integrity Yearbook, a publication that analyzes data on corporate initiatives and investments related to environmental, social and governance issues. The ranking measures the reputation of the 100 companies with the best ESG perception in Brazil. We ranked 43rd among the companies with the highest audience in ESG news and 49th in the general ranking. In addition, the Company was featured once again in the Corporate Reputation Monitor (Merco), in ESG Responsibility, a benchmark corporate monitor in Latin America that assesses the corporate sustainability of the country’s most responsible companies. Below we present the principal matters announced up to the publication of this document: Issue of Bonds and Debentures by Cosan As part of the ongoing liability management process to optimize its capital structure and guarantee competitive financing to invest in its business portfolio, the Company issued Senior Notes 2030 (bonds), which raised USD550 million, and carried out the 6th issue of unsecured, non-convertible debentures, in a single series, in the total amount of R$1.0 billion. Natural Gas Supply Agreement at Comgás In July, Comgás entered into an agreement with Petrobras for the supply of natural gas, to be distributed to its client base. The agreement will be effective between January 2024 to December 2034, in the amount of approximately R$56 billion. Ownership Restructuring at Rumo In July, Rumo and its indirect subsidiary Rumo Malha Norte held their respective Extraordinary Shareholders Meeting, which approved the terms of the Ownership Restructuring, as announced by Rumo S.A. to the public on April 20, June 2 and June 19, 2023. The meetings approved the “Private Instrument of Plan of Partial Spin-Off of Rumo Malha do Norte S.A. with Merger of the Spin-Off Assets by Rumo S.A.,” entered into between the management of Rumo and Malha Norte, as well as the Ownership Restructuring and authorization of the capital increase at Rumo as a result of the merger of the Spun-off Assets.
Statutory Audit Committee The Statutory Audit Committee is 100% composed of independent members, with their normal duties including supervising and monitoring information security and cybersecurity. In July, the following members were elected to the Committee: Carla Trematore, as coordinator, and José Alexandre Scheinkman, Felício Mascarenhas de Andrade and João Ricardo Ducatti, as members. More information is available on Cosan’s website: https://www.cosan.com.br/sobre-a-cosan/conselhos-diretorias-e-comites/. Vale Unwind On August 10, 2023, the subsidiary Cosan Oito anticipated the partial settlement of 20% of the first tranche, which represents 15% of the total Collar financing structure related to the stake in Vale, equivalent to 0.10% of the mining company's total shares in date. This prepayment amounted to R$296,274 of principal plus interest, related to loan 4,131 and dismantling of the foreign exchange derivative. Additionally, we settled in advance the structure of derivatives (Collar) of VALE3 in equal proportion, resulting in a financial gain of R$28,961. Finally, the pre-payment discharged 4.5 million Vale shares previously pledged under this structure. As a result of the operation, the direct interest initially of 1.55%, on June 30, 2023, increased to 1.65%. Share Buyback Plan On August 11, 2023, the Company approved a new share buyback program of up to 116 million common shares of Cosan S.A, representing 6.19% of the total shares available on the market, with a term of 18 months. Shares repurchased may be used to meet obligations arising from potential exercise of share-based compensation plans, and also for holding in treasury, disposal or cancellations in accordance with applicable law.
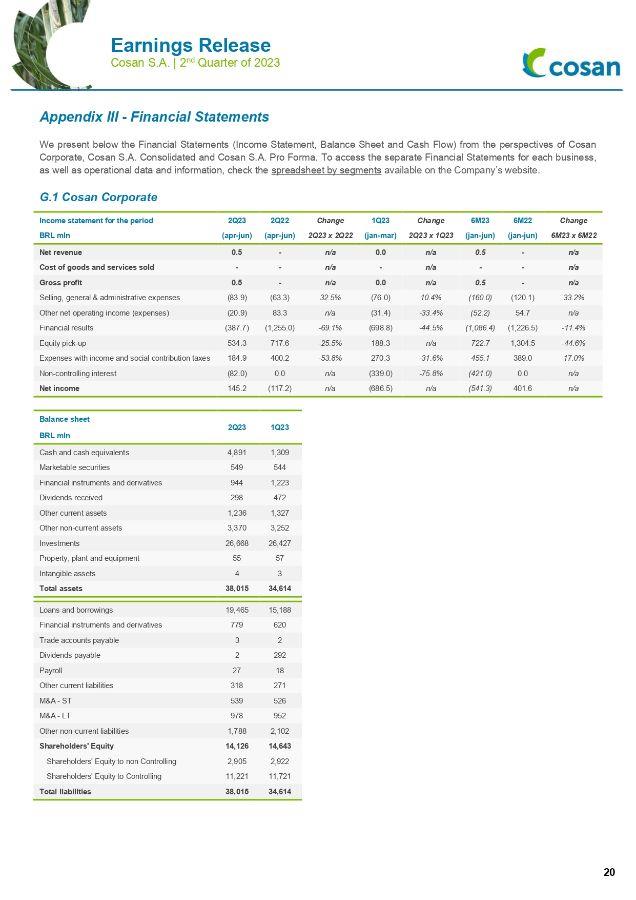
Appendix III - Financial Statements We present below the Financial Statements (Income Statement, Balance Sheet and Cash Flow) from the perspectives of Cosan Corporate, Cosan S.A. Consolidated and Cosan S.A. Pro Forma. To access the separate Financial Statements for each business, as well as operational data and information, check the spreadsheet by segments available on the Company’s website. G.1 Cosan Corporate Income statement for the period 2Q23 2Q22 Change 1Q23 Change 6M23 6M22 Change BRL mln (apr-jun) (apr-jun) 2Q23 x 2Q22 (jan-mar) 2Q23 x 1Q23 (jan-jun) (jan-jun) 6M23 x 6M22 Net revenue 0.5 - n/a 0.0 n/a 0.5 - n/a Cost of goods and services sold - - n/a - n/a - - n/a Gross profit 0.5 - n/a 0.0 n/a 0.5 - n/a Selling, general & administrative expenses (83.9) (63.3) 32.5% (76.0) 10.4% (160.0) (120.1) 33.2% Other net operating income (expenses) (20.9) 83.3 n/a (31.4) -33.4% (52.2) 54.7 n/a Financial results (387.7) (1,255.0) -69.1% (698.8) -44.5% (1,086.4) (1,226.5) -11.4% Equity pick-up 534.3 717.6 -25.5% 188.3 n/a 722.7 1,304.5 -44.6% Expenses with income and social contribution taxes 184.9 400.2 -53.8% 270.3 -31.6% 455.1 389.0 17.0% Non-controlling interest (82.0) 0.0 n/a (339.0) -75.8% (421.0) 0.0 n/a Net income 145.2 (117.2) n/a (686.5) n/a (541.3) 401.6 n/a Balance sheet 2Q23 1Q23 BRL mln Cash and cash equivalents 4,891 1,309 Marketable securities 549 544 Financial instruments and derivatives 944 1,223 Dividends received 298 472 Other current assets 1,236 1,327 Other non-current assets 3,370 3,252 Investments 26,668 26,427 Property, plant and equipment 55 57 Intangible assets 4 3 Total assets 38,015 34,614 Loans and borrowings 19,465 15,188 Financial instruments and derivatives 779 620 Trade accounts payable 3 2 Dividends payable 2 292 Payroll 27 18 Other current liabilities 318 271 M&A - ST 539 526 M&A - LT 978 952 Other non-current liabilities 1,788 2,102 Shareholders' Equity 14,126 14,643 Shareholders' Equity to non Controlling 2,905 2,922 Shareholders' Equity to Controlling 11,221 11,721 Total liabilities 38,015 34,614
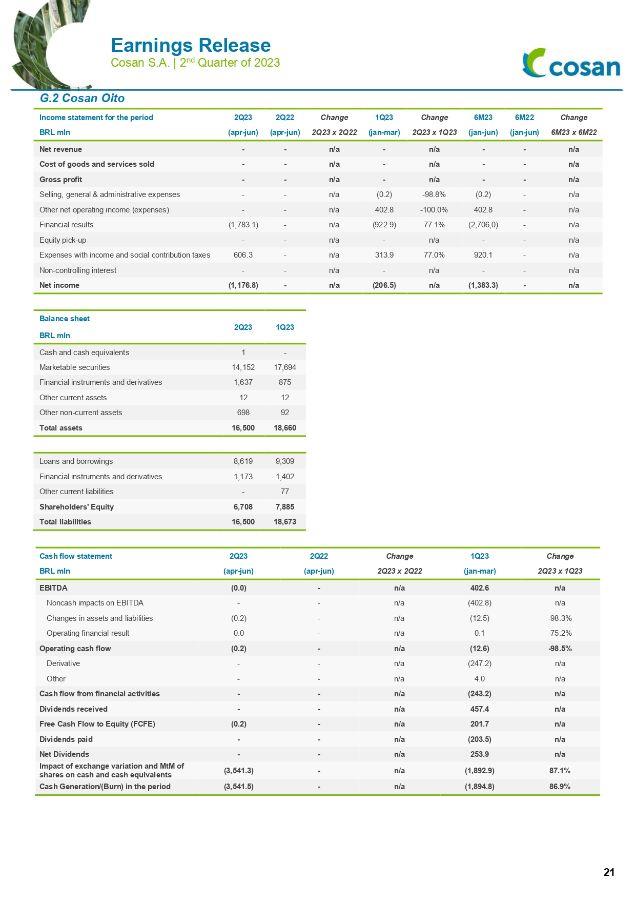
G.2 Cosan Oito Income statement for the period 2Q23 2Q22 Change 1Q23 Change 6M23 6M22 Change BRL mln (apr-jun) (apr-jun) 2Q23 x 2Q22 (jan-mar) 2Q23 x 1Q23 (jan-jun) (jan-jun) 6M23 x 6M22 Net revenue - - n/a - n/a - - n/a Cost of goods and services sold - - n/a - n/a - - n/a Gross profit - - n/a - n/a - - n/a Selling, general & administrative expenses - - n/a (0.2) -98.8% (0.2) - n/a Other net operating income (expenses) - - n/a 402.8 -100.0% 402.8 - n/a Financial results (1,783.1) - n/a (922.9) 77.1% (2,706,0) - n/a Equity pick-up - - n/a - n/a - - n/a Expenses with income and social contribution taxes 606.3 - n/a 313.9 77.0% 920.1 - n/a Non-controlling interest - - n/a - n/a - - n/a Net income (1,176.8) - n/a (206.5) n/a (1,383.3) - n/a Balance sheet 2Q23 1Q23 BRL mln Cash and cash equivalents 1 - Marketable securities 14,152 17,694 Financial instruments and derivatives 1,637 875 Other current assets 12 12 Other non-current assets 698 92 Total assets 16,500 18,660 Loans and borrowings 8,619 9,309 Financial instruments and derivatives 1,173 1,402 Other current liabilities - 77 Shareholders' Equity 6,708 7,885 Total liabilities 16,500 18,673 Cash flow statement 2Q23 2Q22 Change 1Q23 Change BRL mln (apr-jun) (apr-jun) 2Q23 x 2Q22 (jan-mar) 2Q23 x 1Q23 EBITDA (0.0) - n/a 402.6 n/a Noncash impacts on EBITDA - - n/a (402.8) n/a Changes in assets and liabilities (0.2) - n/a (12.5) -98.3% Operating financial result 0.0 - n/a 0.1 -75.2% Operating cash flow (0.2) - n/a (12.6) -98.5% Derivative - - n/a (247.2) n/a Other - - n/a 4.0 n/a Cash flow from financial activities - - n/a (243.2) n/a Dividends received - - n/a 457.4 n/a Free Cash Flow to Equity (FCFE) (0.2) - n/a 201.7 n/a Dividends paid - - n/a (203.5) n/a Net Dividends - - n/a 253.9 n/a Impact of exchange variation and MtM of shares on cash and cash equivalents (3,541.3) - n/a (1,892.9) 87.1% Cash Generation/(Burn) in the period (3,541.5) - n/a (1,894.8) 86.9%
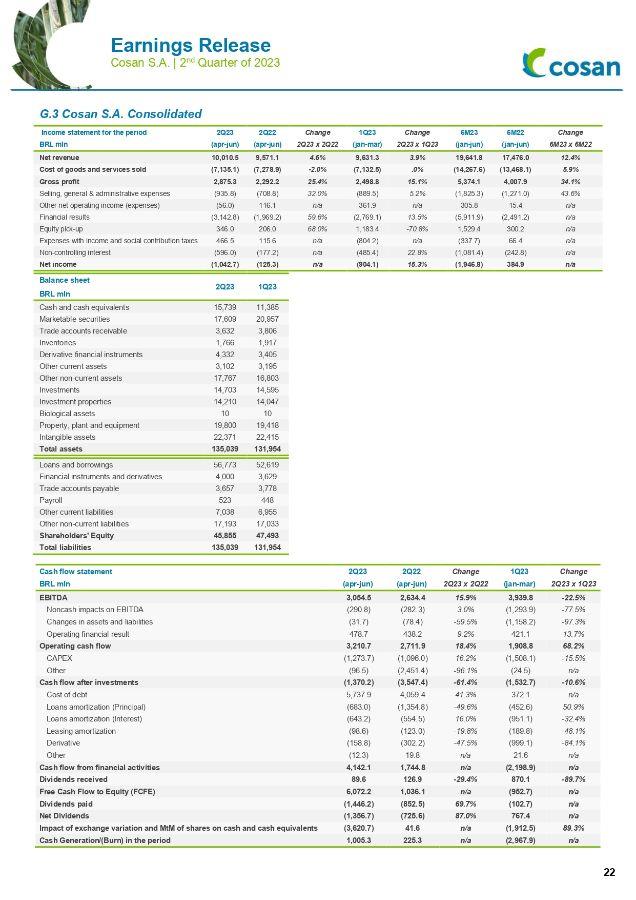
G.3 Cosan S.A. Consolidated Income statement for the period 2Q23 2Q22 Change 1Q23 Change 6M23 6M22 Change BRL mln (apr-jun) (apr-jun) 2Q23 x 2Q22 (jan-mar) 2Q23 x 1Q23 (jan-jun) (jan-jun) 6M23 x 6M22 Net revenue 10,010.5 9,571.1 4.6% 9,631.3 3.9% 19,641.8 17,476.0 12.4% Cost of goods and services sold (7,135.1) (7,278.9) -2.0% (7,132.5) .0% (14,267.6) (13,468.1) 5.9% Gross profit 2,875.3 2,292.2 25.4% 2,498.8 15.1% 5,374.1 4,007.9 34.1% Selling, general & administrative expenses (935.8) (708.8) 32.0% (889.5) 5.2% (1,825.3) (1,271.0) 43.6% Other net operating income (expenses) (56.0) 116.1 n/a 361.9 n/a 305.8 15.4 n/a Financial results (3,142.8) (1,969.2) 59.6% (2,769.1) 13.5% (5,911.9) (2,491.2) n/a Equity pick-up 346.0 206.0 68.0% 1,183.4 -70.8% 1,529.4 300.2 n/a Expenses with income and social contribution taxes 466.5 115.6 n/a (804.2) n/a (337.7) 66.4 n/a Non-controlling interest (596.0) (177.2) n/a (485.4) 22.8% (1,081.4) (242.8) n/a Net income (1,042.7) (125.3) n/a (904.1) 15.3% (1,946.8) 384.9 n/a Balance sheet 2Q23 1Q23 BRL mln Cash and cash equivalents 15,739 11,385 Marketable securities 17,609 20,957 Trade accounts receivable 3,632 3,806 Inventories 1,766 1,917 Derivative financial instruments 4,332 3,405 Other current assets 3,102 3,195 Other non-current assets 17,767 16,803 Investments 14,703 14,595 Investment properties 14,210 14,047 Biological assets 10 10 Property, plant and equipment 19,800 19,418 Intangible assets 22,371 22,415 Total assets 135,039 131,954 Loans and borrowings 56,773 52,619 Financial instruments and derivatives 4,000 3,629 Trade accounts payable 3,657 3,778 Payroll 523 448 Other current liabilities 7,038 6,955 Other non-current liabilities 17,193 17,033 Shareholders' Equity 45,855 47,493 Total liabilities 135,039 131,954 Cash flow statement 2Q23 2Q22 Change 1Q23 Change BRL mln (apr-jun) (apr-jun) 2Q23 x 2Q22 (jan-mar) 2Q23 x 1Q23 EBITDA 3,054.5 2,634.4 15.9% 3,939.8 -22.5% Noncash impacts on EBITDA (290.8) (282.3) 3.0% (1,293.9) -77.5% Changes in assets and liabilities (31.7) (78.4) -59.5% (1,158.2) -97.3% Operating financial result 478.7 438.2 9.2% 421.1 13.7% Operating cash flow 3,210.7 2,711.9 18.4% 1,908.8 68.2% CAPEX (1,273.7) (1,096.0) 16.2% (1,508.1) -15.5% Other (96.5) (2,451.4) -96.1% (24.5) n/a Cash flow after investments (1,370.2) (3,547.4) -61.4% (1,532.7) -10.6% Cost of debt 5,737.9 4,059.4 41.3% 372.1 n/a Loans amortization (Principal) (683.0) (1,354.8) -49.6% (452.6) 50.9% Loans amortization (Interest) (643.2) (554.5) 16.0% (951.1) -32.4% Leasing amortization (98.6) (123.0) -19.8% (189.8) -48.1% Derivative (158.8) (302.2) -47.5% (999.1) -84.1% Other (12.3) 19.8 n/a 21.6 n/a Cash flow from financial activities 4,142.1 1,744.8 n/a (2,198.9) n/a Dividends received 89.6 126.9 -29.4% 870.1 -89.7% Free Cash Flow to Equity (FCFE) 6,072.2 1,036.1 n/a (952.7) n/a Dividends paid (1,446.2) (852.5) 69.7% (102.7) n/a Net Dividends (1,356.7) (725.6) 87.0% 767.4 n/a Impact of exchange variation and MtM of shares on cash and cash equivalents (3,620.7) 41.6 n/a (1,912.5) 89.3% Cash Generation/(Burn) in the period 1,005.3 225.3 n/a (2,967.9) n/a
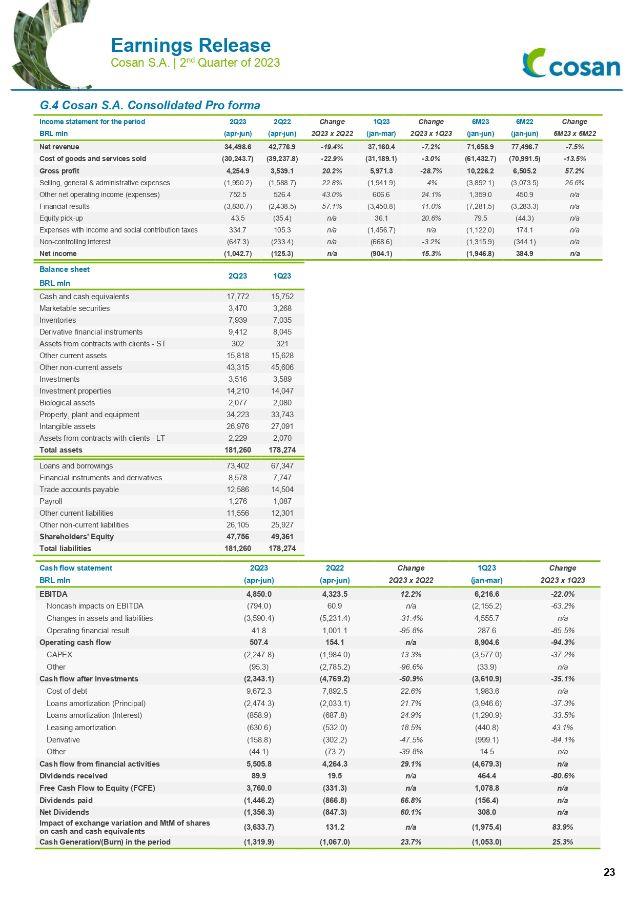
G.4 Cosan S.A. Consolidated Pro forma Income statement for the period 2Q23 2Q22 Change 1Q23 Change 6M23 6M22 Change BRL mln (apr-jun) (apr-jun) 2Q23 x 2Q22 (jan-mar) 2Q23 x 1Q23 (jan-jun) (jan-jun) 6M23 x 6M22 Net revenue 34,498.6 42,776.9 -19.4% 37,160.4 -7.2% 71,658.9 77,496.7 -7.5% Cost of goods and services sold (30,243.7) (39,237.8) -22.9% (31,189.1) -3.0% (61,432.7) (70,991.5) -13.5% Gross profit 4,254.9 3,539.1 20.2% 5,971.3 -28.7% 10,226.2 6,505.2 57.2% Selling, general & administrative expenses (1,950.2) (1,588.7) 22.8% (1,941.9) .4% (3,892.1) (3,073.5) 26.6% Other net operating income (expenses) 752.5 526.4 43.0% 606.6 24.1% 1,359.0 450.9 n/a Financial results (3,830.7) (2,438.5) 57.1% (3,450.8) 11.0% (7,281.5) (3,283.3) n/a Equity pick-up 43.5 (35.4) n/a 36.1 20.6% 79.5 (44.3) n/a Expenses with income and social contribution taxes 334.7 105.3 n/a (1,456.7) n/a (1,122.0) 174.1 n/a Non-controlling interest (647.3) (233.4) n/a (668.6) -3.2% (1,315.9) (344.1) n/a Net income (1,042.7) (125.3) n/a (904.1) 15.3% (1,946.8) 384.9 n/a Balance sheet 2Q23 1Q23 BRL mln Cash and cash equivalents 17,772 15,752 Marketable securities 3,470 3,268 Inventories 7,939 7,035 Derivative financial instruments 9,412 8,045 Assets from contracts with clients - ST 302 321 Other current assets 15,818 15,628 Other non-current assets 43,315 45,606 Investments 3,516 3,589 Investment properties 14,210 14,047 Biological assets 2,077 2,080 Property, plant and equipment 34,223 33,743 Intangible assets 26,976 27,091 Assets from contracts with clients - LT 2,229 2,070 Total assets 181,260 178,274 Loans and borrowings 73,402 67,347 Financial instruments and derivatives 8,578 7,747 Trade accounts payable 12,586 14,504 Payroll 1,276 1,087 Other current liabilities 11,556 12,301 Other non-current liabilities 26,105 25,927 Shareholders' Equity 47,756 49,361 Total liabilities 181,260 178,274 Cash flow statement 2Q23 2Q22 Change 1Q23 Change BRL mln (apr-jun) (apr-jun) 2Q23 x 2Q22 (jan-mar) 2Q23 x 1Q23 EBITDA 4,850.0 4,323.5 12.2% 6,216.6 -22.0% Noncash impacts on EBITDA (794.0) 60.9 n/a (2,155.2) -63.2% Changes in assets and liabilities (3,590.4) (5,231.4) -31.4% 4,555.7 n/a Operating financial result 41.8 1,001.1 -95.8% 287.6 -85.5% Operating cash flow 507.4 154.1 n/a 8,904.6 -94.3% CAPEX (2,247.8) (1,984.0) 13.3% (3,577.0) -37.2% Other (95.3) (2,785.2) -96.6% (33.9) n/a Cash flow after investments (2,343.1) (4,769.2) -50.9% (3,610.9) -35.1% Cost of debt 9,672.3 7,892.5 22.6% 1,983.6 n/a Loans amortization (Principal) (2,474.3) (2,033.1) 21.7% (3,946.6) -37.3% Loans amortization (Interest) (858.9) (687.8) 24.9% (1,290.9) -33.5% Leasing amortization (630.6) (532.0) 18.5% (440.8) 43.1% Derivative (158.8) (302.2) -47.5% (999.1) -84.1% Other (44.1) (73.2) -39.8% 14.5 n/a Cash flow from financial activities 5,505.8 4,264.3 29.1% (4,679.3) n/a Dividends received 89.9 19.5 n/a 464.4 -80.6% Free Cash Flow to Equity (FCFE) 3,760.0 (331.3) n/a 1,078.8 n/a Dividends paid (1,446.2) (866.8) 66.8% (156.4) n/a Net Dividends (1,356.3) (847.3) 60.1% 308.0 n/a Impact of exchange variation and MtM of shares on cash and cash equivalents (3,633.7) 131.2 n/a (1,975.4) 83.9% Cash Generation/(Burn) in the period (1,319.9) (1,067.0) 23.7% (1,053.0) 25.3%
2Q23 EARNINGS CONFERENCE CALL Portuguese (with simultaneous translation into English) August 15, 2023 (Tuesday) TIME 3 p.m. (Brasília) | 2 p.m. (New York) Webcast PT/EN: click here BR: + 55 (11) 4632-2237 USA +1 (386) 347 5053 TEAM: Ricardo Lewin – CFO and IRO Ana Luísa Perina – Head of IR Camila Amorim – Coordinator Paula Macedo – Coordinator Eduardo Kitagawa – Analyst Helena Fukuda – Analyst INVESTOR RELATIONS E-mail: ri@cosan.com Website: cosan.com.br Tel: +55 11 3897-9797