Is MATIC Poised For Takeoff? Key Area Breaks Records, Fueling Bullish Outlook
03 Mai 2024 - 10:30AM
NEWSBTC
Polygon (MATIC), the Ethereum scaling solution, has been a hot
topic for weeks. Its daily active addresses recently hit an
all-time high, exceeding 1.4 million, a testament to the network’s
growing user base. This surge in activity, however, presents a tale
of two sides for MATIC. Related Reading: Is Ethereum Back? Record
267,000 New Users Spark Speculation Polygon’s Busy Streets: A Sign
Of Growth Or Gridlock? The high traffic on Polygon’s virtual
streets is undeniable. The consistent daily active addresses above
1 million suggest a thriving ecosystem. However, a closer look
reveals a potential bottleneck. While the number of users has
skyrocketed, transaction fees have taken a nosedive. This decline
in fees translates to a drop in revenue for the network, raising
concerns about Polygon’s long-term sustainability. JUST IN: Polygon
PoS has recorded a new all time high in daily active addresses with
1.4M pic.twitter.com/YnOdDYbyJD — Today In Polygon
(@TodayInPolygon) May 1, 2024 The story doesn’t end there. Despite
the network’s bustling activity, the Total Value Locked (TVL) in
Polygon’s Decentralized Finance (DeFi) protocols has dipped. This
could indicate a cautious approach from DeFi whales, hesitant to
fully commit their assets in the current market climate. MATIC
Bulls Charge In, Waving Green Flags Despite the underlying
concerns, MATIC bulls are charging forward. The token’s price
experienced a surge exceeding 8% in the past 24 hours, currently
hovering around $0.71. This bullish momentum could be attributed to
a rise in buying pressure. Data suggests a decrease in MATIC supply
on exchanges, coupled with an increase in holdings by large
investors (whales). This shift indicates investor confidence in
Polygon’s future potential. MATIC market cap currently at $7
billion. Chart: TradingView.com Technical Indicators Flash Bullish,
But Caution Remains Technical indicators also paint a bullish
picture for MATIC. The Chaikin Money Flow (CMF), Money Flow Index
(MFI), and the Moving Average Convergence Divergence (MACD) all
point towards a potential upward trend. These indicators suggest
strong buying pressure and a bullish upper hand in the market.
However, the Bollinger Bands, which measure price volatility,
indicate that MATIC might be entering a period of lower price
swings. Related Reading: Whales Dive In, But Dogecoin Price Sinks
20%: What’s Going On? While this could be a sign of consolidation
after the recent surge, it also introduces an element of
uncertainty. The cryptocurrency market is notoriously
unpredictable, and technical indicators can be misleading. The Road
Ahead: Can Polygon Navigate The Challenges? Polygon finds itself at
a crossroads. The network’s high activity is a positive sign, but
the decline in fees and DeFi TVL raises concerns. The recent price
surge and bullish technical indicators offer a glimmer of hope for
MATIC investors. However, navigating the volatile cryptocurrency
market requires a cautious approach. For Polygon to maintain its
current momentum, it needs to address the issue of declining fees.
Exploring alternative revenue models or implementing fee structures
that incentivize network usage are crucial
steps. Additionally, fostering a robust DeFi ecosystem by
attracting innovative protocols and users could reignite investor
confidence and drive TVL growth. Featured image from Pixabay, chart
from TradingView
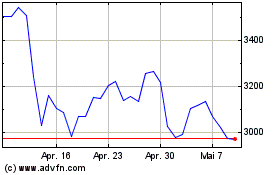
Ethereum (COIN:ETHUSD)
Historical Stock Chart
Von Apr 2024 bis Mai 2024

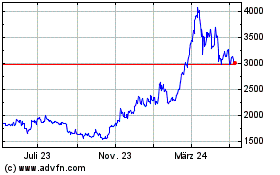
Ethereum (COIN:ETHUSD)
Historical Stock Chart
Von Mai 2023 bis Mai 2024
