EraNova Metals Inc., a mineral exploration company, engages in the acquisition, exploration, and development of mineral properties in Canada and the United States. The company explores for gold, silver, lead, copper, nickel, and zinc. Its flagship project is the 100% owned Ruby Creek project compris...
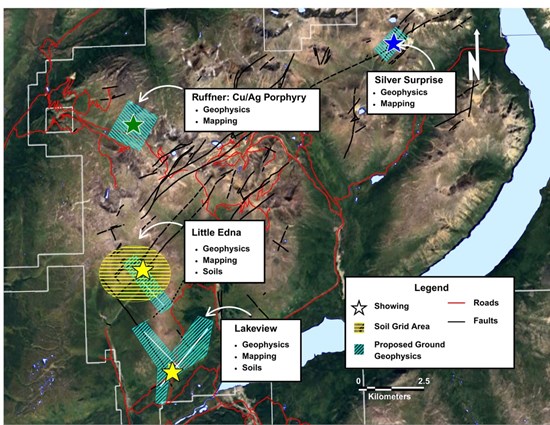
EraNova Metals Inc., a mineral exploration company, engages in the acquisition, exploration, and development of mineral properties in Canada and the United States. The company explores for gold, silver, lead, copper, nickel, and zinc. Its flagship project is the 100% owned Ruby Creek project comprising 56 contiguous mineral claims covering an area of 29,734 hectares located in Atlin, British Colombia. EraNova Metals Inc. was formerly known as Stuhini Exploration Ltd. and changed its name to EraNova Metals Inc. in January 2026. The company was incorporated in 2017 and is headquartered in Vancouver, Canada.
Mehr anzeigen

 Hot Features