ADVFN Logo ADVFN

Wir konnten keine Ergebnisse für:
Stelle sicher, dass deine Schreibweise korrekt ist oder versuche deine Suche zu erweitern.

Trends

Toplisten

Es scheint, dass du nicht eingeloggt bist.
Klicke auf den Button unten, um dich einzuloggen und deine zuletzt angesehenen Aktien zu sehen.

Hot Features

Registration Strip Icon for default Registrieren Sie sich kostenlos, um Echtzeitkurse, interaktive Charts, Live-Optionsfluss und mehr zu erhalten.
Northern Minerals and Exploration Ltd (PK)

Northern Minerals and Exploration Ltd (PK) (NMEX)

0,0719
0,00125
(1,77%)
Geschlossen 28 März 9:00PM

Professionelle Tools für Privatanleger.

Wichtige Statistiken und Details

Current Price
0,0719
Gebot
0,0375
Fragen
0,098
Volumen
3.869
0,07005 Tagesbereich 0,0719
0,07005 52-Wochen-Bereich 0,225
Marktkapitalisierung
Handelsende
0,07065
Handelsbeginn
0,0719
Letzte Trade
513
@
0.0719
Letzter Handelszeitpunkt
Finanzvolumen
US$ 278
VWAP
0,0719
Durchschnittliches Volumen (3 Mio.)
10.139
Ausgegebene Aktien
105.401.032
Dividendenrendite
-
Kurs-Gewinn-Verhältnis
-43,75
Gewinn pro Aktie (EPS)
-0
Erlöse
-
Nettogewinn
-170k

Über Northern Minerals and Exploration Ltd (PK)

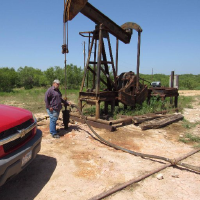
Northern Minerals & Exploration Ltd. is an emerging an emerging publicly traded company focused on oil and gas exploration & production in Texas, gold & silver exploration in Nevada & hotel & resort development in Mexico. Northern Minerals & Exploration Ltd. is an emerging an emerging publicly traded company focused on oil and gas exploration & production in Texas, gold & silver exploration in Nevada & hotel & resort development in Mexico.

Sektor
Gold Ores
Branche
Amusement & Recreation Svcs
Hauptsitz
Carson City, Nevada, USA
Gegründet
2012
Northern Minerals and Exploration Ltd (PK) is listed in the Gold Ores sector of the OTCMarkets with ticker NMEX. The last closing price for Northern Minerals and Ex... (PK) was US$0,07. Over the last year, Northern Minerals and Ex... (PK) shares have traded in a share price range of US$ 0,07005 to US$ 0,225.

Northern Minerals and Ex... (PK) currently has 105.401.032 shares in issue. The market capitalisation of Northern Minerals and Ex... (PK) is US$7,45 million. Northern Minerals and Ex... (PK) has a price to earnings ratio (PE ratio) of -43.75.

NMEX Neueste Nachrichten

Zeitraum †ÄnderungÄnderung %HandelsbeginnHochNiedrigDurchsch. VolumenVWAP
1-0.0081-10.1250.080.080.07005120660.07097243CS
4-0.0757-51.28726287260.14760.14760.07005147920.1055708CS
12-0.0531-42.480.1250.20.07005101390.15031314CS
26-0.1305-64.4762845850.20240.20240.0700576760.14858161CS
52-0.1281-64.050.20.2250.0700570450.1510942CS
156-0.0256-26.25641025640.09750.250.04569960.12496474CS
2600.0439156.7857142860.0280.350.02170300.11670141CS

NMEX - Frequently Asked Questions (FAQ)

What is the current Northern Minerals and Ex... (PK) share price?
The current share price of Northern Minerals and Ex... (PK) is US$ 0,0719
How many Northern Minerals and Ex... (PK) shares are in issue?
Northern Minerals and Ex... (PK) has 105.401.032 shares in issue
What is the market cap of Northern Minerals and Ex... (PK)?
The market capitalisation of Northern Minerals and Ex... (PK) is USD 7,45M
What is the 1 year trading range for Northern Minerals and Ex... (PK) share price?
Northern Minerals and Ex... (PK) has traded in the range of US$ 0,07005 to US$ 0,225 during the past year
What is the PE ratio of Northern Minerals and Ex... (PK)?
The price to earnings ratio of Northern Minerals and Ex... (PK) is -43,75
What is the reporting currency for Northern Minerals and Ex... (PK)?
Northern Minerals and Ex... (PK) reports financial results in USD
What is the latest annual profit for Northern Minerals and Ex... (PK)?
The latest annual profit of Northern Minerals and Ex... (PK) is USD -170k
What is the registered address of Northern Minerals and Ex... (PK)?
The registered address for Northern Minerals and Ex... (PK) is 701 S CARSON ST, STE 200, CARSON CITY, NEVADA, 89701
Which industry sector does Northern Minerals and Ex... (PK) operate in?
Northern Minerals and Ex... (PK) operates in the AMUSEMENT & RECREATION SVCS sector
  • Volumen
  • % Tops
  • % Flops
SymbolPreisVol.
DVNCFDanavation Technologies Corporation (CE)
US$ 0,0044
(439.900,00%)
3,68k
STLBSterling Business Solutions Inc (CE)
US$ 0,0002
(19.900,00%)
100
OGNTOrgana Technologies Group Inc (CE)
US$ 0,000167
(16.600,00%)
120
IMTLImage Protect Inc (PK)
US$ 0,0001
(9.900,00%)
1M
REFXFRedflow Ltd (PK)
US$ 0,01
(9.900,00%)
10k
PHRZFPharol SGPA SA (PK)
US$ 0,0001
(-99,75%)
800
VIEWFViewtran Group Inc (CE)
US$ 0,000001
(-99,00%)
500
TTCFQTattooed Chef Inc (CE)
US$ 0,000001
(-99,00%)
1,59k
TMGIMarquie Group Inc (PK)
US$ 0,000001
(-99,00%)
1,7M
DLOCDigital Locations Inc (CE)
US$ 0,000001
(-99,00%)
1,56k
HMBLHUMBL Inc (PK)
US$ 0,0003
(0,00%)
385,08M
TWOHTwo Hands Corporation (PK)
US$ 0,0007
(-50,00%)
301,5M
DPLSDarkPulse Inc (PK)
US$ 0,00045
(-10,00%)
184,93M
MJLBUltrack Systems Inc (PK)
US$ 0,0002
(0,00%)
170,71M
BOMObowmo Inc (PK)
US$ 0,0002
(100,00%)
162,63M
Keine Diskussionen Gefunden.
Neuen Thread Erstellen