ASM announces second quarter 2024 results
Almere, The Netherlands
July 23, 2024, 6 p.m. CET
Strong Q2 bookings supported by GAA and HBM
demand
ASM International N.V. (Euronext Amsterdam: ASM) today reports
its Q2 2024 results (unaudited).
Financial highlights
|
€ million |
Q2 2023 |
Q1 2024 |
Q2 2024 |
|
New orders |
485.8 |
697.9 |
755.4 |
|
yoy change % at constant currencies |
(48%) |
10% |
56% |
| |
|
|
|
|
Revenue |
669.1 |
639.0 |
706.1 |
|
yoy change % at constant currencies |
21% |
(8%) |
6% |
| |
|
|
|
|
Gross profit margin % |
48.3% |
52.9 % |
49.8% |
|
Adjusted gross profit margin 1 |
49.0% |
52.9% |
49.8% |
| |
|
|
|
|
Operating result |
170.7 |
187.1 |
177.6 |
|
Operating result margin % |
25.5% |
29.3% |
25.1% |
| |
|
|
|
|
Adjusted operating result 1 |
180.1 |
191.8 |
182.3 |
|
Adjusted operating result margin 1 |
26.9% |
30.0% |
25.8% |
| |
|
|
|
|
Net earnings |
151.2 |
173.1 |
159.0 |
|
Adjusted net earnings 1 |
160.7 |
178.9 |
164.7 |
1 Adjusted figures are non-IFRS performance measures
(previously referred to as "normalized"). Refer to Annex 3 for a
reconciliation of non-IFRS performance measures.
- New orders of €755 million in Q2 2024 increased by 56% at
constant currencies (increased by 55% as reported) mainly driven by
strong demand for gate-all-around (GAA) and high-bandwith memory
(HBM).
- Revenue of €706 million increased by 6% at constant currencies
(also 6% as reported) from Q2 of last year and slightly above the
guidance (€660-700 million).
- Adjusted gross profit margin increased to 49.8%, up from 49.0%
in Q2 of last year, due to mix and strong China sales.
- Adjusted operating result margin decreased to 25.8%, compared
to 26.9% in Q2 last year. The margin % was unfavorably impacted by
1.2% as a result of a one-off tax charge related to accelerated
vesting of previously granted performance shares.
- Revenue for Q3 2024 is projected to increase to €740-780
million. Revenue for the second half is expected to increase around
15% compared to the first half.
- In Q2 2024 we paid €135 million in dividends to ASM
shareholders and bought back €59 million of our own shares as part
of €150 million share buyback program that started on May 15,
2024.
Comment
“ASM continued its solid performance in the second quarter”, said
Hichem M’Saad, CEO of ASM. “Revenue in the second quarter amounted
to €706 million, which was an increase of 6% at constant currencies
compared to the same quarter of last year, and slightly above the
top end of our guidance of €660-700 million.
Bookings increased to €755 million, up 56% at constant currencies
from the second quarter 2023. Logic/foundry bookings again included
a solid level of tool orders related to the gate-all-around (GAA)
2nm technology node. The GAA node is still projected to move into
high-volume manufacturing in the course of 2025, and we expect this
to be a strong revenue driver for ASM.
Also, in memory, we saw strong growth in
bookings benefiting from investments in DRAM HBM
applications.
In the silicon-based power/analog/wafer segment, bookings were at a
decent level, despite the generally slow demand in this market.
Silicon carbide (SiC) Epi bookings were also at a relatively strong
level in Q2.
Q2 adjusted gross margin increased from 49.0%
last year to 49.8%. It decreased compared to the exceptional level
of 52.9% in Q1 2024, which is explained by mix and lower sales from
China. The adjusted operating profit margin decreased slightly to
25.8% in Q2 2024 compared to 26.9% in the same quarter last year,
and would have been 27.0% excluding approximately 1.2% from a
one-off tax charge included in SG&A expenses in Q2 2024.”
Outlook
While conditions in end markets continue to be
mixed, the recovery of the wafer fab equipment is gradually picking
up pace, as AI demand is fueling investments in HBM DRAM and in
leading-edge logic/foundry. For 2024, a slight increase in WFE
spending is expected, followed by a stronger increase in 2025.
We expect revenue in the third quarter of 2024,
at constant currencies, to be in a range of €740-780 million.
We project ASM’s revenue in the second half to increase around 15%
compared to the level in the first half resulting in another growth
year for ASM. We continue to expect sales from China to drop in the
second half compared to the exceptional level in the first half.
This will however be more than offset by an expected strong
increase in the second half in leading-edge logic/foundry sales,
mostly driven by rising GAA-related sales and an increase in memory
sales, in particular for HBM DRAM.
Despite softening market conditions, we still expect our silicon
carbide (SiC) Epi sales to increase by a double-digit percentage in
2024, supported by the contribution from newly won customers.
We remain confident about the mid-term targets for 2025 and 2027
that we provided in our 2023 Investor Day, and we expect ASM will
continue to outperform the WFE market during this timeframe.
Interim financial report
ASM International N.V. (Euronext Amsterdam: ASM)
today also publishes its Interim Financial Report for the six month
period ended June 30, 2024.
This report includes an Interim Management Board Report,
including ESG update, and condensed consolidated interim financial
statements prepared in accordance with IAS 34 (Interim Financial
Reporting). The Interim Financial Report comprises regulated
information within the meaning of the Dutch Financial Markets
Supervision Act (“Wet op het Financieel Toezicht”) and is available
in full on our website www.asm.com.
Share buyback program
On May 14, 2024, ASM announced the start of the €150 million
share buyback program. As of June 30, 2024, 39.4% of the share
buyback program was completed at an average share price of
€653.71.
About ASM
ASM International N.V., headquartered in Almere,
the Netherlands, and its subsidiaries design and manufacture
equipment and process solutions to produce semiconductor devices
for wafer processing, and have facilities in the United States,
Europe, and Asia. ASM International's common stock trades on the
Euronext Amsterdam Stock Exchange (symbol: ASM). For more
information, visit ASM's website at www.asm.com.
Cautionary Note Regarding Forward-Looking
Statements: All matters discussed in this press release, except for
any historical data, are forward-looking statements.
Forward-looking statements involve risks and uncertainties that
could cause actual results to differ materially from those in the
forward-looking statements. These include, but are not limited to,
economic conditions and trends in the semiconductor industry
generally and the timing of the industry cycles specifically,
currency fluctuations, corporate transactions, financing and
liquidity matters, the success of restructurings, the timing of
significant orders, market acceptance of new products, competitive
factors, litigation involving intellectual property, shareholders
or other issues, commercial and economic disruption due to natural
disasters, terrorist activity, armed conflict or political
instability, changes in import/export regulations, pandemics,
epidemics and other risks indicated in the company's reports and
financial statements. The company assumes no obligation nor intends
to update or revise any forward-looking statements to reflect
future developments or circumstances.
This press release contains inside
information within the meaning of Article 7(1) of the EU Market
Abuse Regulation.
Quarterly earnings conference call details
ASM will host the quarterly earnings conference
call and webcast on Wednesday, July 24, 2024, at 3:00 p.m. CET.
Conference-call participants should pre-register
using this link to receive the dial-in numbers, passcode and a
personal PIN, which are required to access the conference call.
A simultaneous audio webcast and replay will be accessible at
this link.
| Contacts |
|
| Investor and
media relations |
Investor
relations |
| Victor
Bareño |
Valentina
Fantigrossi |
| T: +31 88 100
8500 |
T: +31 88 100
8502 |
| E:
investor.relations@asm.com |
E:
investor.relations@asm.com |
- 20240723 ASM reports Q2 2024 results


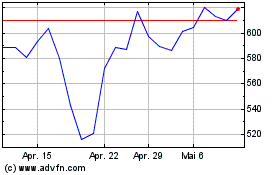
ASM International NV (TG:AVS)
Historical Stock Chart
Von Dez 2024 bis Jan 2025

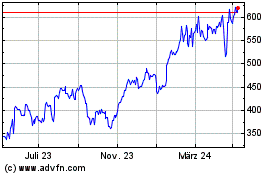
ASM International NV (TG:AVS)
Historical Stock Chart
Von Jan 2024 bis Jan 2025
