0000084129
false
0000084129
2023-06-29
2023-06-29
iso4217:USD
xbrli:shares
iso4217:USD
xbrli:shares
UNITED STATES
SECURITIES AND EXCHANGE COMMISSION
WASHINGTON, D.C. 20549
FORM 8-K
CURRENT REPORT
PURSUANT TO SECTION 13 OR 15(D) OF
THE
SECURITIES EXCHANGE ACT OF 1934
Date of report (Date of earliest event reported):
June 29, 2023
Rite
Aid Corporation
(Exact name of registrant as specified in its
charter)
| Delaware |
|
1-5742 |
|
23-1614034 |
(State
or Other Jurisdiction
of Incorporation) |
|
(Commission
File Number) |
|
(IRS
Employer
Identification Number) |
P.O.
Box 3165
Harrisburg,
Pennsylvania 17105
(Address of principal executive offices, including
zip code)
(717)
761-2633
(Registrant’s telephone number, including
area code)
N/A
(Former name
or former address, if changed since last report)
Check the appropriate box below if the Form 8-K
filing is intended to simultaneously satisfy the filing obligation of the registrant under any of the following provisions (see General
Instruction A.2. below):
¨ Written
communications pursuant to Rule 425 under the Securities Act (17 CFR 230.425)
¨ Soliciting
material pursuant to Rule 14a-12 under the Exchange Act (17 CFR 240.14a-12)
¨ Pre-commencement
communications pursuant to Rule 14d-2(b) under the Exchange Act (17 CFR 240.14d-2(b))
¨ Pre-commencement
communications pursuant to Rule 13e-4(c) under the Exchange Act (17 CFR 240.13e-4(c))
Securities registered pursuant to Section 12(b) of the Act:
| Title of each class |
Trading
Symbol(s) |
Name of each exchange on which
registered |
| Common
Stock, $1.00 par value |
RAD |
The
New York Stock Exchange |
Indicate by check mark whether the registrant is an emerging growth company as defined in Rule 405 of the Securities Act of 1933 (§230.405
of this chapter) or Rule 12b-2 of the Securities Exchange Act of 1934 (§240.12b-2 of this chapter).
Emerging
growth company ¨
If
an emerging growth company, indicate by check mark if the registrant has elected not to use the extended transition period for
complying with any new or revised financial accounting standards provided pursuant to Section 13(a) of the Exchange Act. ¨
Item 2.02. Results
of Operations and Financial Condition.
On June 29, 2023, Rite Aid Corporation (the
“Company”) reported its financial position and results of operations as of and for the thirteen week period ended June 3,
2023. The press release includes the non-GAAP financial measures, “Adjusted EBITDA,” “Adjusted Net Income (Loss)”
and “Adjusted Net Income (Loss) per Diluted Share.” The Company uses these non-GAAP measures in assessing its performance
in addition to net income, the most directly comparable GAAP financial measure. Reconciliations of Adjusted EBITDA, Adjusted Net Income
(Loss) and Adjusted Net Income (Loss) per Diluted Share to net income (loss) and net income (loss) per diluted share, the most directly
comparable GAAP financial measures, are included in the press release, which is furnished as Exhibit 99.1 hereto. The Company presents
these non-GAAP financial measures in order to provide transparency to its investors because they are measures that management uses to
assess both management performance and the financial performance of its operations and to allocate resources. In addition, management
believes that these measures may assist investors with understanding and evaluating the Company’s initiatives to drive improved
financial performance and enables investors to supplementally compare its operating performance with the operating performance of its
competitors including with those of its competitors having different capital structures.
The Company believes Adjusted EBITDA serves as
an appropriate measure in evaluating the performance of its business and helps its investors better compare the Company’s operating
performance with its competitors. The Company defines Adjusted EBITDA as net income (loss) excluding the impact of income taxes, interest
expense, depreciation and amortization, LIFO adjustments, charges or credits for facility exit and impairment, goodwill and intangible
asset impairment charges, inventory write-downs related to store closings, gains or losses on debt retirements and modifications and other
items (including stock-based compensation expense, merger and acquisition-related costs, non-recurring litigation and other contractual
settlements, severance, restructuring-related costs, costs related to facility closures, gain or loss on sale of assets, the gain or loss
on Bartell acquisition, and the change in estimate related to manufacturer rebate receivables). The Company references this non-GAAP financial
measure frequently in its decision-making because it provides supplemental information that facilitates internal comparisons to historical
periods and external comparisons to competitors. In addition, incentive compensation is based in part on Adjusted EBITDA and the Company
bases certain of its forward-looking estimates and budgets on Adjusted EBITDA. While the Company has excluded certain of these items from
historical non-GAAP financial measures, there is no guarantee that the items excluded from non-GAAP financial measures will not continue
into future periods. For instance, the Company expects to continue to experience charges for facility exit and impairment charges and
inventory write-downs related to store closures as the Company continues to complete a multi-year strategic initiative designed to improve
overall performance. The Company also expects to continue to experience and report restructuring-related charges associated with continued
execution of its strategic initiatives.
The Company defines Adjusted Net Income (Loss)
as net income (loss) excluding amortization expense, merger and acquisition-related costs, non-recurring litigation and other contractual
settlements, gains or losses on debt retirements and modifications, LIFO adjustments, goodwill and intangible asset impairment charges,
restructuring-related costs, the gain or loss on Bartell acquisition, and the change in estimate related to manufacturer rebate receivables.
The Company calculates Adjusted Net Income (Loss) per Diluted Share using the Company’s above-referenced definition of Adjusted
Net Income (Loss). The Company believes Adjusted Net Income (Loss) and Adjusted Net Income (Loss) per Diluted Share serve as appropriate
measures to be used in evaluating the performance of its business and help its investors better compare the Company’s operating
performance over multiple periods.
In addition, the add back of LIFO (credits) charges
when calculating Adjusted EBITDA, Adjusted Net Income (Loss) and Adjusted Net Income (Loss) per Diluted Share removes the entire impact
of LIFO (credits) charges, and effectively reflects Rite Aid’s results as if the Company was on a FIFO inventory basis.
Adjusted EBITDA, Adjusted Net Income (Loss) and
Adjusted Net Income (Loss) per Diluted Share should not be considered in isolation from, and are not intended to represent alternative
measures of, operating results or of cash flows from operating activities, as determined in accordance with GAAP. The Company’s
definitions of Adjusted EBITDA, Adjusted Net Income (Loss) and Adjusted Net Income (Loss) per Diluted Share may not be comparable to similarly
titled measurements reported by other companies, including companies in its industry, or similar terms in the Company’s debt facilities.
In addition, a copy of the Company’s Earnings
Release Supplement for the first quarter of fiscal 2024 is being furnished as Exhibit 99.2 to this Form 8-K.
The information (including Exhibits 99.1 and 99.2)
being furnished pursuant to this “Item 2.02. Results of Operations and Financial Condition” shall not be deemed to be “filed”
for the purposes of Section 18 of the Securities Exchange Act of 1934, as amended, or the Exchange Act, or otherwise subject to the
liabilities of that section and shall not be deemed to be incorporated by reference into any filing under the Securities Act of 1933,
as amended, or the Securities Act, or the Exchange Act regardless of any general incorporation language in such filing.
Item 9.01. Financial Statements and Exhibits.
(d) Exhibits.
SIGNATURES
Pursuant to the requirements of the Securities
Exchange Act of 1934, the registrant has duly caused this report to be signed on its behalf by the undersigned hereunto duly authorized.
| | RITE
AID CORPORATION |
| | |
| Dated: June 29,
2023 | By: |
/s/
Matthew C. Schroeder |
| | Name: |
Matthew
C. Schroeder |
| | Title: |
Executive
Vice President and Chief Financial Officer |
Exhibit 99.1

FOR IMMEDIATE RELEASE
| INVESTORS: |
MEDIA: |
| Byron Purcell |
Joy Errico |
| (717) 975-3710 |
(203)970-5559 |
| investor@riteaid.com |
press@riteaid.com |
Rite Aid Corporation Reports Fiscal 2024 First
Quarter Results
| · | Revenues of $5.7 Billion, Compared to Prior Year Revenues of $6.0 Billion |
| · | Retail Comparable Same Store Prescriptions Increased 4.7 Percent – Comparable Same Store Prescriptions, Excluding COVID Impact, Increased
7.4 Percent |
| · | Net Loss of $306.7 Million Compared to Prior Year Net Loss of $110.2 Million – Increase Largely Attributable to a Goodwill
Impairment Charge at Elixir |
| · | Adjusted EBITDA of $91.7 Million, Compared to Prior Year Adjusted EBITDA of $100.1 Million |
| · | Updates Fiscal 2024 Outlook |
PHILADELPHIA -- (June 29, 2023) -- Rite Aid Corporation (NYSE:
RAD) today reported operating results for its first fiscal quarter ended June 3, 2023.
“Our first quarter results were driven by strong script growth,
solid pharmacy margins and early progress with our turnaround program, which offset underperformance on front-end sales in the Retail
Pharmacy Segment and a higher-than-expected medical loss ratio at Elixir Insurance,” said Elizabeth “Busy” Burr, interim
chief executive officer. “To help mitigate this, we are making targeted reductions to SG&A and capital expenditures over the
remainder of the year. Importantly, we made good progress on turnaround initiatives across key areas of the business, and we continue
to believe we are on track to achieve Adjusted EBITDA growth in fiscal years 2025 and 2026.”
Consolidated First Quarter Summary
| | |
Thirteen Week
Period Ended | | |
Thirteen Week
Period Ended | |
| (dollars in thousands) | |
June 3, 2023 | | |
May 28, 2022 | |
| Revenues | |
$ | 5,653,162 | | |
$ | 6,014,583 | |
| Net loss | |
| (306,718 | ) | |
| (110,191 | ) |
| Adjusted EBITDA | |
| 91,715 | | |
| 100,130 | |
-More-
Rite Aid FY 2024 Q1 Press Release - page 2
For the first quarter, the Company reported a net loss of $306.7
million, or $5.56 loss per share, Adjusted net loss of $40.1 million, or $0.73 loss per share, and Adjusted EBITDA of $91.7 million,
or 1.6 percent of revenues.
Revenues for the quarter were $5.65 billion compared to revenues
of $6.01 billion in the prior year’s quarter, largely due to the reduction in the Company’s Prescription Drug Plan (PDP)
membership and the loss of commercial clients at Elixir. The reduction in revenues for the first quarter was partially offset by an
increase in Retail Pharmacy Segment revenues, driven by an increase in pharmacy sales.
First quarter net loss was $306.7 million, or $5.56 loss per
share, compared to last year’s first quarter net loss of $110.2 million, or $2.03 loss per share. The increase in net loss is
primarily due to a non-cash charge to write down Elixir goodwill, driven by performance in Elixir Insurance’s Individual
Part D Plan and the Company’s decision to exit the Individual Part D market beginning in January 2024. Other
factors contributing to the higher net loss were higher restructuring-related charges, a lower gain on sale of assets, higher
interest expense and a decrease in Adjusted EBITDA. These were partially offset by decreased facility exit and impairment
charges.
Retail Pharmacy Segment
| | |
Thirteen Week
Period Ended | | |
Thirteen Week
Period Ended | |
| (dollars in thousands) | |
June 3, 2023 | | |
May 28, 2022 | |
| Revenues | |
$ | 4,492,329 | | |
$ | 4,345,356 | |
| Adjusted EBITDA | |
| 70,049 | | |
| 73,682 | |
Retail Pharmacy Segment revenues increased 3.4 percent over the prior
year quarter driven by an increase in both acute and maintenance prescriptions, partially offset by a reduction in COVID vaccine and testing
revenue as well as store closures. Same store sales for the first quarter increased 8.4 percent over the prior year period, consisting
of a 13.3 percent increase in pharmacy sales, partially offset by a 4.4 percent decrease in front-end sales. Front-end same store sales,
excluding cigarettes and tobacco products, decreased 3.8 percent. The number of prescriptions filled in same stores, adjusted to 30-day
equivalents, increased 4.7 percent over the prior year period. Total same store prescriptions, excluding COVID immunizations and tests,
increased 7.4 percent, with same store maintenance prescriptions increasing 7.6 percent and other same store acute prescriptions increasing
6.8 percent. Prescription sales accounted for 73.9 percent of total drugstore sales. Total store count at the end of the first quarter
was 2,284.
Retail Pharmacy Segment Adjusted EBITDA was $70.0 million, or 1.6 percent
of revenues, for the first quarter compared to last year’s first quarter Adjusted EBITDA of $73.7 million, or 1.7 percent of revenues.
The decline in Adjusted EBITDA was due to a decrease in Adjusted EBITDA gross profit of $8.4 million, partially offset by decreased Adjusted
EBITDA selling, general and administrative (SG&A) expenses of $4.8 million. Gross profit was negatively impacted by the decline in
front-end sales, COVID vaccinations and testing and increased shrink expense, partially offset by an increase in prescriptions sold, better
than expected recovery rates and the impact of generic drug settlements. SG&A expenses benefited from lower occupancy and other operating
costs due to store closures and cost control initiatives.
-More-
Rite Aid FY 2024 Q1 Press Release - page 3
Pharmacy Services Segment
| | |
Thirteen Week
Period Ended | | |
Thirteen Week
Period Ended | |
| (dollars in thousands) | |
June 3, 2023 | | |
May 28, 2022 | |
| Revenues | |
$ | 1,196,154 | | |
$ | 1,725,857 | |
| Adjusted EBITDA | |
| 21,666 | | |
| 26,448 | |
Pharmacy Services Segment revenues were $1.2 billion for the quarter,
a decrease of 30.7 percent compared to the prior year quarter. The decrease in revenues was primarily the result of a decrease in Elixir
Individual Part D Insurance membership due to a change in the Company’s pricing structure and loss of commercial clients, partially
offset by increased utilization and higher drugs costs.
Pharmacy Services Segment Adjusted EBITDA was $21.7 million, or 1.8
percent of revenues, for the first quarter compared to last year’s first quarter Adjusted EBITDA of $26.4 million, or 1.5 percent
of revenues. The decrease in Adjusted EBITDA resulted from the lower membership as mentioned above and an increase in the medical loss
ratio at Elixir Insurance, partially offset by improved procurement economics and reductions in SG&A expense.
Outlook for Fiscal 2024
The following fiscal 2024 outlook is forward-looking information, reflecting
the Company’s expectations as of June 29, 2023, and subject to a range of assumptions and uncertainties described below and
in documents that the Company files or furnishes with the Securities and Exchange Commission (the “SEC”).
Based on recent business trends, the Company is reducing total company
Adjusted EBITDA guidance by $10 million to be between $330 million and $360 million. Pharmacy Services Segment Adjusted EBITDA expectations
are being lowered by $10 million to be between $90 million and $100 million due to higher drug costs and a higher medical loss ratio at
Elixir Insurance. Retail Pharmacy Segment Adjusted EBITDA remains unchanged and is expected to be between $240 million and $260 million,
which is a result of tougher front-end sales trends balanced with cost savings.
Total revenues are expected to be between $22.6 billion and $23.0 billion
in fiscal 2024. Retail Pharmacy Segment revenue is expected to be between $18.0 billion and $18.3 billion, and Pharmacy Services Segment
revenue is expected to be between $4.6 billion and $4.7 billion, net of any intercompany revenues to the Retail Pharmacy Segment.
Net loss is expected to be between approximately $650 million and $680
million.
Adjusted net loss per share is expected to be between $4.29 and $4.78.
Capital expenditures are now expected to be approximately $175 million,
with a focus on investments in technology, prescription file purchases and distribution center automation.
Conference Call Broadcast
Rite Aid will hold an analyst call at 8:30 a.m. Eastern Time
today with remarks by Rite Aid's management team. The call will be broadcast via the Internet at https://investors.riteaid.com.
The telephone replay will be available beginning at 12:00 p.m. Eastern Time on June 29, 2023, and ending at 11:59
p.m. Eastern Time on July 29, 2023. To access the replay of the call, telephone (800) 770-2030 or (647) 362-9199 and enter
the seven-digit reservation number 9029129. The webcast replay of the call will also be available at https://investors.riteaid.com
starting at 12 p.m. Eastern Time today. The playback will be available until the Company’s next conference call.
-More-
Rite Aid FY 2024 Q1 Press
Release - page 4
About Rite Aid Corporation
Rite Aid Corporation is on the
front lines of delivering healthcare services and retail products to Americans 365 days a year. Our pharmacists are uniquely positioned
to engage with customers and improve their health outcomes. We provide an array of whole being health products and services for the entire
family through over 2,200 retail pharmacy locations across 17 states. Through Elixir, we provide pharmacy benefits and services to millions
of members nationwide. For more information, visit www.riteaid.com.
Cautionary Statement Regarding Forward-Looking Statements
Statements in this release that are not
historical, are forward-looking statements made pursuant to the safe harbor provisions of the Private Securities Litigation Reform Act
of 1995. Such statements include, but are not limited to, statements regarding Rite Aid's outlook and guidance for fiscal 2024; Rite Aid’s
plan to reduce SG&A expense and capital expenditure spend; the continued impact of the global coronavirus (COVID-19) pandemic on Rite
Aid’s business; the continued impact of negative trends in Rite Aid’s front end sales and gross profit in the retail segment;
and any assumptions underlying any of the foregoing. Words such as "anticipate," "believe," "continue,"
"could," "estimate," "expect," "intend," "may," "plan," "predict,"
"project," "should," and "will" and variations of such words and similar expressions are intended to identify
such forward-looking statements.
These forward-looking statements are not guarantees
of future performance and involve risks, assumptions and uncertainties, including, but not limited to: risks related to the prolonged
impact of the COVID-19 global pandemic and the emerging new variants, including the government responses thereto; the impact of COVID-19
on our workforce, operations, stores, expenses, and supply chain, and the operations or behaviors of our customers, suppliers and business
partners; our ability to successfully implement our turnaround program and other strategies; the impact of our high level of indebtedness,
the ability to refinance such indebtedness on acceptable terms (including the impact of rising interest rates, market volatility,
and continuing actions by the United States Federal Reserve) and our ability to satisfy our obligations and the other covenants contained
in our debt agreements; outcome of pending or new litigation and government investigations, including, without limitation, those related
to opioids, “usual and customary” pricing, government payer programs or other matters; our ability to monetize (and on reasonably
available terms) the CMS receivable created in our Part D business; general competitive, economic, industry, market, political (including
healthcare reform) and regulatory conditions (including changes to laws or regulations relating to labor or wages), including continued
impacts of inflation or other pricing environment factors on our costs, liquidity and our ability to pass on price increases to our customers,
including as a result of inflationary and deflationary pressures, a decline in consumer financial position, whether due to inflation or
other factors, as well as other factors specific to the markets in which we operate; the impact of private and public third-party payers
continued reduction in prescription drug reimbursements, new or disruptive business models or practices, and efforts to encourage mail
order; our ability to manage expenses and our investments in working capital; our ability to achieve the benefits of our efforts to reduce
the costs of our generic and other drugs; our ability to achieve cost savings and other benefits of our restructuring efforts within our
anticipated timeframe, if at all; the outcome of our continuing efforts to monitor and comply with applicable laws, orders, regulations,
policies and procedures; and our ability to partner and have relationships with health plans and health systems; and any requirement to
incur additional impairment charges.
These and other risks, assumptions and
uncertainties are more fully described in Item 1A (Risk Factors) of our most recent Annual Report on Form 10-K and in other
documents that we file or furnish with the Securities and Exchange Commission (the “SEC”), which you are encouraged to
read. To the extent that COVID-19 adversely affects our business and financial results, it may also have the effect of heightening
many of such risk factors.
Should one or more of these risks or uncertainties
materialize, or should underlying assumptions prove incorrect, actual results may vary materially from those indicated or anticipated
by such forward-looking statements. Accordingly, you are cautioned not to rely on these forward-looking statements, which speak only as
of the date they are made.
-More-
Rite Aid FY 2024 Q1 Press Release - page 5
The degree to which COVID-19 may adversely
affect Rite Aid’s results and operations, including its ability to achieve its outlook for fiscal 2024 guidance, will depend on
numerous evolving factors and future developments, which are highly uncertain. As a result, the impact on Rite Aid’s financial and
operating results cannot be reasonably estimated with specificity at this time, but the impact could be material. Rite Aid expressly disclaims
any current intention, and assumes no duty, to update publicly any forward-looking statement after the distribution of this release, whether
as a result of new information, future events, changes in assumptions or otherwise.
All references
to “Company” and “Rite Aid” as used throughout this release refer to Rite Aid Corporation and its affiliates.-
Reconciliation of Non-GAAP Financial Measures
Rite Aid separately reports financial results
on the basis of Adjusted Net Income (Loss), Adjusted Net Income (Loss) per Diluted Share, Adjusted EBITDA, Adjusted EBITDA Gross Profit
and Adjusted EBITDA SG&A, which are non-GAAP financial measures. See the attached tables for a reconciliation of Adjusted Net Income
(Loss), Adjusted Net Income (Loss) per Diluted Share and Adjusted EBITDA to net income (loss), and net income (loss) per diluted share,
which are the most directly comparable GAAP financial measures. Adjusted Net Income (Loss) and Adjusted Net Income (Loss) per Diluted
Share exclude amortization expense, merger and acquisition-related costs, non-recurring litigation and other contractual settlements,
gains or losses on debt modifications and retirements, LIFO adjustments, goodwill and intangible asset impairment charges, restructuring-related
costs, the gain or loss on Bartell acquisition, and the change in estimate related to manufacturer rebate receivables. Rite Aid believes
Adjusted Net Income (Loss) and Adjusted Net Income (Loss) per Diluted Share serve as appropriate measures to be used in evaluating the
performance of its business and help its investors better compare its operating performance over multiple periods.
Adjusted EBITDA is defined as net income (loss)
excluding the impact of income taxes, interest expense, depreciation and amortization, LIFO adjustments, charges or credits for facility
exit and impairment, goodwill and intangible asset impairment charges, inventory write-downs related to store closings, gains or losses
on debt modifications and retirements, and other items (including stock-based compensation expense, merger and acquisition-related costs,
non-recurring litigation and other contractual settlements, severance, restructuring-related costs, costs related to facility closures,
gain or loss on sale of assets, the gain or loss on Bartell acquisition, and the change in estimate related to manufacturer rebate receivables).
The add back of LIFO (credit) charge when calculating Adjusted EBITDA, Adjusted Net Income (Loss) and Adjusted Net Income (Loss) per Diluted
Share removes the entire impact of LIFO (credits) charges, and effectively reflects Rite Aid's results as if the company was on a FIFO
inventory basis. Rite Aid believes Adjusted EBITDA serves as an appropriate measure in evaluating the performance of its business and
helps its investors better compare its operating performance with its competitors.
Adjusted EBITDA Gross Profit includes LIFO
adjustments, depreciation and amortization (COGS portion only) and other items. See the attached tables for a reconciliation of
Adjusted EBITDA Gross Profit to Revenue, which is the most directly comparable GAAP financial measure. Adjusted EBITDA SG&A
excludes depreciation and amortization (SG&A portion only), stock-based compensation expense, merger and acquisition-related
costs, non-recurring litigation and other contractual settlements, and other items. See the attached tables for a reconciliation of
Adjusted EBITDA SG&A to Revenue, which is the most directly comparable GAAP financial measure. The Company believes Adjusted
EBITDA Gross Profit and Adjusted EBITDA SG&A serve as appropriate measures in evaluating the performance of its business and
helps its investors better compare its operating performance with its competitors.
-More-
Rite Aid FY 2024 Q1 Press Release - page 6
The Company presents these non-GAAP financial
measures in order to provide transparency to its investors because they are measures that management uses to assess both management performance
and the financial performance of its operations and to allocate resources. In addition, management believes that these measures may assist
investors with understanding and evaluating the Company’s initiatives to drive improved financial performance and enables investors
to supplementally compare its operating performance with the operating performance of its competitors including with those of its competitors
having different capital structures. While the Company has excluded certain of these items from historical non-GAAP financial measures,
there is no guarantee that the items excluded from non-GAAP financial measures will not continue into future periods. For instance, the
Company expects to continue to experience charges for facility exit and impairment charges and inventory write-downs related to store
closures as the Company continues to complete a multi-year strategic initiative designed to improve overall performance. The Company also
expects to continue to experience and report restructuring-related charges associated with continued execution of its strategic initiatives.
Adjusted EBITDA, Adjusted Net Income (Loss),
Adjusted Net Income (Loss) per Diluted Share or other non-GAAP measures should not be considered in isolation from, and are not intended
to represent an alternative measure of, operating results or of cash flows from operating activities, as determined in accordance with
GAAP. The Company’s definition of these non-GAAP measures may not be comparable to similarly titled measurements reported by other
companies, including companies in its industry.
###
RITE AID CORPORATION AND SUBSIDIARIES
CONSOLIDATED BALANCE SHEETS
(Dollars in thousands)
(unaudited)
| | |
June 3, 2023 | | |
March 4, 2023 | |
| ASSETS | |
| | | |
| | |
| Current assets: | |
| | | |
| | |
| Cash and cash equivalents | |
$ | 135,527 | | |
$ | 157,151 | |
| Accounts receivable, net | |
| 1,392,348 | | |
| 1,149,958 | |
| Inventories, net of LIFO reserve of $547,432 and $539,932 | |
| 1,950,413 | | |
| 1,900,744 | |
| Prepaid expenses and other current assets | |
| 171,175 | | |
| 93,194 | |
| Total current assets | |
| 3,649,463 | | |
| 3,301,047 | |
| Property, plant and equipment, net | |
| 892,540 | | |
| 907,771 | |
| Operating lease right-of-use assets | |
| 2,457,110 | | |
| 2,497,206 | |
| Goodwill | |
| 356,436 | | |
| 507,936 | |
| Other intangibles, net | |
| 244,883 | | |
| 250,112 | |
| Deferred tax assets | |
| 12,368 | | |
| 12,368 | |
| Other assets | |
| 37,618 | | |
| 50,922 | |
| Total assets | |
$ | 7,650,418 | | |
$ | 7,527,362 | |
| | |
| | | |
| | |
| LIABILITIES AND STOCKHOLDERS' (DEFICIT) EQUITY | |
| | | |
| | |
| Current liabilities: | |
| | | |
| | |
| Current maturities of long-term debt and lease financing obligations | |
$ | 6,060 | | |
$ | 6,332 | |
| Accounts payable | |
| 1,505,741 | | |
| 1,494,611 | |
| Accrued salaries, wages and other current liabilities | |
| 772,058 | | |
| 724,529 | |
| Current portion of operating lease liabilities | |
| 488,712 | | |
| 502,403 | |
| Total current liabilities | |
| 2,772,571 | | |
| 2,727,875 | |
| Long-term debt, less current maturities | |
| 3,327,970 | | |
| 2,925,258 | |
| Long-term operating lease liabilities | |
| 2,345,277 | | |
| 2,372,943 | |
| Lease financing obligations, less current maturities | |
| 12,151 | | |
| 12,580 | |
| Other noncurrent liabilities | |
| 139,897 | | |
| 130,482 | |
| Total liabilities | |
| 8,597,866 | | |
| 8,169,138 | |
| | |
| | | |
| | |
| Commitments and contingencies | |
| - | | |
| - | |
| Stockholders' (deficit) equity: | |
| | | |
| | |
| Common stock | |
| 56,708 | | |
| 56,629 | |
| Additional paid-in capital | |
| 5,918,931 | | |
| 5,917,964 | |
| Accumulated deficit | |
| (6,908,235 | ) | |
| (6,601,517 | ) |
| Accumulated other comprehensive loss | |
| (14,852 | ) | |
| (14,852 | ) |
| Total stockholders' (deficit) equity | |
| (947,448 | ) | |
| (641,776 | ) |
| Total liabilities and stockholders' (deficit) equity | |
$ | 7,650,418 | | |
$ | 7,527,362 | |
RITE AID CORPORATION AND SUBSIDIARIES
CONSOLIDATED STATEMENTS OF OPERATIONS
(Dollars in thousands, except per share amounts)
(unaudited)
| | |
Thirteen weeks ended
June 3, 2023 | | |
Thirteen weeks ended
May 28, 2022 | |
| Revenues | |
$ | 5,653,162 | | |
$ | 6,014,583 | |
| Costs and expenses: | |
| | | |
| | |
| Cost of revenues | |
| 4,474,636 | | |
| 4,817,854 | |
| Selling, general and administrative expenses | |
| 1,255,223 | | |
| 1,217,929 | |
| Facility exit and impairment charges | |
| 20,001 | | |
| 66,571 | |
| Goodwill and intangible asset impairment charges | |
| 151,500 | | |
| - | |
| Interest expense | |
| 65,220 | | |
| 48,119 | |
| Gain on sale of assets, net | |
| (8,193 | ) | |
| (29,196 | ) |
| | |
| | | |
| | |
| | |
| 5,958,387 | | |
| 6,121,277 | |
| | |
| | | |
| | |
| Loss before income taxes | |
| (305,225 | ) | |
| (106,694 | ) |
| Income tax expense | |
| 1,493 | | |
| 3,497 | |
| Net loss | |
$ | (306,718 | ) | |
$ | (110,191 | ) |
| | |
| | | |
| | |
| Basic and diluted loss per share: | |
| | | |
| | |
| | |
| | | |
| | |
| Numerator for loss per share: | |
| | | |
| | |
| Net loss attributable to common stockholders - basic and diluted | |
$ | (306,718 | ) | |
$ | (110,191 | ) |
| | |
| | | |
| | |
| Denominator: | |
| | | |
| | |
| Basic and diluted weighted average shares | |
| 55,179 | | |
| 54,348 | |
| | |
| | | |
| | |
| Basic and diluted loss per share | |
$ | (5.56 | ) | |
$ | (2.03 | ) |
RITE AID CORPORATION AND SUBSIDIARIES
CONSOLIDATED STATEMENTS OF CASH FLOWS
(Dollars in thousands)
(unaudited)
| | |
Thirteen weeks ended
June 3, 2023 | | |
Thirteen weeks ended
May 28, 2022 | |
| OPERATING ACTIVITIES: | |
| | | |
| | |
| Net loss | |
$ | (306,718 | ) | |
$ | (110,191 | ) |
| Adjustments to reconcile to net cash used in operating activities: | |
| | | |
| | |
| Depreciation and amortization | |
| 65,895 | | |
| 70,073 | |
| Facility exit and impairment charges | |
| 20,001 | | |
| 66,571 | |
| Goodwill and intangible asset impairment charges | |
| 151,500 | | |
| - | |
| LIFO charge | |
| 7,500 | | |
| - | |
| Change in allowances for uncollectible accounts receivable | |
| 4,004 | | |
| 3,763 | |
| Gain on sale of assets, net | |
| (8,193 | ) | |
| (29,196 | ) |
| Stock-based compensation expense | |
| 1,081 | | |
| 3,334 | |
| Changes in operating assets and liabilities: | |
| | | |
| | |
| Accounts receivable | |
| (246,838 | ) | |
| (104,458 | ) |
| Inventories | |
| (57,169 | ) | |
| (15,827 | ) |
| Accounts payable | |
| 20,558 | | |
| (137,572 | ) |
| Operating lease right-of-use assets and operating lease liabilities | |
| (10,857 | ) | |
| (14,812 | ) |
| Other assets | |
| (64,687 | ) | |
| 751 | |
| Other liabilities | |
| 51,385 | | |
| 15,327 | |
| Net cash used in operating activities | |
| (372,538 | ) | |
| (252,237 | ) |
| INVESTING ACTIVITIES: | |
| | | |
| | |
| Payments for property, plant and equipment | |
| (35,891 | ) | |
| (73,176 | ) |
| Intangible assets acquired | |
| (11,612 | ) | |
| (12,248 | ) |
| Proceeds from dispositions of assets and investments | |
| 8,157 | | |
| 30,839 | |
| Net cash used in investing activities | |
| (39,346 | ) | |
| (54,585 | ) |
| FINANCING ACTIVITIES: | |
| | | |
| | |
| Net proceeds from revolver | |
| 400,000 | | |
| 291,000 | |
| Principal payments on long-term debt | |
| (1,009 | ) | |
| (977 | ) |
| Change in zero balance cash accounts | |
| (8,272 | ) | |
| 33,691 | |
| Financing fees paid for early debt redemption | |
| (51 | ) | |
| - | |
| Payments for taxes related to net share settlement of equity awards | |
| (46 | ) | |
| (553 | ) |
| Deferred financing costs paid | |
| (362 | ) | |
| - | |
| Net cash provided by financing activities | |
| 390,260 | | |
| 323,161 | |
| (Decrease) increase in cash and cash equivalents | |
| (21,624 | ) | |
| 16,339 | |
| Cash and cash equivalents, beginning of period | |
| 157,151 | | |
| 39,721 | |
| Cash and cash equivalents, end of period | |
$ | 135,527 | | |
$ | 56,060 | |
RITE AID CORPORATION AND SUBSIDIARIES
SUPPLEMENTAL SEGMENT OPERATING INFORMATION
(Dollars in thousands)
(unaudited)
| | |
Thirteen weeks ended
June 3, 2023 | | |
Thirteen weeks ended
May 28, 2022 | |
| Retail Pharmacy Segment | |
| | | |
| | |
| Revenues (a) | |
$ | 4,492,329 | | |
$ | 4,345,356 | |
| Cost of revenues (a) | |
| 3,405,466 | | |
| 3,247,999 | |
| Gross profit | |
| 1,086,863 | | |
| 1,097,357 | |
| LIFO charge | |
| 7,500 | | |
| - | |
| FIFO gross profit | |
| 1,094,363 | | |
| 1,097,357 | |
| Adjusted EBITDA gross profit | |
| 1,098,268 | | |
| 1,106,652 | |
| | |
| | | |
| | |
| Gross profit as a percentage of revenues | |
| 24.19 | % | |
| 25.25 | % |
| LIFO charge as a percentage of revenues | |
| 0.17 | % | |
| 0.00 | % |
| FIFO gross profit as a percentage of revenues | |
| 24.36 | % | |
| 25.25 | % |
| Adjusted EBITDA gross profit as a percentage of revenues | |
| 24.45 | % | |
| 25.47 | % |
| | |
| | | |
| | |
| Selling, general and administrative expenses | |
| 1,172,573 | | |
| 1,117,214 | |
| Adjusted EBITDA selling, general and administrative expenses | |
| 1,028,219 | | |
| 1,032,970 | |
| Selling, general and administrative expenses as a percentage of revenues | |
| 26.10 | % | |
| 25.71 | % |
| Adjusted EBITDA selling, general and administrative expenses as a percentage of revenues | |
| 22.89 | % | |
| 23.77 | % |
| | |
| | | |
| | |
| Cash interest expense | |
| 61,767 | | |
| 45,244 | |
| Non-cash interest expense | |
| 3,453 | | |
| 2,875 | |
| Total interest expense | |
| 65,220 | | |
| 48,119 | |
| | |
| | | |
| | |
| Adjusted EBITDA | |
| 70,049 | | |
| 73,682 | |
| Adjusted EBITDA as a percentage of revenues | |
| 1.56 | % | |
| 1.70 | % |
| | |
| | | |
| | |
| Pharmacy Services Segment | |
| | | |
| | |
| Revenues (a) | |
$ | 1,196,154 | | |
$ | 1,725,857 | |
| Cost of revenues (a) | |
| 1,104,491 | | |
| 1,626,485 | |
| Gross profit | |
| 91,663 | | |
| 99,372 | |
| | |
| | | |
| | |
| Gross profit as a percentage of revenues | |
| 7.66 | % | |
| 5.76 | % |
| | |
| | | |
| | |
| Adjusted EBITDA | |
| 21,666 | | |
| 26,448 | |
| Adjusted EBITDA as a percentage of revenues | |
| 1.81 | % | |
| 1.53 | % |
(a) -
Revenues and cost of revenues include $35,321 and $56,630 of inter-segment activity for the thirteen weeks ended June 3, 2023
and May 28, 2022, respectively, that is eliminated in consolidation.
RITE
AID CORPORATION AND SUBSIDIARIES
SUPPLEMENTAL INFORMATION
RECONCILIATION OF NET LOSS TO ADJUSTED EBITDA
(In thousands)
(unaudited)
| | |
Thirteen weeks ended
June 3, 2023 | | |
Thirteen weeks ended
May 28, 2022 | |
| Reconciliation of net loss to adjusted EBITDA: | |
| | | |
| | |
| Net loss | |
$ | (306,718 | ) | |
$ | (110,191 | ) |
| Adjustments: | |
| | | |
| | |
| Interest expense | |
| 65,220 | | |
| 48,119 | |
| Income tax expense | |
| 1,493 | | |
| 3,497 | |
| Depreciation and amortization | |
| 65,895 | | |
| 70,073 | |
| LIFO charge | |
| 7,500 | | |
| - | |
| Facility exit and impairment charges | |
| 20,001 | | |
| 66,571 | |
| Goodwill and intangible asset impairment charges | |
| 151,500 | | |
| - | |
| Stock-based compensation expense | |
| 1,081 | | |
| 3,334 | |
| Restructuring-related costs | |
| 78,130 | | |
| 22,646 | |
| Inventory write-downs related to store closings | |
| 2,057 | | |
| 7,955 | |
| Litigation and other contractual settlements | |
| 11,050 | | |
| 18,271 | |
| Gain on sale of assets, net | |
| (8,193 | ) | |
| (29,196 | ) |
| Other | |
| 2,699 | | |
| (949 | ) |
| Adjusted EBITDA | |
$ | 91,715 | | |
$ | 100,130 | |
| Percent of revenues | |
| 1.62 | % | |
| 1.66 | % |
RITE AID CORPORATION AND SUBSIDIARIES
SUPPLEMENTAL INFORMATION
ADJUSTED NET LOSS
(Dollars in thousands, except per share amounts)
(unaudited)
| | |
Thirteen weeks ended
June 3, 2023 | | |
Thirteen weeks ended
May 28, 2022 | |
| Net loss | |
$ | (306,718 | ) | |
$ | (110,191 | ) |
| Add back - Income tax expense | |
| 1,493 | | |
| 3,497 | |
| Loss before income taxes | |
| (305,225 | ) | |
| (106,694 | ) |
| | |
| | | |
| | |
| Adjustments: | |
| | | |
| | |
| Amortization expense | |
| 17,133 | | |
| 20,626 | |
| LIFO charge | |
| 7,500 | | |
| - | |
| Goodwill and intangible asset impairment charges | |
| 151,500 | | |
| - | |
| Restructuring-related costs | |
| 78,130 | | |
| 22,646 | |
| Litigation and other contractual settlements | |
| 11,050 | | |
| 18,271 | |
| | |
| | | |
| | |
| Adjusted loss before income taxes | |
| (39,912 | ) | |
| (45,151 | ) |
| | |
| | | |
| | |
| Adjusted income tax expense (a) | |
| 195 | | |
| 1,490 | |
| Adjusted net loss | |
$ | (40,107 | ) | |
$ | (46,641 | ) |
| | |
| | | |
| | |
| Adjusted net loss per diluted share: | |
| | | |
| | |
| | |
| | | |
| | |
| Numerator for adjusted net loss per diluted share: | |
| | | |
| | |
| Adjusted net loss | |
$ | (40,107 | ) | |
$ | (46,641 | ) |
| | |
| | | |
| | |
| Denominator: | |
| | | |
| | |
| Basic and diluted weighted average shares | |
| 55,179 | | |
| 54,348 | |
| | |
| | | |
| | |
| Net loss per diluted share | |
$ | (5.56 | ) | |
$ | (2.03 | ) |
| | |
| | | |
| | |
| Adjusted net loss per diluted share | |
$ | (0.73 | ) | |
$ | (0.86 | ) |
(a) The fiscal year 2024 and 2023 adjustments to the income tax provision include adjustments to the GAAP basis tax provision commensurate with non-GAAP adjustments and certain discrete tax items, when applicable, was used for the thirteen weeks ended June 3, 2023 and May 28, 2022.
RITE AID CORPORATION AND SUBSIDIARIES
SUPPLEMENTAL INFORMATION
RECONCILIATION OF ADJUSTED EBITDA GROSS PROFIT AND RECONCILIATION OF ADJUSTED EBITDA SELLING,
GENERAL AND ADMINISTRATIVE EXPENSES- RETAIL PHARMACY SEGMENT
(In thousands)
(unaudited)
| | |
Thirteen weeks ended
June 3, 2023 | | |
Thirteen weeks ended
May 28, 2022 | |
| Reconciliation of adjusted EBITDA gross profit: | |
| | |
| |
| Revenues | |
$ | 4,492,329 | | |
$ | 4,345,356 | |
| Gross Profit | |
| 1,086,863 | | |
| 1,097,357 | |
| Addback: | |
| | | |
| | |
| LIFO charge | |
| 7,500 | | |
| - | |
| Depreciation and amortization (cost of goods sold portion only) | |
| 2,642 | | |
| 2,893 | |
| Other | |
| 1,263 | | |
| 6,402 | |
| Adjusted EBITDA gross profit | |
$ | 1,098,268 | | |
$ | 1,106,652 | |
| Percent of revenues | |
| 24.45 | % | |
| 25.47 | % |
| | |
| | | |
| | |
| Reconciliation of adjusted EBITDA selling, general and administrative expenses: | |
| | | |
| | |
| Revenues | |
$ | 4,492,329 | | |
$ | 4,345,356 | |
| Selling, general and administrative expenses | |
| 1,172,573 | | |
| 1,117,214 | |
| Less: | |
| | | |
| | |
| Depreciation and amortization (SG&A portion only) | |
| 52,827 | | |
| 53,215 | |
| Stock-based compensation expense | |
| 723 | | |
| 3,102 | |
| Restructuring-related costs | |
| 76,469 | | |
| 17,371 | |
| Litigation and other contractual settlements | |
| 11,050 | | |
| 9,952 | |
| Other | |
| 3,285 | | |
| 604 | |
| Adjusted EBITDA selling, general and administrative expenses | |
$ | 1,028,219 | | |
$ | 1,032,970 | |
| Percent of revenues | |
| 22.89 | % | |
| 23.77 | % |
| | |
| | | |
| | |
| Adjusted EBITDA | |
$ | 70,049 | | |
$ | 73,682 | |
RITE AID CORPORATION AND SUBSIDIARIES
SUPPLEMENTAL INFORMATION
RECONCILIATION OF NET LOSS GUIDANCE TO ADJUSTED EBITDA GUIDANCE
YEAR ENDING MARCH 2, 2024
(In thousands)
(unaudited)
| | |
Guidance Range |
|
| | |
Low | | |
High | |
| Total Revenues | |
$ | 22,600,000 | | |
$ | 23,000,000 | |
| | |
| | | |
| | |
| Pharmacy Services Segment Revenues | |
$ | 4,550,000 | | |
$ | 4,650,000 | |
| | |
| | | |
| | |
| Gross Capital Expenditures | |
$ | 175,000 | | |
$ | 175,000 | |
| | |
| | | |
| | |
| Reconciliation of net loss to adjusted EBITDA: | |
| | | |
| | |
| Net loss | |
$ | (678,500 | ) | |
$ | (651,500 | ) |
| Adjustments: | |
| | | |
| | |
| Interest expense | |
| 273,000 | | |
| 273,000 | |
| Income tax expense | |
| 2,000 | | |
| 5,000 | |
| Depreciation and amortization | |
| 280,000 | | |
| 280,000 | |
| LIFO charge | |
| 30,000 | | |
| 30,000 | |
| Facility exit and impairment charges | |
| 100,000 | | |
| 100,000 | |
| Goodwill and intangible asset impairment charges | |
| 151,500 | | |
| 151,500 | |
| Restructuring-related costs | |
| 155,000 | | |
| 155,000 | |
| Litigation and other contractual settlements | |
| 11,000 | | |
| 11,000 | |
| Gain on sale of assets, net | |
| (9,000 | ) | |
| (9,000 | ) |
| Other | |
| 15,000 | | |
| 15,000 | |
| Adjusted EBITDA | |
$ | 330,000 | | |
$ | 360,000 | |
RITE AID CORPORATION AND SUBSIDIARIES
SUPPLEMENTAL INFORMATION
RECONCILIATION OF NET LOSS GUIDANCE TO ADJUSTED NET LOSS GUIDANCE
YEAR ENDING MARCH 2, 2024
(In thousands)
(unaudited)
| | |
Guidance Range |
|
| | |
Low | | |
High | |
| Net loss | |
$ | (678,500 | ) | |
$ | (651,500 | ) |
| Add back - income tax expense | |
| 2,000 | | |
| 5,000 | |
| Loss before income taxes | |
| (676,500 | ) | |
| (646,500 | ) |
| | |
| | | |
| | |
| Adjustments: | |
| | | |
| | |
| Amortization expense | |
| 68,000 | | |
| 68,000 | |
| LIFO charge | |
| 30,000 | | |
| 30,000 | |
| Goodwill and intangible asset impairment charges | |
| 151,500 | | |
| 151,500 | |
| Restructuring-related costs | |
| 155,000 | | |
| 155,000 | |
| Litigation and other contractual settlements | |
| 11,000 | | |
| 11,000 | |
| | |
| | | |
| | |
| Adjusted loss before adjusted income taxes | |
| (261,000 | ) | |
| (231,000 | ) |
| | |
| | | |
| | |
| Adjusted income tax expense | |
| 2,000 | | |
| 5,000 | |
| Adjusted net loss | |
$ | (263,000 | ) | |
$ | (236,000 | ) |
| | |
| | | |
| | |
| Diluted adjusted net loss per share | |
$ | (4.78 | ) | |
$ | (4.29 | ) |
Exhibit 99.2

Earnings conference call Elizabeth “Busy” Burr Interim Chief Executive Officer Matt Schroeder Chief Financial Officer First Quarter Fiscal 2024 June 29, 2023

Cautionary Statement Regarding Forward Looking Statements Deepen Grow by Driven Initiatives in Core Areas Create Leverage Assets to Develop New Offering 2 Statements in this presentation that are not historical, are forward - looking statements made pursuant to the safe harbor provisions of the Private Securities Litigation Reform Act of 1995 . Such statements include, but are not limited to, statements regarding Rite Aid Corporation’s (the “Company”) outlook and guidance for fiscal 2024 ; the timing and success of the pilot program to reduce abandoned scripts ; the success of the script file program ; our plans to continue to invest in upgraded technology capabilities ; our plans to collaborate with our supplier partners ; the transition of our vendors for perishable consumable items ; the continued impact of the global coronavirus (COVID - 19 ) pandemic on the Company’s business ; and any assumptions underlying any of the foregoing . Words such as "anticipate," "believe," "continue," "could," "estimate," "expect," "intend," "may," "plan," "predict," "project," "should," and "will" and variations of such words and similar expressions are intended to identify such forward - looking statements . These forward - looking statements are not guarantees of future performance and involve risks, assumptions and uncertainties, including, but not limited to : risks related to the prolonged impact of the COVID - 19 global pandemic and the emerging new variants, including the government responses thereto ; the impact of COVID - 19 on our workforce, operations, stores, expenses, and supply chain, and the operations or behaviors of our customers, suppliers and business partners ; our ability to successfully implement our turnaround program and other strategies ; the impact of our high level of indebtedness, the ability to refinance such indebtedness on acceptable terms (including the impact of rising interest rates, market volatility, and continuing actions by the United States Federal Reserve) and our ability to satisfy our obligations and the other covenants contained in our debt agreements ; outcome of pending or new litigation and government investigations, including without limitation, those related to opioids, “usual and customary” pricing, government payer programs or other matters ; our ability to monetize (and on reasonably available terms) the CMS receivable created in our Part D business ; general competitive, economic, industry, market, political (including healthcare reform) and regulatory conditions (including changes to laws or regulations relating to labor or wages), including continued impacts of inflation or other pricing environment factors on our costs, liquidity and our ability to pass on price increases to our customers, including as a result of inflationary and deflationary pressures, a decline in consumer financial position, whether due to inflation or other factors, as well as other factors specific to the markets in which we operate ; the impact of private and public third - party payers continued reduction in prescription drug reimbursements, new or disruptive business models or practices, and efforts to encourage mail order ; our ability to manage expenses and our investments in working capital ; our ability to achieve the benefits of our efforts to reduce the costs of our generic and other drugs ; our ability to achieve cost savings and other benefits of our restructuring efforts within our anticipated timeframe, if at all ; the outcome of our continuing efforts to monitor and comply with applicable laws, orders, regulations, policies and procedures ; our ability to partner and have relationships with health plans and health systems ; and any requirement to incur additional impairment charges . These and other risks, assumptions and uncertainties are more fully described in Item 1 A (Risk Factors) of our most recent Annual Report on Form 10 - K and in other documents that we file or furnish with the Securities and Exchange Commission (the “SEC”), which you are encouraged to read . To the extent that COVID - 19 adversely affects our business and financial results, it may also have the effect of heightening many of such risk factors . Should one or more of these risks or uncertainties materialize, or should underlying assumptions prove incorrect, actual results may vary materially from those indicated or anticipated by such forward - looking statements . Accordingly, you are cautioned not to rely on these forward - looking statements, which speak only as of the date they are made . The degree to which COVID - 19 may adversely affect Rite Aid’s results and operations, including its ability to achieve its outlook for fiscal 2024 guidance, will depend on numerous evolving factors and future developments, which are highly uncertain . As a result, the impact on Rite Aid’s financial and operating results cannot be reasonably estimated with specificity at this time, but the impact could be material . Rite Aid expressly disclaims any current intention, and assumes no duty, to update publicly any forward - looking statement after the distribution of this release, whether as a result of new information, future events, changes in assumptions or otherwise .

Deepen Grow by Driven Initiatives in Core Areas Create Leverage Assets to Develop New Offering Non - GAAP Financial Measures The following presentation includes the non - GAAP financial measures Adjusted Net Income (Loss), Adjusted Net Income (Loss) per Diluted Share, Adjusted EBITDA, Adjusted EBITDA Gross Profit and Adjusted EBITDA SG&A, which are non - GAAP financial measures . See the attached tables for a reconciliation of Adjusted Net Income (Loss), Adjusted Net Income (Loss) per Diluted Share and Adjusted EBITDA to net income (loss), and net income (loss) per diluted share, which are the most directly comparable GAAP financial measures . Adjusted Net Income (Loss) and Adjusted Net Income (Loss) per Diluted Share exclude amortization expense, merger and acquisition - related costs, non - recurring litigation and other contractual settlements, gains or losses on debt modifications and retirements, LIFO adjustments, goodwill and intangible asset impairment charges, restructuring - related costs, the gains or losses on Bartell acquisition, and change in estimate related to manufacturer rebate receivables . The Company believes Adjusted Net Income (Loss) and Adjusted Net Income (Loss) per Diluted Share serve as appropriate measures to be used in evaluating the performance of its business and help its investors better compare its operating performance over multiple periods . Adjusted EBITDA is defined as net income (loss) excluding the impact of income taxes, interest expense, depreciation and amortization, LIFO adjustments, charges or credits for facility exit and impairment, goodwill and intangible asset impairment charges, inventory write - downs related to store closings, gains or losses on debt modifications and retirements, change in estimate related to manufacturer rebate receivables, and other items (including stock - based compensation expense, merger and acquisition - related costs, non - recurring litigation and other contractual settlements, severance, restructuring - related costs, costs related to facility closures, gain or loss on sale of assets, and the gain or loss on Bartell acquisition) . The add back of LIFO (credit) charge when calculating Adjusted EBITDA, Adjusted Net Income (Loss) and Adjusted Net Income (Loss) per Diluted Share removes the entire impact of LIFO (credits) charges, and effectively reflects the Company's results as if the company was on a FIFO inventory basis . The Company believes Adjusted EBITDA serves as an appropriate measure in evaluating the performance of its business and helps its investors better compare its operating performance with its competitors . Adjusted EBITDA Gross Profit includes LIFO adjustments, depreciation and amortization (COGS portion only) and other items . See the attached tables for a reconciliation of Adjusted EBITDA Gross Profit to Revenue, which is the most directly comparable GAAP financial measure . Adjusted EBITDA SG&A excludes depreciation and amortization (SG&A portion only), stock - based compensation expense, merger and acquisition - related costs, non - recurring litigation and other contractual settlements, and other items . See the attached tables for a reconciliation of Adjusted EBITDA SG&A to Revenue, which is the most directly comparable GAAP financial measure . The Company believes Adjusted EBITDA Gross Profit and Adjusted EBITDA SG&A serve as appropriate measures in evaluating the performance of its business and helps its investors better compare its operating performance with its competitors . The Company presents these non - GAAP financial measures in order to provide transparency to its investors because they are measures that management uses to assess both management performance and the financial performance of its operations and to allocate resources . In addition, management believes that these measures may assist investors with understanding and evaluating the Company’s initiatives to drive improved financial performance and enables investors to supplementally compare its operating performance with the operating performance of its competitors including with those of its competitors having different capital structures . While the Company has excluded certain of these items from historical non - GAAP financial measures, there is no guarantee that the items excluded from non - GAAP financial measures will not continue into future periods . For instance, the Company expects to continue to experience charges for facility exit and impairment charges and inventory write - downs related to store closures as the Company continues to complete a multi - year strategic initiative designed to improve overall performance . The Company also expects to continue to experience and report restructuring - related charges associated with continued execution of its strategic initiatives . Adjusted EBITDA, Adjusted Net Income (Loss), Adjusted Net Income (Loss) per Diluted Share or other non - GAAP measures should not be considered in isolation from, and are not intended to represent an alternative measure of, operating results or of cash flows from operating activities, as determined in accordance with GAAP . The Company’s definition of these non - GAAP measures may not be comparable to similarly titled measurements reported by other companies, including companies in its industry . 3

Q1FY24 FINANCIAL REVIEW
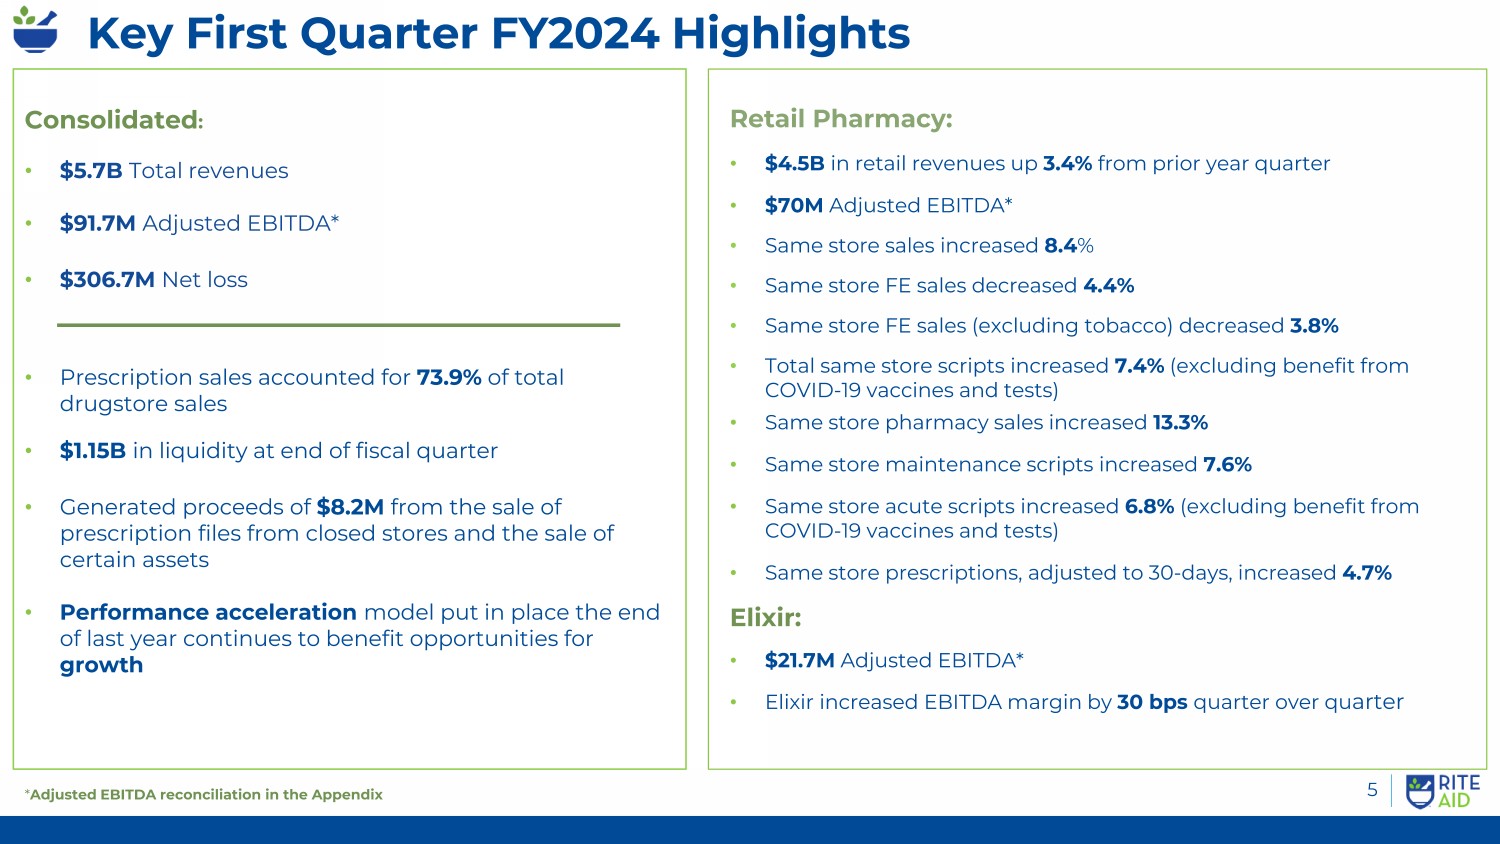
5 * Adjusted EBITDA reconciliation in the Appendix Consolidated : • $5.7B Total revenues • $91.7M Adjusted EBITDA* • $306.7M Net loss • Prescription sales accounted for 73.9% of total drugstore sales • $1.15B in liquidity at end of fiscal quarter • Generated proceeds of $8.2M from the sale of prescription files from closed stores and the sale of certain assets • Performance acceleration model put in place the end of last year continues to benefit opportunities for growth Retail Pharmacy: • $4.5B in retail revenues up 3.4% from prior year quarter • $70M Adjusted EBITDA* • Same store sales increased 8.4 % • Same store FE sales decreased 4.4% • Same store FE sales (excluding tobacco) decreased 3.8% • Total same store scripts increased 7.4% (excluding benefit from COVID - 19 vaccines and tests) • Same store pharmacy sales increased 13.3% • Same store maintenance scripts increased 7.6% • Same store acute scripts increased 6.8% (excluding benefit from COVID - 19 vaccines and tests) • Same store prescriptions, adjusted to 30 - days, increased 4.7% Elixir: • $21.7M Adjusted EBITDA* • Elixir increased EBITDA margin by 30 bps quarter over qu arter Key First Quarter FY2024 Highlights

Moving Forward 10 • Completed the transition of vendors for perishable consumable items, which should alleviate the pressures we saw in this category in Q1 • Continue to make o wn brands a key area of focus with launches of new products throughout the year • Collaborating with our supplier partners to bring new innovation to the market and drive improvement in our assortment • Continuing to invest in upgraded technology capabilities by expanding central fill facilities, freeing up pharmacist time so they can engage with customers, drive adherence, and expand clinical services • Reducing abandoned scripts with pilot program and seeing good results. Rollout will complete to all stores by end of July • Script file program exceeded the Q1 plan showing the increasing potential to grow our pharmacy business 6

GUIDANCE

Updated FY2024 Guidance • $22.6B - $23.0B Total revenues • $330M – $360M Adjusted EBITDA • Retail Pharmacy $240M - $260M • Elixir $90M - $100M • ($4.78) – ($4.29) Dil uted adjusted net loss per share • ~$175M Capital expenditures

APPENDIX
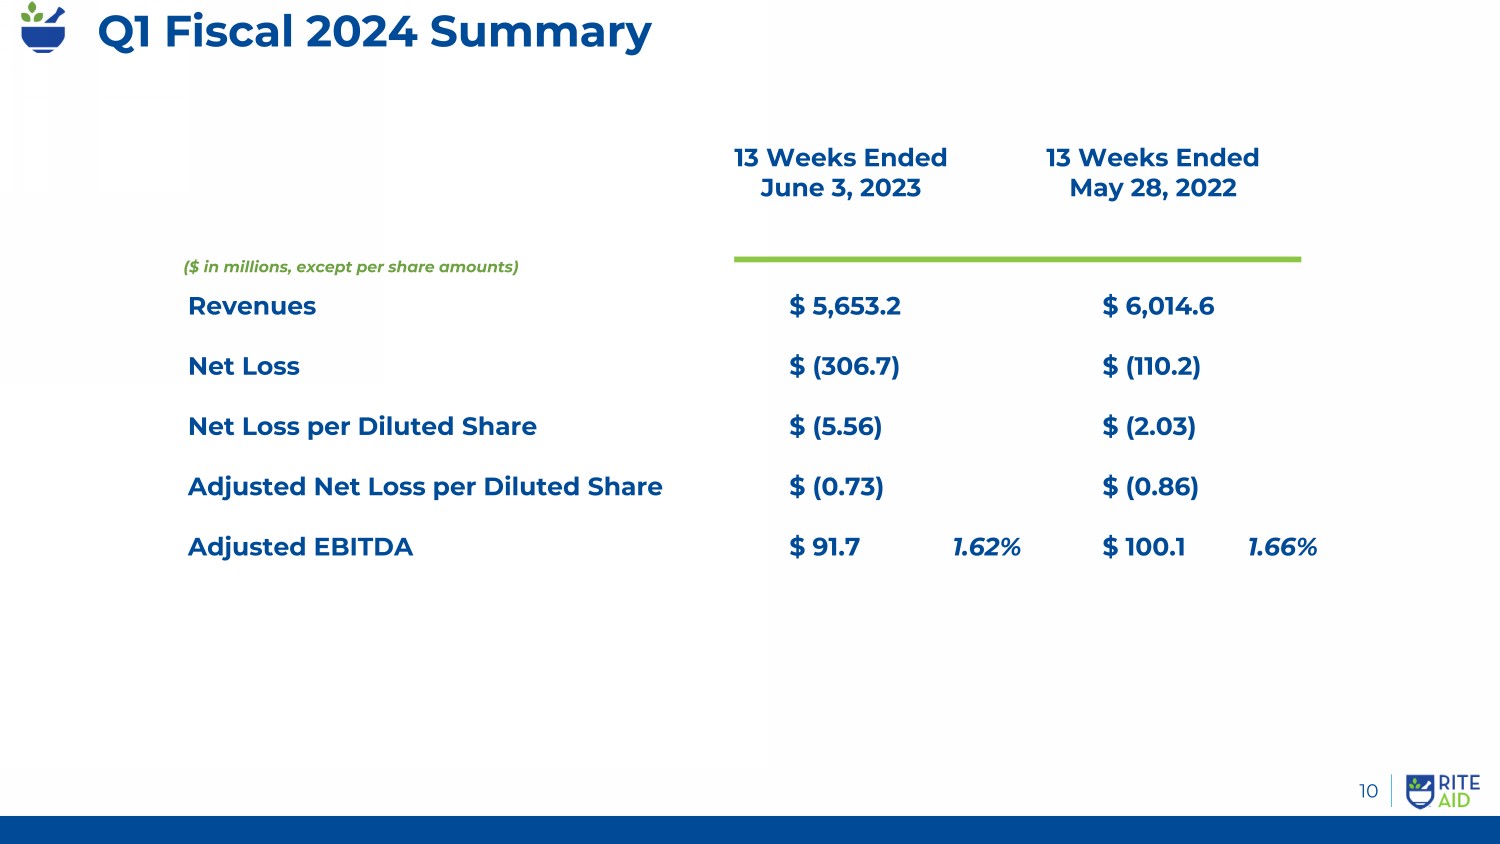
Q1 Fiscal 2024 Summary Create Leverage Assets to Develop New Offering ($ in millions, except per share amounts) 13 Weeks Ended June 3, 2023 13 Weeks Ended May 28 , 2022 Revenues $ 5,653.2 $ 6,014.6 Net Loss $ (306.7) $ (110.2) Net Loss per Diluted Share $ (5.56) $ (2.03) Adjusted Net Loss per Diluted Share $ (0.73) $ ( 0 .86) Adjusted EBITDA $ 91.7 1.62% $ 100.1 1.66% 10

Q1 - Fiscal 2024 Reconciliation of Net Loss to Adjusted EBITDA 11 ($ in thousands) 13 Weeks Ended June 3, 2023 13 Weeks Ended May 28, 2022 Net loss $ (306,718) $ (110,191) Adjustments: • Interest expense 65,220 48,119 • Income tax expense 1,493 3,497 • Depreciation and amortization 65,895 70,073 • LIFO charge 7,500 - • Facility exit and impairment charges 20,001 66,571 • Goodwill and intangible asset impairment charges 151,500 - • Stock - based compensation expense 1,081 3,334 • Restructuring - related costs 78,130 22,646 • Inventory write - downs related to store closings 2,057 7,955 • Litigation and other contractual settlements 11,050 18,271 • Gain on sale of assets, net (8,193) (29,196) • Other 2,699 (949) Adjusted EBITDA $ 91,715 $ 100,130 Percent of revenues 1.62% 1.66%

Q1 - Fiscal 2024 Reconciliation of Net Loss to Adjusted Net Loss Create Leverage Assets to Develop New Offering 12 ($ in thousands, except per share amounts) Net loss $ (306,718) $ ( 110 ,191) Add back - Income tax expense 1,493 3,497 Loss before income taxes $ (305,225) $ ( 106,694) Adjustments: Amortization expense 17,133 20,626 LIFO charge 7,500 - Goodwill and intangible asset impairment charges 151,500 - Restructuring - related costs 78,130 22,646 Litigation and other contractual settlements 11,050 18,271 Adjusted loss before income taxes $ ( 39,912 ) $ (45,151) Adjusted income tax expense 195 1,490 Adjusted net loss $ (40,107) $ (46,641) Net loss per diluted share $ (5.56) $ (2.03) Adjusted net loss per diluted share $ ( 0 .73) $ (0.86) 13 Weeks Ended June 3, 2023 13 Weeks Ended May 28, 2022
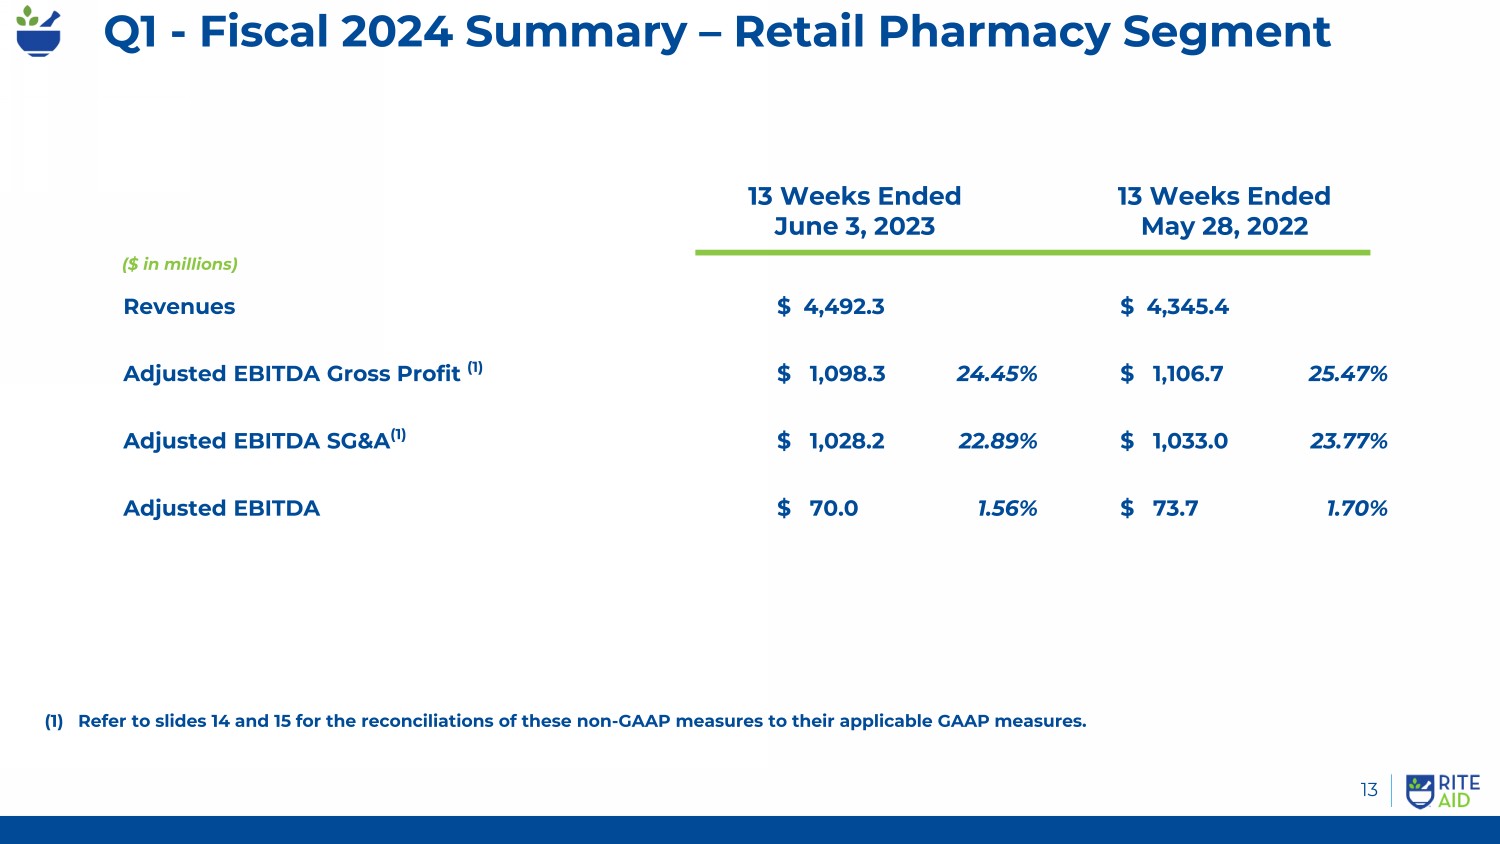
Q1 - Fiscal 2024 Summary – Retail Pharmacy Segment Create Leverage Assets to Develop New Offering 13 ($ in millions) Revenues $ 4,492.3 $ 4,345.4 Adjusted EBITDA Gross Profit (1) $ 1,098.3 24.45% $ 1,106.7 25.47% Adjusted EBITDA SG&A (1) $ 1,028.2 22.89% $ 1,033.0 23.77% Adjusted EBITDA $ 70.0 1.56% $ 73.7 1.70% (1) Refer to slides 14 and 15 for the reconciliations of these non - GAAP measures to their applicable GAAP measures. 13 Weeks Ended June 3, 2023 13 Weeks Ended May 28, 2022

Reconciliation of Adj. EBITDA Gross Profit – Retail Pharmacy Segment Create Leverage Assets to Develop New Offering 14 ($ in millions) 13 Weeks Ended June 3, 2023 13 Weeks Ended May 28, 2022 Revenues $ 4,492.3 $ 4,345.4 Gross Profit 1,086.9 1,097.4 Addback: LIFO charge 7.5 - Depreciation and amortization (COGS portion only) 2.6 2.9 Other 1.3 6.4 Adjusted EBITDA Gross Profit $ 1,098.3 $ 1,106.7 Adjusted EBITDA Gross Profit as a percent of revenues 24.45% 25.47%

Reconciliation of Adj. EBITDA SG&A – Retail Pharmacy Segment Create Leverage Assets to Develop New Offering 15 ($ in millions) 13 Weeks Ended June 3, 2023 13 Weeks Ended May 28 , 2022 Revenues $ 4,492.3 $ 4,345.4 Selling, general and administrative expenses 1,172.6 1,117.2 Less: Depreciation and amortization (SG&A portion only) 52.8 53 .2 Stock - based compensation expense 0.7 3.1 Restructuring - related costs 76 .5 17.4 Litigation and other contractual settlements 11.1 10.0 Other 3.3 0.5 Adjusted EBITDA SG&A $ 1,028.2 $ 1,033.0 Adjusted EBITDA SG&A as a percent of revenues 22.89% 23.77%
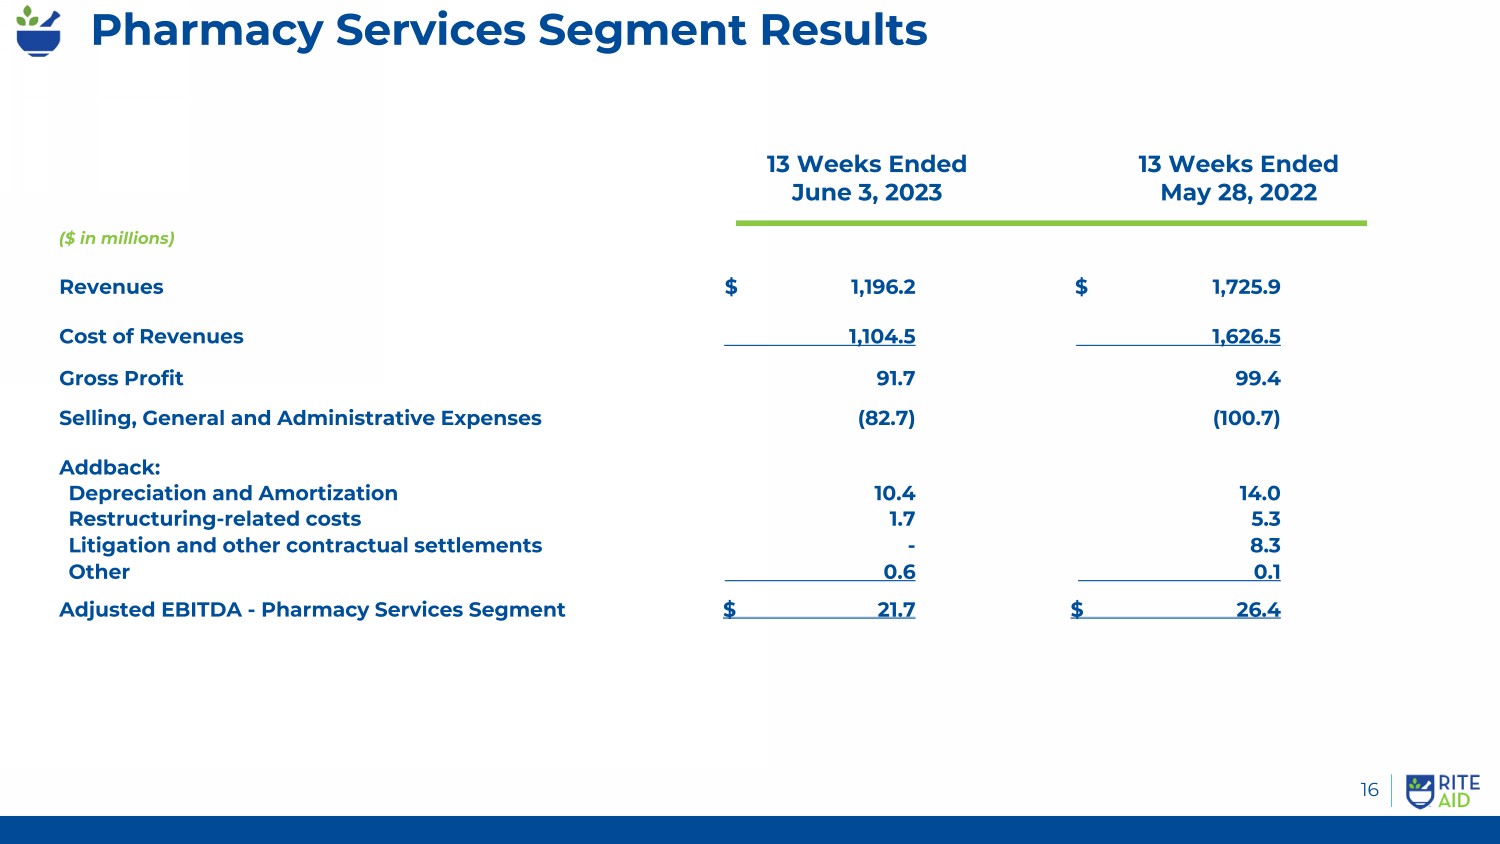
Pharmacy Services Segment Results 16 ($ in millions) Revenues $ 1,196.2 $ 1,725.9 Cost of Revenues 1,104.5 1,626.5 Gross Profit 91 .7 99.4 Selling, General and Administrative Expenses (82.7) (100.7) Addback: Depreciation and Amortization 10.4 14.0 Restructuring - related costs 1.7 5.3 Litigation and other contractual settlements - 8.3 Other 0.6 0.1 Adjusted EBITDA - Pharmacy Services Segment $ 21.7 $ 26.4 13 Weeks Ended June 3, 2023 13 Weeks Ended May 28, 2022

Comparable Store Sales Growth 10 17 FY2023 FY2024 Excluding cigarette and tobacco products Q1 2023 Q2 2023 Q3 2023 6.6% 8.0% 9.5% 11.4% 13.3% Q1 2023 Q2 2023 Q3 2023 Q4 2023 Q1 2024 RX SALES - 0.5% - 0.3% 2.2% 2.3% - 4.4% 0.0% 0.2% 2.7% 2.8% - 3.8% Q4 2023 FRONT END SALES Q1 2024 0.9% 3.1% 4.4% 5.2% 4.7% Q1 2023 Q2 2023 Q3 2023 Q4 2023 Q1 2024 SCRIPT COUNT (1) (1) Script count growth shown on a 30 - day equivalent basis.
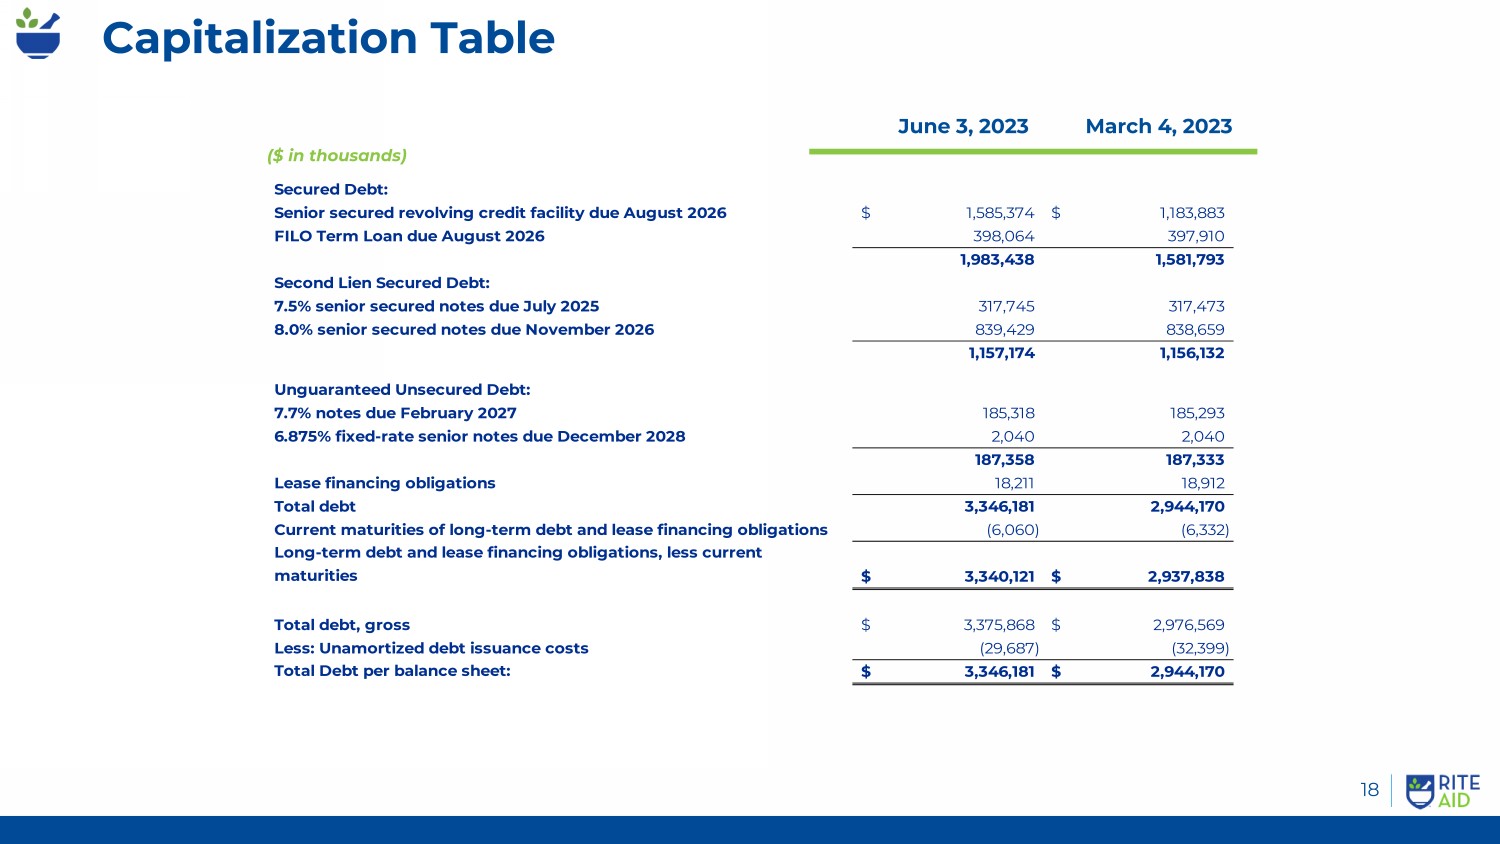
Capitalization Table Create Leverage Assets to Develop New Offering 18 ($ in thousands) June 3, 2023 March 4, 2023 Secured Debt: Senior secured revolving credit facility due August 2026 1,585,374$ 1,183,883$ FILO Term Loan due August 2026 398,064 397,910 1,983,438 1,581,793 Second Lien Secured Debt: 7.5% senior secured notes due July 2025 317,745 317,473 8.0% senior secured notes due November 2026 839,429 838,659 1,157,174 1,156,132 Unguaranteed Unsecured Debt: 7.7% notes due February 2027 185,318 185,293 6.875% fixed-rate senior notes due December 2028 2,040 2,040 187,358 187,333 Lease financing obligations 18,211 18,912 Total debt 3,346,181 2,944,170 Current maturities of long-term debt and lease financing obligations (6,060) (6,332) Long-term debt and lease financing obligations, less current maturities 3,340,121$ 2,937,838$ Total debt, gross 3,375,868$ 2,976,569$ Less: Unamortized debt issuance costs (29,687) (32,399) Total Debt per balance sheet: 3,346,181$ 2,944,170$

Expand Growth in New Markets 19 FY 2024 Guidance ($ in thousands) Total Revenues $ 22,600,000 $ 23,000,000 Pharmacy Services Segment Revenues $ 4,550,000 $ 4,650,000 Gross Capital Expenditures $ 175,000 $ 175,000 Reconciliation of net loss to adjusted EBITDA: Net loss $ (678,500) $ (651,500) Adjustments: Interest expense 273,000 273,000 Income tax expense 2,000 5,000 Depreciation and amortization 280,000 280,000 LIFO charge 30,000 30,000 Facility exit and impairment charges 100,000 100,000 Goodwill and intangible asset impairment charges 151,500 151,500 Restructuring - related costs 155,000 155,000 Litigation and other contractual settlements 11,000 11,000 Gain on sale of assets, net (9,000) (9,000) Other 15,000 15,000 Adjusted EBITDA $ 330,000 $ 360,000 Guidance Range Low High
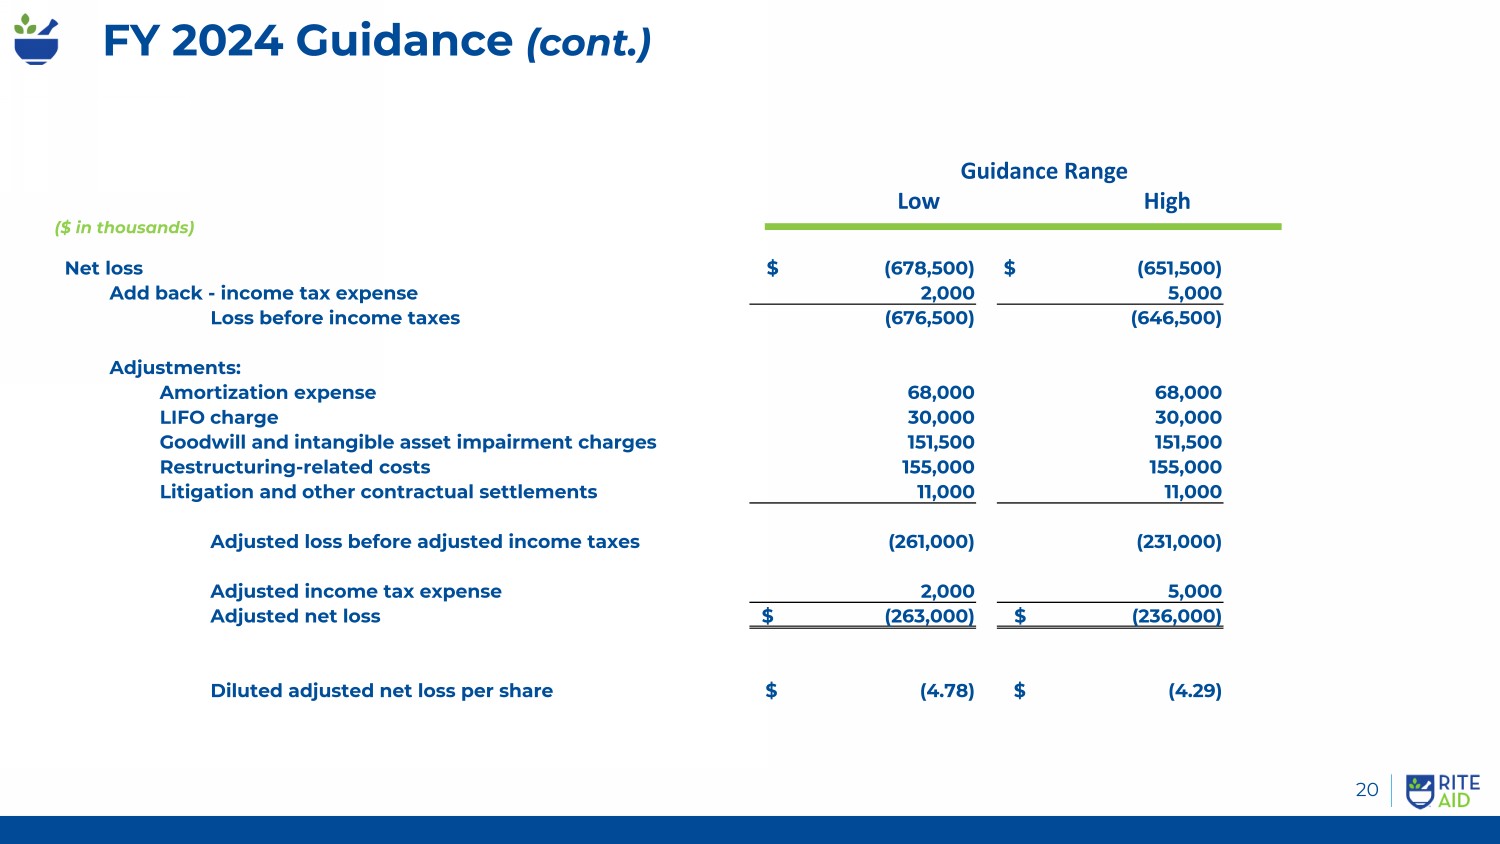
FY 2024 Guidance (cont.) Expand Growth in New Markets 20 FY 2023 Guidance ($ in thousands) Guidance Range Low High Net loss $ (678,500) $ (651,500) Add back - income tax expense 2,000 5,000 Loss before income taxes (676,500) (646,500) Adjustments: Amortization expense 68,000 68,000 LIFO charge 30,000 30,000 Goodwill and intangible asset impairment charges 151,500 151,500 Restructuring - related costs 155,000 155,000 Litigation and other contractual settlements 11,000 11,000 Adjusted loss before adjusted income taxes (261,000) (231,000) Adjusted income tax expense 2,000 5,000 Adjusted net loss $ (263,000) $ (236,000) Diluted adjusted net loss per share $ (4.78) $ (4.29)

v3.23.2
| X |
- DefinitionBoolean flag that is true when the XBRL content amends previously-filed or accepted submission.
| Name: |
dei_AmendmentFlag |
| Namespace Prefix: |
dei_ |
| Data Type: |
xbrli:booleanItemType |
| Balance Type: |
na |
| Period Type: |
duration |
|
| X |
- DefinitionFor the EDGAR submission types of Form 8-K: the date of the report, the date of the earliest event reported; for the EDGAR submission types of Form N-1A: the filing date; for all other submission types: the end of the reporting or transition period. The format of the date is YYYY-MM-DD.
| Name: |
dei_DocumentPeriodEndDate |
| Namespace Prefix: |
dei_ |
| Data Type: |
xbrli:dateItemType |
| Balance Type: |
na |
| Period Type: |
duration |
|
| X |
- DefinitionThe type of document being provided (such as 10-K, 10-Q, 485BPOS, etc). The document type is limited to the same value as the supporting SEC submission type, or the word 'Other'.
| Name: |
dei_DocumentType |
| Namespace Prefix: |
dei_ |
| Data Type: |
dei:submissionTypeItemType |
| Balance Type: |
na |
| Period Type: |
duration |
|
| X |
- DefinitionAddress Line 1 such as Attn, Building Name, Street Name
| Name: |
dei_EntityAddressAddressLine1 |
| Namespace Prefix: |
dei_ |
| Data Type: |
xbrli:normalizedStringItemType |
| Balance Type: |
na |
| Period Type: |
duration |
|
| X |
- Definition
+ References
+ Details
| Name: |
dei_EntityAddressCityOrTown |
| Namespace Prefix: |
dei_ |
| Data Type: |
xbrli:normalizedStringItemType |
| Balance Type: |
na |
| Period Type: |
duration |
|
| X |
- DefinitionCode for the postal or zip code
| Name: |
dei_EntityAddressPostalZipCode |
| Namespace Prefix: |
dei_ |
| Data Type: |
xbrli:normalizedStringItemType |
| Balance Type: |
na |
| Period Type: |
duration |
|
| X |
- DefinitionName of the state or province.
| Name: |
dei_EntityAddressStateOrProvince |
| Namespace Prefix: |
dei_ |
| Data Type: |
dei:stateOrProvinceItemType |
| Balance Type: |
na |
| Period Type: |
duration |
|
| X |
- DefinitionA unique 10-digit SEC-issued value to identify entities that have filed disclosures with the SEC. It is commonly abbreviated as CIK. Reference 1: http://www.xbrl.org/2003/role/presentationRef
-Publisher SEC
-Name Exchange Act
-Number 240
-Section 12
-Subsection b-2
| Name: |
dei_EntityCentralIndexKey |
| Namespace Prefix: |
dei_ |
| Data Type: |
dei:centralIndexKeyItemType |
| Balance Type: |
na |
| Period Type: |
duration |
|
| X |
- DefinitionIndicate if registrant meets the emerging growth company criteria. Reference 1: http://www.xbrl.org/2003/role/presentationRef
-Publisher SEC
-Name Exchange Act
-Number 240
-Section 12
-Subsection b-2
| Name: |
dei_EntityEmergingGrowthCompany |
| Namespace Prefix: |
dei_ |
| Data Type: |
xbrli:booleanItemType |
| Balance Type: |
na |
| Period Type: |
duration |
|
| X |
- DefinitionCommission file number. The field allows up to 17 characters. The prefix may contain 1-3 digits, the sequence number may contain 1-8 digits, the optional suffix may contain 1-4 characters, and the fields are separated with a hyphen.
| Name: |
dei_EntityFileNumber |
| Namespace Prefix: |
dei_ |
| Data Type: |
dei:fileNumberItemType |
| Balance Type: |
na |
| Period Type: |
duration |
|
| X |
- DefinitionTwo-character EDGAR code representing the state or country of incorporation.
| Name: |
dei_EntityIncorporationStateCountryCode |
| Namespace Prefix: |
dei_ |
| Data Type: |
dei:edgarStateCountryItemType |
| Balance Type: |
na |
| Period Type: |
duration |
|
| X |
- DefinitionThe exact name of the entity filing the report as specified in its charter, which is required by forms filed with the SEC. Reference 1: http://www.xbrl.org/2003/role/presentationRef
-Publisher SEC
-Name Exchange Act
-Number 240
-Section 12
-Subsection b-2
| Name: |
dei_EntityRegistrantName |
| Namespace Prefix: |
dei_ |
| Data Type: |
xbrli:normalizedStringItemType |
| Balance Type: |
na |
| Period Type: |
duration |
|
| X |
- DefinitionThe Tax Identification Number (TIN), also known as an Employer Identification Number (EIN), is a unique 9-digit value assigned by the IRS. Reference 1: http://www.xbrl.org/2003/role/presentationRef
-Publisher SEC
-Name Exchange Act
-Number 240
-Section 12
-Subsection b-2
| Name: |
dei_EntityTaxIdentificationNumber |
| Namespace Prefix: |
dei_ |
| Data Type: |
dei:employerIdItemType |
| Balance Type: |
na |
| Period Type: |
duration |
|
| X |
- DefinitionLocal phone number for entity.
| Name: |
dei_LocalPhoneNumber |
| Namespace Prefix: |
dei_ |
| Data Type: |
xbrli:normalizedStringItemType |
| Balance Type: |
na |
| Period Type: |
duration |
|
| X |
- DefinitionBoolean flag that is true when the Form 8-K filing is intended to satisfy the filing obligation of the registrant as pre-commencement communications pursuant to Rule 13e-4(c) under the Exchange Act. Reference 1: http://www.xbrl.org/2003/role/presentationRef
-Publisher SEC
-Name Exchange Act
-Number 240
-Section 13e
-Subsection 4c
| Name: |
dei_PreCommencementIssuerTenderOffer |
| Namespace Prefix: |
dei_ |
| Data Type: |
xbrli:booleanItemType |
| Balance Type: |
na |
| Period Type: |
duration |
|
| X |
- DefinitionBoolean flag that is true when the Form 8-K filing is intended to satisfy the filing obligation of the registrant as pre-commencement communications pursuant to Rule 14d-2(b) under the Exchange Act. Reference 1: http://www.xbrl.org/2003/role/presentationRef
-Publisher SEC
-Name Exchange Act
-Number 240
-Section 14d
-Subsection 2b
| Name: |
dei_PreCommencementTenderOffer |
| Namespace Prefix: |
dei_ |
| Data Type: |
xbrli:booleanItemType |
| Balance Type: |
na |
| Period Type: |
duration |
|
| X |
- DefinitionTitle of a 12(b) registered security. Reference 1: http://www.xbrl.org/2003/role/presentationRef
-Publisher SEC
-Name Exchange Act
-Number 240
-Section 12
-Subsection b
| Name: |
dei_Security12bTitle |
| Namespace Prefix: |
dei_ |
| Data Type: |
dei:securityTitleItemType |
| Balance Type: |
na |
| Period Type: |
duration |
|
| X |
- DefinitionName of the Exchange on which a security is registered. Reference 1: http://www.xbrl.org/2003/role/presentationRef
-Publisher SEC
-Name Exchange Act
-Number 240
-Section 12
-Subsection d1-1
| Name: |
dei_SecurityExchangeName |
| Namespace Prefix: |
dei_ |
| Data Type: |
dei:edgarExchangeCodeItemType |
| Balance Type: |
na |
| Period Type: |
duration |
|
| X |
- DefinitionBoolean flag that is true when the Form 8-K filing is intended to satisfy the filing obligation of the registrant as soliciting material pursuant to Rule 14a-12 under the Exchange Act. Reference 1: http://www.xbrl.org/2003/role/presentationRef
-Publisher SEC
-Name Exchange Act
-Section 14a
-Number 240
-Subsection 12
| Name: |
dei_SolicitingMaterial |
| Namespace Prefix: |
dei_ |
| Data Type: |
xbrli:booleanItemType |
| Balance Type: |
na |
| Period Type: |
duration |
|
| X |
- DefinitionTrading symbol of an instrument as listed on an exchange.
| Name: |
dei_TradingSymbol |
| Namespace Prefix: |
dei_ |
| Data Type: |
dei:tradingSymbolItemType |
| Balance Type: |
na |
| Period Type: |
duration |
|
| X |
- DefinitionBoolean flag that is true when the Form 8-K filing is intended to satisfy the filing obligation of the registrant as written communications pursuant to Rule 425 under the Securities Act. Reference 1: http://www.xbrl.org/2003/role/presentationRef
-Publisher SEC
-Name Securities Act
-Number 230
-Section 425
| Name: |
dei_WrittenCommunications |
| Namespace Prefix: |
dei_ |
| Data Type: |
xbrli:booleanItemType |
| Balance Type: |
na |
| Period Type: |
duration |
|
Rite Aid (NYSE:RAD)
Historical Stock Chart
Von Mai 2024 bis Jun 2024

Rite Aid (NYSE:RAD)
Historical Stock Chart
Von Jun 2023 bis Jun 2024
