0001818383FALSE00018183832023-07-292023-07-29
UNITED STATES
SECURITIES AND EXCHANGE COMMISSION
WASHINGTON, DC 20549
_____________________________
FORM 8-K
_____________________________
CURRENT REPORT
PURSUANT TO SECTION 13 OR 15(d) OF THE SECURITIES EXCHANGE ACT OF 1934
Date of Report (Date of earliest event reported): July 29, 2023
_____________________________
MediaAlpha, Inc.
(Exact Name of Registrant as Specified in Its Charter)
_____________________________
| | | | | | | | |
| Delaware | 001-39671 | 85-1854133 |
(State or other jurisdiction of incorporation) | (Commission File Number) | (IRS Employer Identification No.) |
| | | | | |
700 South Flower Street, Suite 640 Los Angeles, California | 90017 |
| (Address of Principal Executive Offices) | (Zip Code) |
(213) 316-6256
(Registrant’s telephone number, including area code)
(Not Applicable)
(Former name or former address, if changed since last report)
| | | | | |
| Check the appropriate box below if the Form 8-K filing is intended to simultaneously satisfy the filing obligation of the registrant under any of the following provisions (see General Instruction A.2. below): |
| |
| o | Written communications pursuant to Rule 425 under the Securities Act (17 CFR 230.425) |
| |
| o | Soliciting material pursuant to Rule 14a-12 under the Exchange Act (17 CFR 240.14a-12) |
| |
| o | Pre-commencement communications pursuant to Rule 14d-2(b) under the Exchange Act (17 CFR 240.14d-2(b)) |
| |
| o | Pre-commencement communications pursuant to Rule 13e-4(c) under the Exchange Act (17 CFR 240.13e-4(c)) |
Securities registered pursuant to Section 12(b) of the Act:
| | | | | | | | | | | | | | |
| Title of each class | | Trading Symbol(s) | | Name of each exchange on which registered |
| Class A common stock, $0.01 par value | | MAX | | New York Stock Exchange |
| | | | | |
| Indicate by check mark whether the registrant is an emerging growth company as defined in Rule 405 of the Securities Act of 1933 (§230.405 of this chapter) or Rule 12b-2 of the Securities Exchange Act of 1934 (§240.12b-2 of this chapter). Emerging growth company o If an emerging growth company, indicate by check mark if the registrant has elected not to use the extended transition period for complying with any new or revised financial accounting standards provided pursuant to Section 13(a) of the Exchange Act. o |
ITEM 2.02 – Results of Operations and Financial Condition.
On August 2, 2023, MediaAlpha, Inc. (“MediaAlpha”) issued a press release and an accompanying shareholder letter announcing its financial results as of and for the second quarter ended June 30, 2023, and its financial outlook for the third quarter of 2023. Copies of the press release and shareholder letter are furnished as Exhibit 99.1 and Exhibit 99.2, respectively, to this Form 8-K and are incorporated by reference herein.
This information shall not be deemed “filed” for purposes of Section 18 of the Securities Exchange Act of 1934, as amended (the “Exchange Act”), or incorporated by reference in any filing under the Securities Act of 1933, as amended, or the Exchange Act, except as shall be expressly set forth by specific reference in such a filing.
MediaAlpha refers to non-GAAP financial information in the press release and shareholder letter. A reconciliation of these non-GAAP financial measures to the comparable GAAP financial measures is contained in each document.
ITEM 5.02. Departure of Directors or Certain Officers; Election of Directors; Appointment of Certain Officers; Compensatory Arrangements of Certain Officers.
Amendments to Employment Agreements
On July 29, 2023, the Compensation Committee of the Board of Directors of MediaAlpha, approved amendments to the Amended and Restated Employment Agreements with Steven Yi and Eugene Nonko.
The amendments provide that, for base salary earned on and after September 15, 2023, MediaAlpha will pay each executive a portion of his base salary in the form of cash. This cash amount will equal the greater of (i) $70,000 per annum and (ii) the minimum salary per annum required for the executive to qualify as an exempt employee. The amendments further provide that the remaining portion of each executive’s base salary will be paid to the executive in the form of a restricted stock unit award covering shares of MediaAlpha’s Class A common stock (each, a “Salary RSU Award”).
Each Salary RSU Award will vest in full on the three (3) month anniversary of its grant date, subject to the applicable executive’s continued employment. The number of shares covered by each Salary RSU Award will be based on the average closing price of a share of MediaAlpha’s Class A common stock for the twenty (20) trading day period ending on the Friday immediately preceding such Salary RSU Award’s grant date (and, if such Friday is not a business day, the business day immediately preceding such Friday).
In the event of a termination of an executive’s employment with MediaAlpha for any reason, a prorated portion of the executive’s then outstanding and unvested Salary RSU Award will vest. Such prorated portion will be based on the number of days of the executive’s employment prior to and including such termination, and any portion of the executive’s Salary RSU Award that remains unvested thereafter will be forfeited. Salary RSU Awards will not be subject to any other vesting acceleration.
The foregoing summary does not purport to be complete and is qualified in its entirety by reference to the full text of the amendments, which are attached hereto as Exhibits 10.1 and 10.2 and incorporated herein by reference.
ITEM 9.01 – Financial Statements and Exhibits.
(d) Exhibits
| | | | | |
Exhibit No. | Description |
10.1 | |
10.2 | |
99.1 | |
99.2 | |
| 104 | Cover Page Interactive Data File (embedded within the Inline XBRL document). |
SIGNATURES
Pursuant to the requirements of the Securities Exchange Act of 1934, the registrant has duly caused this report to be signed on its behalf by the undersigned hereunto duly authorized.
| | | | | | | | | | | |
| MediaAlpha, Inc. |
| | |
| Date: August 2, 2023 | By: | /s/ Jeffrey B. Coyne |
| | Name: | Jeffrey B. Coyne |
| | Title: | General Counsel & Secretary |
SECOND AMENDMENT TO
AMENDED AND RESTATED EMPLOYMENT AGREEMENT
This Second Amendment to Amended and Restated Employment Agreement (this “Amendment”), is made as of August 1, 2023, among MEDIAALPHA, INC., a Delaware corporation (“Parent”), QUOTELAB, LLC, a Delaware limited liability company (the “Company”), and STEVEN YI (the “Executive”). Capitalized terms used but not defined herein shall have the meanings ascribed to them in the Employment Agreement (as defined below).
RECITALS
A. WHEREAS, Parent, the Company and the Executive are parties to that certain Amended and Restated Employment Agreement dated as of October 27, 2020, as amended by that certain First Amendment to Amended and Restated Employment Agreement dated as of March 22, 2022 (as so amended, the “Employment Agreement”); and
B. WHEREAS, the parties desire to amend certain provisions of the Employment Agreement, as more particularly set forth herein.
AGREEMENT
In consideration of the foregoing and the mutual covenants and agreements herein contained, and intending to be legally bound hereby, the parties agree as follows:
1. Amendment of Section 4(b). Section 4(b) of the Employment Agreement is hereby amended and restated in its entirety to read as follows:
“(b) Base Salary. The Company shall pay the Executive a base salary at the rate of $550,000 per annum (as increased from time to time pursuant to this Section 4(b), “Base Salary”). Effective for Base Salary earned on and after September 15, 2023, such Base Salary shall be paid in a combination of cash and restricted stock unit awards, as provided in and determined pursuant to this Section 4(b). The Executive’s Base Salary shall be subject to annual review by the Board or the Compensation Committee of the Board (the “Committee”) in the first calendar quarter of each year during the Employment Term following the Effective Date, and may be increased, but not decreased below its then current level, from time to time by the Board or the Committee.
(i) Cash Salary. Effective for Base Salary earned on and after September 15, 2023, the Company shall pay the Executive such Base Salary in the form of cash at the greater of (A) the rate of $70,000 per annum or (B) the rate of the minimum salary per annum required for the Executive to qualify as an exempt employee under applicable law (the “Cash Salary”). Such cash payment shall be made in accordance with the Company’s regular payroll practices, as such practices may be modified from time to time.
(ii) Equity Salary. For each calendar quarter beginning with September 15, 2023, the difference between the Executive’s projected (x) Base Salary for such quarter and (y) Cash Salary for such quarter (such difference for such quarter, the “Equity Salary”) shall be paid in the form of a restricted stock unit award with respect to Parent’s Class A common stock determined in accordance with the provisions of this Section 4(b)(ii) (each such award, a “Salary RSU Award”). For avoidance of doubt, each such Salary RSU Award shall be in addition to the Annual Awards contemplated by Section 4(d) below.
(A) A Salary RSU Award shall be granted effective on September 15, 2023 and each calendar quarter anniversary thereof (for example, December 15th, 2023, March 15th, 2024, June 15th, 2024 and so on). Each such Salary RSU Award shall vest in full on the three (3) month anniversary of its effective grant date, subject to the Executive’s continued employment through such anniversary.
(B) The number of shares of Parent’s Class A common stock covered by each such Salary RSU Award shall be determined by dividing (x) the Equity Salary corresponding to the relevant calendar quarter covered by such Salary RSU Award by (y) the average closing price of a share of Parent’s Class A common stock for the twenty (20) trading day period ended on the Friday immediately preceding the effective grant date of such Salary RSU Award (and, if such Friday is not a business day, the business day immediately preceding such Friday).
(C) Each such Salary RSU Award shall be subject to the terms of the Omnibus Plan and the applicable award agreement approved by the Committee. Notwithstanding anything to the contrary herein or in the Omnibus Plan, the applicable award agreement or otherwise, in the event of a termination of the Executive’s employment with the Company for any reason, a prorated portion of any outstanding and unvested Salary RSU Award shall vest. Such prorated portion shall be determined by dividing (x) the number of days during the original vesting period applicable to such Salary RSU Award prior to and including such termination by (y) the total number of days during such original vesting period. Any portion of such Salary RSU Award that remains unvested after the application of the preceding sentence shall be forfeited for no consideration. Notwithstanding anything to the contrary herein or in the Omnibus Plan, the applicable award agreement or otherwise, no Salary RSU Award shall be subject to any other vesting acceleration, including pursuant to the Employment Agreement, the applicable award agreement or the Omnibus Plan.
(D) The Committee may determine, in its sole discretion and prior to any calendar quarter, to pay 100 percent (100%) of the Base Salary corresponding to such calendar quarter in the form of cash. In the event of such determination, the provisions of this Section 4(b) relating to a Salary RSU Award for such calendar quarter shall be null and void.
2. Amendment and Ratification. Except as specifically amended hereby, all terms, conditions, covenants, representations, and warranties contained in the Employment Agreement shall remain in full force and effect and shall be binding upon the parties.
3. Entire Agreement. The Employment Agreement (including the Schedules thereto), in each case as amended hereby, together with the Executive’s Confidential Information and Inventions Agreement, constitute the entire agreement, and supersede all prior written agreements, arrangements, communications and understandings and all prior and contemporaneous oral agreements, arrangements, communications and understandings between the parties with respect to the subject matter hereof and thereof.
4. Governing Law. This Amendment and all disputes or controversies arising out of or relating to this Amendment or the transactions contemplated hereby shall be governed by, and construed in accordance with, the internal laws of the State of Delaware, without regard to the laws of any other jurisdiction that might be applied because of the conflicts of laws principles of the State of Delaware.
5. Counterparts. This Amendment may be executed in two or more counterparts, all of which shall be considered one and the same instrument and shall become effective when one or more counterparts have been signed by each of the parties and delivered to the other party.
6. Facsimile or .pdf Signature. This Amendment may be executed by facsimile or .pdf signature and a facsimile or .pdf signature shall constitute an original for all purposes.
[Signature page follows]
IN WITNESS WHEREOF, the parties have caused this Amendment to be executed as of the date first written above.
MEDIAALPHA, INC.
By: /s/ Patrick R. Thompson
Name: Patrick R. Thompson
Title: Chief Financial Officer
QUOTELAB, LLC
By: /s/ Patrick R. Thompson
Name: Patrick R. Thompson
Title: Chief Financial Officer
EXECUTIVE
/s/ Steven Yi
Steven Yi
[SIGNATURE PAGE TO SECOND AMENDMENT TO EMPLOYMENT AGREEMENT]
SECOND AMENDMENT TO
AMENDED AND RESTATED EMPLOYMENT AGREEMENT
This Second Amendment to Amended and Restated Employment Agreement (this “Amendment”), is made as of August 1, 2023, among MEDIAALPHA, INC., a Delaware corporation (“Parent”), QUOTELAB, LLC, a Delaware limited liability company (the “Company”), and EUGENE NONKO (the “Executive”). Capitalized terms used but not defined herein shall have the meanings ascribed to them in the Employment Agreement (as defined below).
RECITALS
A. WHEREAS, Parent, the Company and the Executive are parties to that certain Amended and Restated Employment Agreement dated as of October 27, 2020, as amended by that certain First Amendment to Amended and Restated Employment Agreement dated as of March 22, 2022 (as so amended, the “Employment Agreement”); and
B. WHEREAS, the parties desire to amend certain provisions of the Employment Agreement, as more particularly set forth herein.
AGREEMENT
In consideration of the foregoing and the mutual covenants and agreements herein contained, and intending to be legally bound hereby, the parties agree as follows:
1. Amendment of Section 4(b). Section 4(b) of the Employment Agreement is hereby amended and restated in its entirety to read as follows:
“(b) Base Salary. The Company shall pay the Executive a base salary at the rate of $550,000 per annum (as increased from time to time pursuant to this Section 4(b), “Base Salary”). Effective for Base Salary earned on and after September 15, 2023, such Base Salary shall be paid in a combination of cash and restricted stock unit awards, as provided in and determined pursuant to this Section 4(b). The Executive’s Base Salary shall be subject to annual review by the Board or the Compensation Committee of the Board (the “Committee”) in the first calendar quarter of each year during the Employment Term following the Effective Date, and may be increased, but not decreased below its then current level, from time to time by the Board or the Committee.
(i) Cash Salary. Effective for Base Salary earned on and after September 15, 2023, the Company shall pay the Executive such Base Salary in the form of cash at the greater of (A) the rate of $70,000 per annum or (B) the rate of the minimum salary per annum required for the Executive to qualify as an exempt employee under applicable law (the “Cash Salary”). Such cash payment shall be made in accordance with the Company’s regular payroll practices, as such practices may be modified from time to time.
(ii) Equity Salary. For each calendar quarter beginning with September 15, 2023, the difference between the Executive’s projected (x) Base Salary for such quarter and (y) Cash Salary for such quarter (such difference for such quarter, the “Equity Salary”) shall be paid in the form of a restricted stock unit award with respect to Parent’s Class A common stock determined in accordance with the provisions of this Section 4(b)(ii) (each such award, a “Salary RSU Award”). For avoidance of doubt, each such Salary RSU Award shall be in addition to the Annual Awards contemplated by Section 4(d) below.
(A) A Salary RSU Award shall be granted effective on September 15, 2023 and each calendar quarter anniversary thereof (for example, December 15th, 2023, March 15th, 2024, June 15th, 2024 and so on). Each such Salary RSU Award shall vest in full on the three (3) month anniversary of its effective grant date, subject to the Executive’s continued employment through such anniversary.
(B) The number of shares of Parent’s Class A common stock covered by each such Salary RSU Award shall be determined by dividing (x) the Equity Salary corresponding to the relevant calendar quarter covered by such Salary RSU Award by (y) the average closing price of a share of Parent’s Class A common stock for the twenty (20) trading day period ended on the Friday immediately preceding the effective grant date of such Salary RSU Award (and, if such Friday is not a business day, the business day immediately preceding such Friday).
(C) Each such Salary RSU Award shall be subject to the terms of the Omnibus Plan and the applicable award agreement approved by the Committee. Notwithstanding anything to the contrary herein or in the Omnibus Plan, the applicable award agreement or otherwise, in the event of a termination of the Executive’s employment with the Company for any reason, a prorated portion of any outstanding and unvested Salary RSU Award shall vest. Such prorated portion shall be determined by dividing (x) the number of days during the original vesting period applicable to such Salary RSU Award prior to and including such termination by (y) the total number of days during such original vesting period. Any portion of such Salary RSU Award that remains unvested after the application of the preceding sentence shall be forfeited for no consideration. Notwithstanding anything to the contrary herein or in the Omnibus Plan, the applicable award agreement or otherwise, no Salary RSU Award shall be subject to any other vesting acceleration, including pursuant to the Employment Agreement, the applicable award agreement or the Omnibus Plan.
(D) The Committee may determine, in its sole discretion and prior to any calendar quarter, to pay 100 percent (100%) of the Base Salary corresponding to such calendar quarter in the form of cash. In the event of such determination, the provisions of this Section 4(b) relating to a Salary RSU Award for such calendar quarter shall be null and void.
2. Amendment and Ratification. Except as specifically amended hereby, all terms, conditions, covenants, representations, and warranties contained in the Employment Agreement shall remain in full force and effect and shall be binding upon the parties.
3. Entire Agreement. The Employment Agreement (including the Schedules thereto), in each case as amended hereby, together with the Executive’s Confidential Information and Inventions Agreement, constitute the entire agreement, and supersede all prior written agreements, arrangements, communications and understandings and all prior and contemporaneous oral agreements, arrangements, communications and understandings between the parties with respect to the subject matter hereof and thereof.
4. Governing Law. This Amendment and all disputes or controversies arising out of or relating to this Amendment or the transactions contemplated hereby shall be governed by, and construed in accordance with, the internal laws of the State of Delaware, without regard to the laws of any other jurisdiction that might be applied because of the conflicts of laws principles of the State of Delaware.
5. Counterparts. This Amendment may be executed in two or more counterparts, all of which shall be considered one and the same instrument and shall become effective when one or more counterparts have been signed by each of the parties and delivered to the other party.
6. Facsimile or .pdf Signature. This Amendment may be executed by facsimile or .pdf signature and a facsimile or .pdf signature shall constitute an original for all purposes.
[Signature page follows]
IN WITNESS WHEREOF, the parties have caused this Amendment to be executed as of the date first written above.
MEDIAALPHA, INC.
By: /s/ Patrick R. Thompson
Name: Patrick R. Thompson
Title: Chief Financial Officer
QUOTELAB, LLC
By: /s/ Patrick R. Thompson
Name: Patrick R. Thompson
Title: Chief Financial Officer
EXECUTIVE
/s/ Eugene Nonko
Eugene Nonko
[SIGNATURE PAGE TO SECOND AMENDMENT TO EMPLOYMENT AGREEMENT]
MEDIAALPHA ANNOUNCES SECOND QUARTER 2023
FINANCIAL RESULTS
•Revenue of $85 million, down 18% year over year
•Transaction Value of $126 million, down 31% year over year
•Transaction Value from Property & Casualty down 46% year over year to $61 million
•Transaction Value from Health up 10% year over year to $51 million
Los Angeles, CA (August 2, 2023) – MediaAlpha, Inc. (NYSE: MAX), today announced its financial results for the second quarter ended June 30, 2023.
“Our second quarter results exceeded expectations, driven primarily by strength in our Health insurance vertical,” said MediaAlpha co-founder and CEO Steve Yi. “In our Property & Casualty (P&C) insurance vertical, customer acquisition spend remains at cyclically low levels as carriers are taking longer than expected to restore underwriting profitability, and we expect this to continue for the balance of the year. Our ability to operate profitability in the current market environment is a tribute to the efficiency of our business model and the agility of our team, which we believe will enable us to capture outsized growth as the auto insurance market recovers.”
Second Quarter 2023 Financial Results
•Revenue of $84.8 million, a decrease of 18% year over year;
•Transaction Value of $125.9 million, a decrease of 31% year over year;
•Gross margin of 16.2%, compared with 15.0% in the second quarter of 2022;
•Contribution Margin(1) of 19.5%, compared with 18.1% in the second quarter of 2022;
•Net loss was $(20.0) million, compared with $(13.0) million in the second quarter of 2022; and
•Adjusted EBITDA(1) was $3.6 million, compared with $4.5 million in the second quarter of 2022.
(1)A reconciliation of GAAP to Non-GAAP financial measures has been provided at the end of this press release. An explanation of these measures is also included below under the heading “Non-GAAP Financial Measures.”
Financial Outlook
Our guidance for the third quarter of 2023 reflects a continuation of low customer acquisition spend levels by P&C carriers as they prioritize profitability over growth. As a result, we expect third quarter Transaction Value in our P&C insurance vertical to decline year over year by 40% to 50%. In addition, we expect third quarter Transaction Value in our Health vertical to grow year over year at a rate similar to the second quarter.
For the third quarter of 2023, MediaAlpha currently expects the following:
•Transaction Value between $95 million - $110 million, representing a 30% year-over-year decline at the midpoint of the guidance range;
•Revenue between $65 million - $75 million, representing a 21% year-over-year decline at the midpoint of the guidance range;
•Adjusted EBITDA between $1.5 million and $3.5 million, representing a 15% year-over-year increase at the midpoint of the guidance range. We are projecting our operating expenses, net of Adjusted EBITDA addbacks, to be approximately $1.5 million lower than Q2 2023 levels, driven primarily by a full quarter impact of the workforce reductions we implemented in May 2023 and continued expense discipline.
With respect to the Company’s projection of Adjusted EBITDA under “Financial Outlook,” MediaAlpha is not providing a reconciliation of Adjusted EBITDA to net income (loss) because the Company is unable to predict with reasonable certainty the reconciling items that may affect net income (loss) without unreasonable effort, including equity-based compensation, transaction expenses and income tax expense. These reconciling items are uncertain, depend on various factors and could significantly impact, either individually or in the aggregate, the corresponding GAAP measures for the applicable period.
For a detailed explanation of the Company’s non-GAAP measures, please refer to the appendix section of this press release.
Conference Call Information
MediaAlpha will host a Q&A conference call today to discuss the Company's second quarter 2023 results and its financial outlook for the third quarter of 2023 at 2:00 p.m. Pacific Time (5:00 p.m. Eastern Time). A live audio webcast of the call will be available on the MediaAlpha Investor Relations website at https://investors.mediaalpha.com. To register for the webcast, click here. Participants may also dial-in, toll-free, at (888) 330-2022 or (646) 960-0690, with passcode 3195092. An audio replay of the conference call will be available for two weeks following the call and available on the MediaAlpha Investor Relations website at https://investors.mediaalpha.com.
We have also posted to our investor relations website a letter to shareholders. We have used, and intend to continue to use, our investor relations website at https://investors.mediaalpha.com as a means of disclosing material nonpublic information and for complying with our disclosure obligations under Regulation FD. Forward-Looking Statements
This press release contains forward-looking statements within the meaning of the Private Securities Litigation Reform Act of 1995, including without limitation statements regarding our expectation that customer acquisition spend by carriers will remain at cyclically low levels for the balance of this year, our belief that we will capture outsized growth as the auto insurance market recovers, and our financial outlook for the third quarter of 2023. These forward-looking statements reflect our current views with respect to, among other things, future events and our financial performance. These statements are often, but not always, made through the use of words or phrases such as “may,” “should,” “could,” “predict,” “potential,” “believe,” “will likely result,” “expect,” “continue,” “will,” “anticipate,” “seek,” “estimate,” “intend,” “plan,” “projection,” “would,” and “outlook,” or the negative version of those words or other comparable words or phrases of a future or forward-looking nature. These forward-looking statements are not historical facts, and are based on current expectations, estimates and projections about our industry, management’s beliefs and certain assumptions made by management, many of which, by their nature, are inherently uncertain and beyond our control. Accordingly, we caution you that any such forward-looking statements are not guarantees of future performance and are subject to risks, assumptions and uncertainties that are difficult to predict. Although we believe that the expectations reflected in these forward-looking statements are reasonable as of the date made, actual results may prove to be materially different from the results expressed or implied by the forward-looking statements.
There are or will be important factors that could cause our actual results to differ materially from those indicated in these forward-looking statements, including those more fully described in MediaAlpha’s filings with the Securities and Exchange Commission (“SEC”), including the Form 10-K filed on February 27, 2023. These factors should not be construed as exhaustive. MediaAlpha disclaims any obligation to update any forward-looking statements to reflect events or circumstances that occur after the date of this press release.
Non-GAAP Financial Measures and Operating Metrics
This press release includes Adjusted EBITDA and Contribution Margin, which are non-GAAP financial measures. The Company also presents Transaction Value, which is an operating metric not presented in accordance with GAAP. See the appendix for definitions of Adjusted EBITDA, Contribution, Contribution Margin and Transaction Value, as well as reconciliations to the corresponding GAAP financial metrics, as applicable.
We present Transaction Value, Adjusted EBITDA and Contribution Margin because they are used extensively by our management and board of directors to manage our operating performance, including evaluating our operational performance against budget and assessing our overall operating efficiency and operating leverage. Accordingly, we believe that Transaction Value, Adjusted EBITDA and Contribution Margin provide useful information to investors and others in understanding and evaluating our operating results in the same manner as our management team and board of directors. Each of Transaction Value, Adjusted EBITDA and Contribution Margin has limitations as a financial measure and investors should not consider it in isolation or as a substitute for analysis of our results as reported under GAAP.
Contacts:
Investors
Denise Garcia
Hayflower Partners
Denise@HayflowerPartners.com
MediaAlpha, Inc. and subsidiaries
Consolidated Balance Sheets
(Unaudited; in thousands, except share data and per share amounts)
| | | | | | | | | | | |
| June 30,
2023 | | December 31,
2022 |
| Assets | | | |
| Current assets | | | |
| Cash and cash equivalents | $ | 20,029 | | | $ | 14,542 | |
| Accounts receivable, net of allowance for credit losses of $325 and $575, respectively | 32,589 | | | 59,998 | |
| Prepaid expenses and other current assets | 3,484 | | | 5,880 | |
| Total current assets | 56,102 | | | 80,420 | |
| Intangible assets, net | 29,474 | | | 32,932 | |
| Goodwill | 47,739 | | | 47,739 | |
| | | |
| Other assets | 6,885 | | | 8,990 | |
| Total assets | $ | 140,200 | | | $ | 170,081 | |
| Liabilities and stockholders' deficit | | | |
| Current liabilities | | | |
| Accounts payable | $ | 37,815 | | | $ | 53,992 | |
| Accrued expenses | 13,241 | | | 14,130 | |
| Current portion of long-term debt | 8,787 | | | 8,770 | |
| Total current liabilities | 59,843 | | | 76,892 | |
| Long-term debt, net of current portion | 169,899 | | | 174,300 | |
| | | |
| Other long-term liabilities | 4,852 | | | 4,973 | |
| Total liabilities | $ | 234,594 | | | $ | 256,165 | |
| Commitments and contingencies (Note 7) | | | |
| Stockholders' (deficit): | | | |
| Class A common stock, $0.01 par value - 1.0 billion shares authorized; 45.9 million and 43.7 million shares issued and outstanding as of June 30, 2023 and December 31, 2022, respectively | 459 | | | 437 | |
| Class B common stock, $0.01 par value - 100 million shares authorized; 18.1 million and 18.9 million shares issued and outstanding as of June 30, 2023 and December 31, 2022, respectively | 181 | | | 189 | |
| Preferred stock, $0.01 par value - 50 million shares authorized; 0 shares issued and outstanding as of June 30, 2023 and December 31, 2022 | — | | | — | |
| Additional paid-in capital | 489,831 | | | 465,523 | |
| Accumulated deficit | (506,694) | | | (482,142) | |
| Total stockholders' (deficit) attributable to MediaAlpha, Inc. | $ | (16,223) | | | $ | (15,993) | |
| Non-controlling interests | (78,171) | | | (70,091) | |
| Total stockholders' (deficit) | $ | (94,394) | | | $ | (86,084) | |
| Total liabilities and stockholders' deficit | $ | 140,200 | | | $ | 170,081 | |
MediaAlpha, Inc. and subsidiaries
Consolidated Statements of Operations
(Unaudited; in thousands, except share data and per share amounts)
| | | | | | | | | | | | | | | | | | | | | | | |
| Three Months Ended
June 30, | | Six Months Ended
June 30, |
| 2023 | | 2022 | | 2023 | | 2022 |
| Revenue | $ | 84,772 | | | $ | 103,449 | | | $ | 196,402 | | | $ | 246,048 | |
| Costs and operating expenses | | | | | | | |
| Cost of revenue | 71,006 | | | 87,925 | | | 164,268 | | | 208,806 | |
| Sales and marketing | 6,707 | | | 7,958 | | | 13,701 | | | 15,181 | |
| Product development | 5,061 | | | 5,661 | | | 10,229 | | | 10,877 | |
| General and administrative | 18,070 | | | 12,316 | | | 33,825 | | | 29,464 | |
| Total costs and operating expenses | 100,844 | | | 113,860 | | | 222,023 | | | 264,328 | |
| (Loss) from operations | (16,072) | | | (10,411) | | | (25,621) | | | (18,280) | |
| Other (income) expense, net | (116) | | | 44 | | | 1,265 | | | (479) | |
| Interest expense | 3,874 | | | 1,956 | | | 7,450 | | | 3,315 | |
| Total other expense, net | 3,758 | | | 2,000 | | | 8,715 | | | 2,836 | |
| (Loss) before income taxes | (19,830) | | | (12,411) | | | (34,336) | | | (21,116) | |
| Income tax expense | 150 | | | 611 | | | 228 | | | 1,754 | |
| Net (loss) | $ | (19,980) | | | $ | (13,022) | | | $ | (34,564) | | | $ | (22,870) | |
| Net (loss) attributable to non-controlling interest | (5,694) | | | (3,883) | | | (10,012) | | | (6,655) | |
| Net (loss) attributable to MediaAlpha, Inc. | $ | (14,286) | | | $ | (9,139) | | | $ | (24,552) | | | $ | (16,215) | |
| Net (loss) per share of Class A common stock | | | | | | | |
| -Basic and diluted | $ | (0.32) | | | $ | (0.22) | | | $ | (0.55) | | | $ | (0.39) | |
| | | | | | | |
| Weighted average shares of Class A common stock outstanding | | | | | | | |
| -Basic and diluted | 45,160,646 | | | 41,705,344 | | | 44,518,890 | | | 41,279,146 | |
| | | | | | | |
MediaAlpha, Inc. and subsidiaries
Consolidated Statements of Cash Flows
(Unaudited; in thousands)
| | | | | | | | | | | |
| Six Months Ended
June 30, |
| 2023 | | 2022 |
| Cash flows from operating activities | | | |
| Net (loss) | $ | (34,564) | | | $ | (22,870) | |
| Adjustments to reconcile net (loss) to net cash provided by operating activities: | | | |
| Non-cash equity-based compensation expense | 29,489 | | | 29,616 | |
| Non-cash lease expense | 337 | | | 357 | |
| Depreciation expense on property and equipment | 188 | | | 197 | |
| Amortization of intangible assets | 3,458 | | | 2,360 | |
| Amortization of deferred debt issuance costs | 398 | | | 418 | |
| Change in fair value of contingent consideration | — | | | (2,845) | |
| Impairment of cost method investment | 1,406 | | | — | |
| Credit losses | (250) | | | (127) | |
| Deferred taxes | — | | | 1,630 | |
| Tax receivable agreement liability adjustments | 6 | | | (589) | |
| Changes in operating assets and liabilities: | | | |
| Accounts receivable | 27,659 | | | 38,691 | |
| Prepaid expenses and other current assets | 2,364 | | | 4,057 | |
| Other assets | 250 | | | 198 | |
| Accounts payable | (16,177) | | | (28,354) | |
| Accrued expenses | 1,777 | | | (2,629) | |
| Net cash provided by operating activities | $ | 16,341 | | | $ | 20,110 | |
| Cash flows from investing activities | | | |
| Purchases of property and equipment | (47) | | | (79) | |
| Cash consideration paid in connection with CHT acquisition | — | | | (49,677) | |
| Net cash (used in) investing activities | $ | (47) | | | $ | (49,756) | |
| Cash flows from financing activities | | | |
| Proceeds received from: | | | |
| Revolving credit facility | — | | | 25,000 | |
| Payments made for: | | | |
| | | |
| | | |
| Repayments on long-term debt | (4,750) | | | (4,750) | |
| | | |
| Repurchases of Class A common stock | — | | | (3,382) | |
| Distributions | (1,296) | | | (590) | |
| Payments pursuant to tax receivable agreement | (2,822) | | | (216) | |
| Shares withheld for taxes on vesting of restricted stock units | (1,939) | | | (1,786) | |
| Net cash (used in) provided by financing activities | $ | (10,807) | | | $ | 14,276 | |
| Net increase (decrease) in cash and cash equivalents | 5,487 | | | (15,370) | |
| Cash and cash equivalents, beginning of period | 14,542 | | | 50,564 | |
| Cash and cash equivalents, end of period | $ | 20,029 | | | $ | 35,194 | |
Key business and operating metrics and Non-GAAP financial measures
Transaction Value
We define “Transaction Value” as the total gross dollars transacted by our partners on our platform. Transaction Value is a driver of revenue, with differing revenue recognition based on the economic relationship we have with our partners. Our partners use our platform to transact via Open and Private Marketplace transactions. In our Open Marketplace model, Transaction Value is equal to revenue recognized and revenue share payments to our supply partners represent costs of revenue. In our Private Marketplace model, revenue recognized represents a platform fee billed to the demand partner or supply partner based on an agreed-upon percentage of the Transaction Value for the Consumer Referrals transacted, and accordingly there are no associated costs of revenue. We utilize Transaction Value to assess revenue and to assess the overall level of transaction activity through our platform. We believe it is useful to investors to assess the overall level of activity on our platform and to better understand the sources of our revenue across our different transaction models and verticals.
The following table presents Transaction Value by platform model for the three and six months ended June 30, 2023 and 2022:
| | | | | | | | | | | | | | | | | | | | | | | | | | |
| | Three Months Ended
June 30, | | Six Months Ended
June 30, |
| (dollars in thousands) | | 2023 | | 2022 | | 2023 | | 2022 |
| Open Marketplace transactions | | $ | 82,856 | | | $ | 99,633 | | | $ | 190,515 | | | $ | 237,729 | |
| Percentage of total Transaction Value | | 65.8 | % | | 54.5 | % | | 59.7 | % | | 56.3 | % |
| Private Marketplace transactions | | 43,055 | | | 83,237 | | | 128,561 | | | 184,154 | |
| Percentage of total Transaction Value | | 34.2 | % | | 45.5 | % | | 40.3 | % | | 43.7 | % |
| Total Transaction Value | | $ | 125,911 | | | $ | 182,870 | | | $ | 319,076 | | | $ | 421,883 | |
The following table presents Transaction Value by vertical for the three and six months ended June 30, 2023 and 2022:
| | | | | | | | | | | | | | | | | | | | | | | | | | |
| | Three Months Ended
June 30, | | Six Months Ended
June 30, |
| (dollars in thousands) | | 2023 | | 2022 | | 2023 | | 2022 |
| Property & Casualty insurance | | $ | 60,666 | | | $ | 111,930 | | | $ | 178,590 | | | $ | 260,014 | |
| Percentage of total Transaction Value | | 48.2 | % | | 61.2 | % | | 56.0 | % | | 61.6 | % |
| Health insurance | | 50,828 | | | 46,394 | | | 110,240 | | | 106,649 | |
| Percentage of total Transaction Value | | 40.4 | % | | 25.4 | % | | 34.5 | % | | 25.3 | % |
| Life insurance | | 8,359 | | | 12,467 | | | 18,476 | | | 24,858 | |
| Percentage of total Transaction Value | | 6.6 | % | | 6.8 | % | | 5.8 | % | | 5.9 | % |
Other(1) | | 6,058 | | | 12,079 | | | 11,770 | | | 30,362 | |
| Percentage of total Transaction Value | | 4.8 | % | | 6.6 | % | | 3.7 | % | | 7.2 | % |
| Total Transaction Value | | $ | 125,911 | | | $ | 182,870 | | | $ | 319,076 | | | $ | 421,883 | |
(1)Our other verticals include Travel, Education and Consumer Finance.
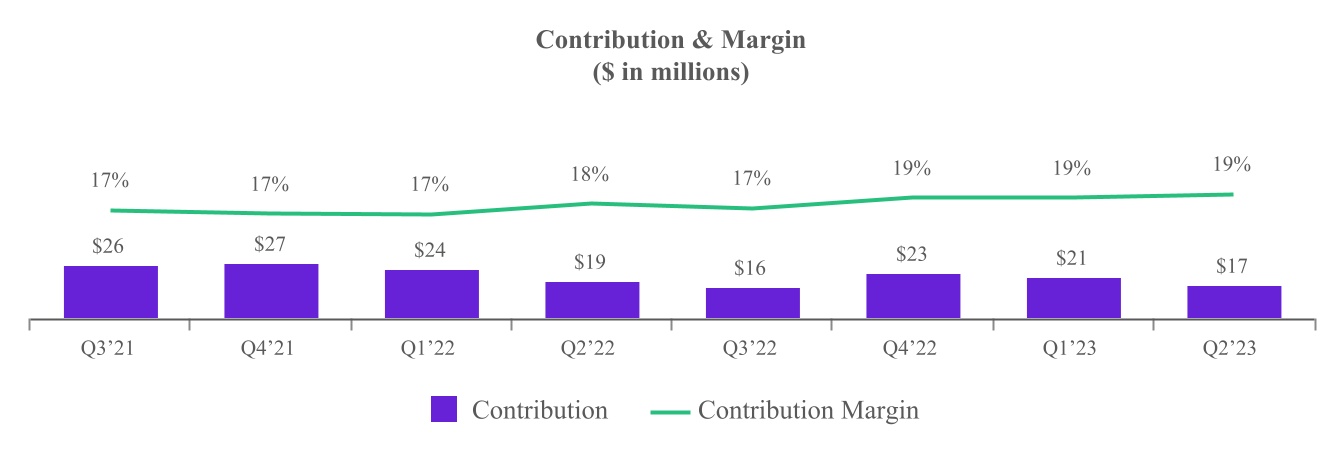
Contribution and Contribution Margin
We define “Contribution” as revenue less revenue share payments and online advertising costs, or, as reported in our consolidated statements of operations, revenue less cost of revenue (i.e., gross profit), as adjusted to exclude the following items from cost of revenue: equity-based compensation; salaries, wages, and related costs; internet and hosting costs; amortization; depreciation; other services; and merchant-related fees. We define “Contribution Margin” as Contribution expressed as a percentage of revenue for the same period. Contribution and Contribution Margin are non-GAAP financial measures that we present to supplement the financial information we present on a GAAP basis. We use Contribution and Contribution Margin to measure the return on our relationships with our supply partners (excluding certain fixed costs), the financial return on and efficacy of our online advertising costs to drive consumers to our proprietary websites, and our operating leverage. We do not use Contribution and Contribution Margin as measures of overall profitability. We present Contribution and Contribution Margin because they are used by our management and board of directors to manage our operating performance, including evaluating our operational performance against budget and assessing our overall operating efficiency and operating leverage. For example, if Contribution increases and our headcount costs and other operating expenses remain steady, our Adjusted EBITDA and operating leverage increase. If Contribution Margin decreases, we may choose to re-evaluate and re-negotiate our revenue share agreements with our supply partners, to make optimization and pricing changes with respect to our bids for keywords from primary traffic acquisition sources, or to change our overall cost structure with respect to headcount, fixed costs and other costs. Other companies may calculate Contribution and Contribution Margin differently than we do. Contribution and Contribution Margin have their limitations as analytical tools, and you should not consider them in isolation or as substitutes for analysis of our results presented in accordance with GAAP.
The following table reconciles Contribution with gross profit, the most directly comparable financial measure calculated and presented in accordance with GAAP, for the three and six months ended June 30, 2023 and 2022:
| | | | | | | | | | | | | | | | | | | | | | | | | | |
| | Three Months Ended
June 30, | | Six Months Ended
June 30, |
| (in thousands) | | 2023 | | 2022 | | 2023 | | 2022 |
| Revenue | | $ | 84,772 | | | $ | 103,449 | | | $ | 196,402 | | | $ | 246,048 | |
| Less cost of revenue | | (71,006) | | | (87,925) | | | (164,268) | | | (208,806) | |
| Gross profit | | 13,766 | | | 15,524 | | | 32,134 | | | 37,242 | |
| Adjusted to exclude the following (as related to cost of revenue): | | | | | | | | |
| Equity-based compensation | | 981 | | | 1,240 | | | 1,947 | | | 1,638 | |
| Salaries, wages, and related | | 907 | | | 1,034 | | | 1,954 | | | 1,690 | |
| Internet and hosting | | 130 | | | 119 | | | 280 | | | 223 | |
| Other expenses | | 162 | | | 215 | | | 334 | | | 342 | |
| Depreciation | | 10 | | | 12 | | | 21 | | | 18 | |
| Other services | | 566 | | | 576 | | | 1,281 | | | 1,106 | |
| Merchant-related fees | | 7 | | | 44 | | | 3 | | | 59 | |
| Contribution | | 16,529 | | | 18,764 | | | 37,954 | | | 42,318 | |
| Gross margin | | 16.2 | % | | 15.0 | % | | 16.4 | % | | 15.1 | % |
| Contribution Margin | | 19.5 | % | | 18.1 | % | | 19.3 | % | | 17.2 | % |
Adjusted EBITDA
We define “Adjusted EBITDA” as net income excluding interest expense, income tax benefit (expense), depreciation expense on property and equipment, amortization of intangible assets, as well as equity-based compensation expense and certain other adjustments as listed in the table below. Adjusted EBITDA is a non-GAAP financial measure that we present to supplement the financial information we present on a GAAP basis. We monitor and present Adjusted EBITDA because it is a key measure used by our management to understand and evaluate our operating performance, to establish budgets and to develop operational goals for managing our business. We believe that Adjusted EBITDA helps identify underlying trends in our business that could otherwise be masked by the effect of the expenses that we exclude in the calculations of Adjusted EBITDA. Accordingly, we believe that Adjusted EBITDA provides useful information to investors and others in understanding and evaluating our operating results, enhancing the overall understanding of our past performance and future prospects. In addition, presenting Adjusted EBITDA provides investors with a metric to evaluate the capital efficiency of our business.
Adjusted EBITDA is not presented in accordance with GAAP and should not be considered in isolation of, or as an alternative to, measures presented in accordance with GAAP. There are a number of limitations related to the use of Adjusted EBITDA rather than net income, which is the most directly comparable financial measure calculated and presented in accordance with GAAP. These limitations include the fact that Adjusted EBITDA excludes interest expense on debt, income tax benefit (expense), equity-based compensation expense, depreciation and amortization, and certain other adjustments that we consider useful information to investors and others in understanding and evaluating our operating results. In addition, other companies may use other measures to evaluate their performance, including different definitions of “Adjusted EBITDA,” which could reduce the usefulness of our Adjusted EBITDA as a tool for comparison.
The following table reconciles Adjusted EBITDA with net (loss), the most directly comparable financial measure calculated and presented in accordance with GAAP, for the three and six months ended June 30, 2023 and 2022: | | | | | | | | | | | | | | | | | | | | | | | | | | |
| | Three Months Ended
June 30, | | Six Months Ended
June 30, |
| (in thousands) | | 2023 | | 2022 | | 2023 | | 2022 |
| Net (loss) | | $ | (19,980) | | | $ | (13,022) | | | $ | (34,564) | | | $ | (22,870) | |
| Equity-based compensation expense | | 15,148 | | | 15,843 | | | 29,489 | | | 29,616 | |
| Interest expense | | 3,874 | | | 1,956 | | | 7,450 | | | 3,315 | |
| Income tax expense | | 150 | | | 611 | | | 228 | | | 1,754 | |
| Depreciation expense on property and equipment | | 92 | | | 99 | | | 188 | | | 197 | |
| Amortization of intangible assets | | 1,729 | | | 1,677 | | | 3,458 | | | 2,360 | |
Transaction expenses(1) | | 254 | | | 150 | | | 548 | | | 530 | |
| | | | | | | | |
SOX implementation costs(2) | | — | | | — | | | — | | | 110 | |
Fair value adjustment to contingent consideration(3) | | — | | | (2,845) | | | — | | | (2,845) | |
| Impairment of cost method investment | | — | | | — | | | 1,406 | | | — | |
| | | | | | | | |
Changes in TRA related liability(4) | | — | | | 40 | | | 6 | | | (590) | |
Changes in Tax Indemnification Receivable(5) | | (14) | | | (15) | | | (28) | | | (29) | |
Settlement of federal and state income tax refunds(6) | | — | | | 4 | | | 3 | | | 92 | |
Legal expenses(7) | | 1,106 | | | — | | | 1,439 | | | — | |
Reduction in force costs (8) | | 1,233 | | | — | | | $ | 1,233 | | | $ | — | |
| Adjusted EBITDA | | $ | 3,592 | | | $ | 4,498 | | | $ | 10,856 | | | $ | 11,640 | |
(1)Transaction expenses consist of $0.3 million and $0.5 million of legal, and accounting fees incurred by us for the three and six months ended June 30, 2023, respectively, in connection with the amendment to the 2021 Credit Facilities, the tender offer filed by the Company's largest shareholder in May 2023, and a resale registration statement filed with the SEC. For the three and six months ended June 30, 2022, transaction expenses consist of $0.2 million and $0.5 million of expenses, respectively, incurred by us in connection with our acquisition of CHT.
(2)SOX implementation costs consist of $0.1 million of expenses for the six months ended June 30, 2022 for third-party consultants to assist us with the development, implementation, and documentation of new and enhanced internal controls and processes for compliance with SOX Section 404(b) for fiscal 2021.
(3)Fair value adjustment to contingent consideration consists of $2.8 million of gain for the three and six months ended June 30, 2022, in connection with the remeasurement of the contingent consideration for the acquisition of CHT as of June 30, 2022.
(4)Changes in TRA related liability consist of immaterial expenses for the six months ended June 30, 2023, and immaterial expenses and $0.6 million of income for the three and six months ended June 30, 2022, respectively, due to a change in the estimated future state tax benefits and other changes in the estimate resulting in reductions of the TRA liability.
(5)Changes in Tax Indemnification Receivable consists of immaterial income for the three and six months ended June 30, 2023 and 2022, related to a reduction in the tax indemnification receivable recorded in connection with the Reorganization Transactions. The reduction also resulted in a benefit of the same amount which has been recorded within income tax expense.
(6)Settlement of federal and state tax refunds consist of immaterial expenses incurred by us for the six months ended June 30, 2023, and immaterial expenses and $0.1 million of expense incurred by us for the three and six months ended June 30, 2022, respectively, related to a payment to White Mountains for state tax refunds for the period prior to the Reorganization Transactions related to 2020 tax returns. The settlement also resulted in a benefit of the same amount which has been recorded within income tax expense.
(7)Legal expenses of $1.1 million and $1.4 million for the three and six months ended June 30, 2023, respectively, consist of legal fees incurred in connection with a civil investigative demand received from the Federal Trade Commission (FTC) in February 2023.
(8)Reduction in force costs for the three and six months ended June 30, 2023 consist of $1.2 million of severance benefits provided to the terminated employees in connection with the plan to reduce our workforce implemented in May 2023. Additionally, equity-based compensation expense includes $0.3 million of charges related to the plan for the three and six months ended June 30, 2023.
| | | | | |
| |
|
|
SHAREHOLDER LETTER Q2 2023 |
|
| |
| |
| | | | | | | | | | | |
| Q2 | |
| (in millions, except percentages) | 2022 | 2023 | YoY Change |
| | | |
| Revenue | $103.4 | $84.8 | (18)% |
Transaction Value 1 | $182.9 | $125.9 | (31)% |
| | | | |
| | | | |
| Gross Profit | $15.5 | $13.8 | (11)% |
Contribution 1 | $18.8 | $16.5 | (12)% |
| | | |
| | | | |
| Net (Loss) | $(13.0) | $(20.0) | 53% |
Adjusted EBITDA 1 | $4.5 | $3.6 | (20)% |
| | | |
| | | |
__________________
1.See “Key Business and Operating Metrics and Non-GAAP Financial Measures” for additional information regarding non-GAAP metrics used in this shareholder letter.
Our second quarter 2023 results exceeded expectations, driven primarily by strength in our Health insurance vertical. As expected, Transaction Value declined 46% year over year in our Property & Casualty (P&C) insurance vertical as a major carrier further reduced its marketing investments over the course of the second quarter. Collectively, the spend of all other P&C partners was roughly stable between the first and second quarters. Despite Transaction Value declining $57 million or 31% year over year during the second quarter, Adjusted EBITDA decreased less than $1 million or 20% year over year due to the workforce reduction we implemented in May, continued expense discipline, and stronger gross margin due to favorable mix.
In our P&C vertical, we expect our results to continue to be negatively impacted by the hard market environment in auto insurance for the balance of the year, as carriers continue to struggle to restore underwriting profitability. We expect Transaction Value to decrease 40% to 50% year over year in the third quarter, consistent with the year-over-year decline in the second quarter. We continue to believe that as carriers achieve rate adequacy and reprioritize growth, P&C Transaction Value will rebound positively and sharply, resulting in attractive year-over-year growth rates and market share gains due to our above-average exposure to direct carrier marketing spend.
Turning to our Health vertical, second quarter Transaction Value grew 10% year over year, as our results in both Medicare and Under 65 health insurance exceeded our expectations. We remain bullish on industry volume growth over the long term, particularly in Medicare Advantage, as carriers continue to pursue this market opportunity and more seniors shop for policies online. For the third quarter, we expect Transaction Value in our Health vertical to grow at a similar rate to what we delivered in the second quarter, as we continue to benefit from our strong relationships with leading carriers and other industry partners.
Shifting focus to our balance sheet and cash flow, we once again generated positive free cash flow during the second quarter, and we expect to continue to be in compliance with the financial covenants under our credit facilities. In the near term, we will continue to use all excess cash to reduce net debt. Other capital deployment activity, including share buybacks and M&A, remain on hold for now in order to preserve financial flexibility.
In June, our largest shareholder (White Mountains) executed a public tender of our Class A common stock, acquiring 5.9 million shares at a fixed price of $10.00 per share. The tender offer price represented a 32% premium to the closing price of our shares on May 25th, the day before the tender offer was announced. White Mountains now owns 49% of our Class A common shares or 36% of our total outstanding shares. White Mountains stated that the offer was based on their belief that our shares represented an attractive investment and was not made for the purpose of acquiring or influencing control. There has been no change to the relationship between White Mountains and MediaAlpha.
Looking forward, we are optimistic about the long-term growth outlook for our business. In Health, we are excited by the prospects of a growing Medicare-eligible population that is increasingly opting to enroll in Medicare Advantage plans, which provide benefits that seniors value, such as zero co-pays for primary care visits and zero monthly premiums. We expect this trend to drive significant future growth in our Health vertical. Our expectations surrounding the trajectory of the P&C market recovery remain unchanged. Although market dynamics have resulted in a bumpy ride this year, we believe we are well positioned to take advantage of the smoother roads ahead to deliver significant top-line growth while driving operating leverage through focused expense discipline.
| | |
| Financial Discussion - Transaction Value and Revenue Metrics |
Transaction Value declined 31% year over year to $125.9 million in Q2 2023, driven primarily by a 46% decline in the P&C vertical as most carriers continued to limit their marketing investments due to underwriting profitability concerns, as well as by a pullback in spend from Q1 levels by a major carrier partner. Transaction Value represents the total gross investment in customer acquisition executed by our partners on our platform and is one of the key metrics that reflects our ability to drive value for our partners and increase our share of wallet as budgets increasingly migrate online.
Transaction Value generated from our insurance verticals was $119.9 million in Q2 2023, down 30% year over year.
Transaction Value from our P&C insurance vertical declined 46% year over year to $60.7 million, driven by significant year-over-year reductions in customer acquisition spending by many of our carrier partners due to ongoing underwriting profitability concerns. Many of our carrier partners continue to experience higher-than-expected loss severity caused by elevated vehicle repair and replacement costs and overall inflationary pressures, and we do not expect them to significantly increase customer acquisition spending until underwriting results improve.
Transaction Value from our Health insurance vertical increased 10% year over year to $50.8 million, due primarily to higher demand for calls.
Transaction Value from our Life insurance vertical declined 33% year over year to $8.4 million, as one of our publisher partners, transacting primarily through our Private Marketplace, shifted focus away from the vertical coupled with reduced shopping activity, as mortality concerns related to COVID-19 continued to ease.
Transaction Value from our Other vertical, which includes travel, education, and consumer finance, declined 50% year over year to $6.1 million, driven by the wind down of our education vertical, which was completed as of the beginning of Q3 2022.
We generated $84.8 million of total revenue in Q2 2023, down 18% year over year, driven by lower revenue from our P&C insurance vertical.
Revenue from our P&C insurance vertical declined 31% year over year to $39.5 million in Q2 2023, driven by lower marketing budgets from the largest carriers due to the aforementioned profitability concerns, offset in part by a higher mix of transactions via our Open Marketplace. This was driven by a lower share of transactions on our platform coming from a major P&C demand partner that utilizes our Private Marketplace option for a higher than average proportion of their transactions. While we recognize the full amount of Transaction Value from Open Marketplace transactions as revenue, in Private Marketplace transactions we recognize only our platform fee as revenue.
Revenue from our Health insurance vertical increased 7% year over year to $35.6 million in Q2 2023, driven by increased demand for calls. Health revenue increased by a lower percentage than Transaction Value due to a slightly lower mix of transactions via our Open Marketplace.
Revenue from our Life insurance vertical declined 16% year over year to $5.9 million in Q2 2023, as mortality concerns related to COVID continued to ease and shopping activity decreased.
Revenue from our Other vertical, which consists of travel, education, and consumer finance, declined 34% year over year to $3.8 million in Q2 2023, driven by the 50% decline in Transaction Value. Revenue declined by a lower percentage than Transaction Value due to our education vertical transacting primarily on the Private Marketplace, where revenue is recognized on a net basis.
| | |
Financial Discussion - Profitability |
Gross profit was $13.8 million in Q2 2023, a year-over-year decrease of 11%. Contribution, which generally represents revenue less revenue share payments and online advertising costs, was $16.5 million in Q2 2023, a year-over-year decrease of 12%. Contribution Margin was 19.5% in Q2 2023, compared with 18.1% in Q2 2022. The increase in margin was driven by higher margins in both our P&C and Health verticals.
Net loss was $20.0 million in Q2 2023, compared with $13.0 million in Q2 2022. The higher net loss was driven primarily by an increase in interest expense of $1.9 million, severance benefits of $1.5 million paid in connection with the reduction in force implemented in May 2023, higher legal costs of $1.5 million driven primarily by $1.1 million incurred in connection with the civil investigative demand received from the Federal Trade Commission, and a gain of $2.8 million recorded during Q2 2022 in connection with the remeasurement of the contingent consideration for our CHT acquisition.
Adjusted EBITDA was $3.6 million in Q2 2023, a year-over-year decrease of 20%. Adjusted EBITDA margin was 4.2% in Q2 2023, compared with 4.3% in Q2 2022. The decrease was driven primarily by the $1.8 million year-over-year decrease in Gross Profit, offset in part by a $0.9 million decrease in operating expenses, net of Adjusted EBITDA add backs.
Financial Discussion - Q3 2023 Outlook 1 | | | | | | | | | | | | | | |
| | Q3 2023 |
Transaction Value 2 | | $95 million | - | $110 million |
| Y/Y Growth | | (35)% | | (25)% |
| | | | |
| | | | |
| Revenue | | $65 million | - | $75 million |
| Y/Y Growth | | (27)% | | (16)% |
| | | | |
| | | | |
Adjusted EBITDA 2 | | $1.5 million | - | $3.5 million |
| Y/Y Growth | | (31)% | | 61% |
Our guidance for Q3 2023 reflects a continuation of low customer acquisition spend levels by P&C carriers as they prioritize profitability over growth. As a result, we expect third quarter Transaction Value in our P&C insurance vertical to decline year over year by 40% to 50%. In addition, we expect third quarter Transaction Value in our Health vertical to grow year over year at a rate similar to the second quarter.
Transaction Value: For Q3 2023, we expect Transaction Value to be in the range of $95 million - $110 million, a year-over-year decrease of 30% at the midpoint.
Revenue: For Q3 2023, we expect revenue to be in the range of $65 million - $75 million, a year-over-year decrease of 21% at the midpoint.
Adjusted EBITDA: For Q3 2023, we expect Adjusted EBITDA to be between $1.5 million and $3.5 million, a year-over-year increase of 15% at the midpoint. We are projecting our operating expenses, net of Adjusted EBITDA addbacks, to be approximately $1.5 million lower than Q2 2023 levels, driven by both a full quarter’s impact of the May workforce reduction and continued expense discipline.
Thank you, | | | | | | | | |
| Steve Yi | | Patrick Thompson |
| Chief Executive Officer, President and Co-Founder | | Chief Financial Officer & Treasurer |
1 With respect to the Company’s projection of Adjusted EBITDA under “Financial Discussion – Q3 2023 Outlook”, MediaAlpha is not providing a reconciliation of Adjusted EBITDA to net income (loss) because the Company is unable to predict with reasonable certainty the reconciling items that may affect net income (loss) without unreasonable effort, including equity-based compensation, transaction expenses and income tax expense. These reconciling items are uncertain, depend on various factors and could significantly impact, either individually or in the aggregate, the GAAP measures for the applicable period.
2 See “Key Business and Operating Metrics and Non-GAAP Financial Measures” for additional information regarding non-GAAP metrics used in this shareholder letter.
| | |
Key Business and Operating Metrics and Non-GAAP Financial Measures |
In addition to traditional financial metrics, we rely upon certain business and operating metrics that are not presented in accordance with GAAP to estimate the volume of spending on our platform, estimate and recognize revenue, evaluate our business performance and facilitate our operations. Such business and operating metrics should not be considered in isolation from, or as an alternative to, measures presented in accordance with GAAP and should be considered together with other operating and financial performance measures presented in accordance with GAAP. Also, such business and operating metrics may not necessarily be comparable to similarly titled measures presented by other companies.
Transaction Value
We define “Transaction Value” as the total gross dollars transacted by our partners on our platform. Transaction Value is a driver of revenue, with differing revenue recognition based on the economic relationship we have with our partners. Our partners use our platform to transact via Open and Private Marketplace transactions. In our Open Marketplace model, Transaction Value is equal to revenue recognized and revenue share payments to our supply partners represent costs of revenue. In our Private Marketplace model, revenue recognized represents a platform fee billed to the demand partner or supply partner based on an agreed-upon percentage of the Transaction Value for the Consumer Referrals transacted, and accordingly there are no associated costs of revenue. We utilize Transaction Value to assess revenue and to assess the overall level of transaction activity through our platform. We believe it is useful to investors to assess the overall level of activity on our platform and to better understand the sources of our revenue across our different transaction models and verticals.
The following table presents Transaction Value by platform model for the three and six months ended June 30, 2023 and 2022:
| | | | | | | | | | | | | | | | | | | | | | | |
| Three Months Ended June 30, | | Six Months Ended June 30, |
| (in thousands) | 2023 | | 2022 | | 2023 | | 2022 |
| Open Marketplace transactions | $ | 82,856 | | | $ | 99,633 | | | $ | 190,515 | | | $ | 237,729 | |
| Percentage of total Transaction Value | 65.8 | % | | 54.5 | % | | 59.7 | % | | 56.3 | % |
| Private Marketplace transactions | 43,055 | | | 83,237 | | | 128,561 | | | 184,154 | |
| Percentage of total Transaction Value | 34.2 | % | | 45.5 | % | | 40.3 | % | | 43.7 | % |
| Total Transaction Value | $ | 125,911 | | | $ | 182,870 | | | $ | 319,076 | | | $ | 421,883 | |
The following table presents Transaction Value by vertical for the three and six months ended June 30, 2023 and 2022:
| | | | | | | | | | | | | | | | | | | | | | | |
| Three Months Ended June 30, | | Six Months Ended June 30, |
| (in thousands) | 2023 | | 2022 | | 2023 | | 2022 |
| Property & Casualty insurance | $ | 60,666 | | | $ | 111,930 | | | $ | 178,590 | | | $ | 260,014 | |
| Percentage of total Transaction Value | 48.2 | % | | 61.2 | % | | 56.0 | % | | 61.6 | % |
| Health insurance | 50,828 | | | 46,394 | | | 110,240 | | | 106,649 | |
| Percentage of total Transaction Value | 40.4 | % | | 25.4 | % | | 34.5 | % | | 25.3 | % |
| Life insurance | 8,359 | | | 12,467 | | | 18,476 | | | 24,858 | |
| Percentage of total Transaction Value | 6.6 | % | | 6.8 | % | | 5.8 | % | | 5.9 | % |
| Other | 6,058 | | | 12,079 | | | 11,770 | | | 30,362 | |
| Percentage of total Transaction Value | 4.8 | % | | 6.6 | % | | 3.7 | % | | 7.2 | % |
| Total Transaction Value | $ | 125,911 | | | $ | 182,870 | | | $ | 319,076 | | | $ | 421,883 | |
Contribution and Contribution Margin
We define “Contribution” as revenue less revenue share payments and online advertising costs, or, as reported in our consolidated statements of operations, revenue less cost of revenue (i.e., gross profit), as adjusted to exclude the following items from cost of revenue: equity-based compensation; salaries, wages, and related costs; internet and hosting costs; amortization; depreciation; other services; and merchant-related fees. We define “Contribution Margin” as Contribution expressed as a percentage of revenue for the same period. Contribution and Contribution Margin are non-GAAP financial measures that we present to supplement the financial information we present on a GAAP basis. We use Contribution and Contribution Margin to measure the return on our relationships with our supply partners (excluding certain fixed costs), the financial return on and efficacy of our online advertising costs to drive consumers to our proprietary websites, and our operating leverage. We do not use Contribution and Contribution Margin as measures of overall profitability. We present Contribution and Contribution Margin because they are used by our management and board of directors to manage our operating performance, including evaluating our operational performance against budget and assessing our overall operating efficiency and operating leverage. For example, if Contribution increases and our headcount costs and other operating expenses remain steady, our Adjusted EBITDA and operating leverage increase. If Contribution Margin decreases, we may choose to re-evaluate and re-negotiate our revenue share agreements with our supply partners, to make optimization and pricing changes with respect to our bids for keywords from primary traffic acquisition sources, or to change our overall cost structure with respect to headcount, fixed costs and other costs. Other companies may calculate Contribution and Contribution Margin differently than we do. Contribution and Contribution Margin have their limitations as analytical tools, and you should not consider them in isolation or as substitutes for analysis of our results presented in accordance with GAAP.
The following table reconciles Contribution with gross profit, the most directly comparable financial measure calculated and presented in accordance with GAAP, for the three and six months ended June 30, 2023 and 2022:
| | | | | | | | | | | | | | | | | | | | | | | |
| Three Months Ended June 30, | | Six Months Ended June 30, |
| (in thousands) | 2023 | | 2022 | | 2023 | | 2022 |
| Revenue | $ | 84,772 | | | $ | 103,449 | | | $ | 196,402 | | | $ | 246,048 | |
| Less cost of revenue | (71,006) | | | (87,925) | | | (164,268) | | | (208,806) | |
| Gross profit | $ | 13,766 | | | $ | 15,524 | | | $ | 32,134 | | | $ | 37,242 | |
| Adjusted to exclude the following (as related to cost of revenue): | | | | | | | |
| Equity-based compensation | 981 | | | 1,240 | | | 1,947 | | | 1,638 | |
| Salaries, wages, and related | 907 | | | 1,034 | | | 1,954 | | | 1,690 | |
| Internet and hosting | 130 | | | 119 | | | 280 | | | 223 | |
| Other expenses | 162 | | | 215 | | | 334 | | | 342 | |
| Depreciation | 10 | | | 12 | | | 21 | | | 18 | |
| Other services | 566 | | | 576 | | | 1,281 | | | 1,106 | |
| Merchant-related fees | 7 | | | 44 | | | 3 | | | 59 | |
| Contribution | $ | 16,529 | | | $ | 18,764 | | | $ | 37,954 | | | $ | 42,318 | |
| Gross margin | 16.2 | % | | 15.0 | % | | 16.4 | % | | 15.1 | % |
| Contribution Margin | 19.5 | % | | 18.1 | % | | 19.3 | % | | 17.2 | % |
Consumer Referrals
We define “Consumer Referral” as any consumer click, call or lead purchased by a buyer on our platform. Click revenue is recognized on a pay-per-click basis and revenue is earned and recognized when a consumer clicks on a listed buyer’s advertisement that is presented subsequent to the consumer’s search (e.g., auto insurance quote search or health insurance quote search). Call revenue is earned and recognized when a consumer transfers to a buyer and remains engaged for a requisite duration of time, as specified by each buyer. Lead revenue is recognized when we deliver data leads to buyers. Data leads are generated either through insurance carriers, insurance-focused research destination websites or other financial websites that make the data leads available for purchase through our platform, or when consumers complete a full quote request on our proprietary websites. Delivery occurs at the time of lead transfer. The data we generate from each Consumer Referral feeds into our analytics model to generate conversion probabilities for each unique consumer, enabling discovery of predicted return and cost per sale across the platform and helping us to improve our platform technology. We monitor the number of Consumer Referrals on our platform in order to measure Transaction Value, revenue and overall business performance across our verticals and platform models.
The following table presents the percentages of total Transaction Value generated from clicks, calls and leads for the three and six months ended June 30, 2023 and 2022:
| | | | | | | | | | | | | | | | | | | | | | | |
| Three Months Ended June 30, | | Six Months Ended June 30, |
| 2023 | | 2022 | | 2023 | | 2022 |
| Clicks | 70.2 | % | | 79.1 | % | | 75.4 | % | | 78.3 | % |
| Calls | 17.5 | % | | 12.0 | % | | 14.7 | % | | 11.8 | % |
| Leads | 12.3 | % | | 8.9 | % | | 9.9 | % | | 9.9 | % |
Adjusted EBITDA
We define “Adjusted EBITDA” as net income excluding interest expense, income tax benefit (expense), depreciation expense on property and equipment, amortization of intangible assets, as well as equity-based compensation expense and certain other adjustments as listed in the table below. We define “Adjusted EBITDA Margin” as Adjusted EBITDA as a percentage of revenue. Adjusted EBITDA is a non-GAAP financial measure that we present to supplement the financial information we present on a GAAP basis. We monitor and present Adjusted EBITDA because it is a key measure used by our management to understand and evaluate our operating performance, to establish budgets and to develop operational goals for managing our business. We believe that Adjusted EBITDA helps identify underlying trends in our business that could otherwise be masked by the effect of the expenses that we exclude in the calculations of Adjusted EBITDA. Accordingly, we believe that Adjusted EBITDA provides useful information to investors and others in understanding and evaluating our operating results, enhancing the overall understanding of our past performance and future prospects. In addition, presenting Adjusted EBITDA provides investors with a metric to evaluate the capital efficiency of our business.
Adjusted EBITDA is not presented in accordance with GAAP and should not be considered in isolation of, or as an alternative to, measures presented in accordance with GAAP. There are a number of limitations related to the use of Adjusted EBITDA rather than net income, which is the most directly comparable financial measure calculated and presented in accordance with GAAP. These limitations include the fact that Adjusted EBITDA excludes interest expense on debt, income tax benefit (expense), equity-based compensation expense, depreciation and amortization, and certain other adjustments that we consider useful information to investors and others in understanding and evaluating our operating results. In addition, other companies may use other measures to evaluate their performance, including different definitions of “Adjusted EBITDA,” which could reduce the usefulness of our Adjusted EBITDA as a tool for comparison.
The following table reconciles Adjusted EBITDA with net (loss), the most directly comparable financial measure calculated and presented in accordance with GAAP, for the three and six months ended June 30, 2023 and 2022:
| | | | | | | | | | | | | | | | | | | | | | | |
| Three Months Ended June 30, | | Six Months Ended June 30, |
| (in thousands) | 2023 | | 2022 | | 2023 | | 2022 |
| Net (loss) | $ | (19,980) | | | $ | (13,022) | | | $ | (34,564) | | | $ | (22,870) | |
| Equity-based compensation expense | 15,148 | | | 15,843 | | | 29,489 | | | 29,616 | |
| Interest expense | 3,874 | | | 1,956 | | | 7,450 | | | 3,315 | |
| Income tax expense | 150 | | | 611 | | | 228 | | | 1,754 | |
| Depreciation expense on property and equipment | 92 | | | 99 | | | 188 | | | 197 | |
| Amortization of intangible assets | 1,729 | | | 1,677 | | | 3,458 | | | 2,360 | |
| Transaction expenses(1) | 254 | | | 150 | | | 548 | | | 530 | |
| | | | | | | |
| SOX implementation costs(2) | — | | | — | | | — | | | 110 | |
| Fair value adjustment to contingent consideration(3) | — | | | (2,845) | | | — | | | (2,845) | |
| Impairment of cost method investment | — | | | — | | | 1,406 | | | — | |
| | | | | | | |
| Changes in TRA related liability(4) | — | | | 40 | | | 6 | | | (590) | |
| Changes in Tax Indemnification Receivable(5) | (14) | | | (15) | | | (28) | | | (29) | |
| Settlement of federal and state income tax refunds(6) | — | | | 4 | | | 3 | | | 92 | |
| Legal expenses(7) | 1,106 | | | — | | | 1,439 | | | — | |
| Reduction in force costs (8) | 1,233 | | | — | | | 1,233 | | | — | |
| Adjusted EBITDA | $ | 3,592 | | | $ | 4,498 | | | $ | 10,856 | | | $ | 11,640 | |
(1)Transaction expenses consist of $0.3 million and $0.5 million of legal, and accounting fees incurred by us for the three and six months ended June 30, 2023, respectively, in connection with the amendment to the 2021 Credit Facilities, the tender offer filed by the Company's largest shareholder in May 2023, and a resale registration statement filed with the SEC. For the three and six months ended June 30, 2022, transaction expenses consist of $0.2 million and $0.5 million of expenses, respectively, incurred by us in connection with our acquisition of CHT.
(2)SOX implementation costs consist of $0.1 million of expenses for the six months ended June 30, 2022 for third-party consultants to assist us with the development, implementation, and documentation of new and enhanced internal controls and processes for compliance with SOX Section 404(b) for fiscal 2021.
(3)Fair value adjustment to contingent consideration consists of $2.8 million of gain for the three and six months ended June 30, 2022, in connection with the remeasurement of the contingent consideration for the acquisition of CHT as of June 30, 2022.
(4)Changes in TRA related liability consist of immaterial expenses for the six months ended June 30, 2023, and immaterial expenses and $0.6 million of income for the three and six months ended June 30, 2022, respectively, due to a change in the estimated future state tax benefits and other changes in the estimate resulting in reductions of the TRA liability.
(5)Changes in Tax Indemnification Receivable consists of immaterial income for the three and six months ended June 30, 2023 and 2022, related to a reduction in the tax indemnification receivable recorded in connection with the Reorganization Transactions. The reduction also resulted in a benefit of the same amount which has been recorded within income tax expense.
(6)Settlement of federal and state tax refunds consist of immaterial expenses incurred by us for the six months ended June 30, 2023, and immaterial expenses and $0.1 million of expense incurred by us for the three and six months ended June 30, 2022, respectively, related to a payment to White Mountains for state tax refunds for the period prior to the Reorganization Transactions related to 2020 tax returns. The settlement also resulted in a benefit of the same amount which has been recorded within income tax expense.
(7)Legal expenses of $1.1 million and $1.4 million for the three and six months ended June 30, 2023, respectively, consist of legal fees incurred in connection with a civil investigative demand received from the Federal Trade Commission (FTC) in February 2023.
(8)Reduction in force costs for the three and six months ended June 30, 2023 consist of $1.2 million of severance benefits provided to the terminated employees in connection with the plan to reduce our workforce implemented in May 2023. Additionally, equity-based compensation expense includes $0.3 million of charges related to the plan for the three and six months ended June 30, 2023.
Forward-Looking Statements
This shareholder letter contains forward-looking statements within the meaning of the Private Securities Litigation Reform Act of 1995, including without limitation statements regarding our expectations regarding Transaction Value growth in our P&C and Health verticals in the third quarter of 2023 and longer term; our expectation of significant top-line growth when a broad-based recovery in P&C carrier marketing investment occurs; our expectation that we will see strong carrier demand and continued growth from Medicare Advantage carriers in the years to come; our expectation that we will remain in compliance with our debt covenants; our belief in our growth prospects once our P&C insurance carrier partners improve their profitability; and our financial outlook for the third quarter of 2023. These forward-looking statements reflect our current views with respect to, among other things, future events and our financial performance. These statements are often, but not always, made through the use of words or phrases such as “may,” “should,” “could,” “predict,” “potential,” “believe,” “will likely result,” “expect,” “continue,” “will,” “anticipate,” “seek,” “estimate,” “intend,” “plan,” “projection,” “would,” and “outlook,” or the negative version of those words or other comparable words or phrases of a future or forward-looking nature. These forward-looking statements are not historical facts, and are based on current expectations, estimates and projections about our industry, management’s beliefs and certain assumptions made by management, many of which, by their nature, are inherently uncertain and beyond our control. Accordingly, we caution you that any such forward-looking statements are not guarantees of future performance and are subject to risks, assumptions and uncertainties that are difficult to predict. Although we believe that the expectations reflected in these forward-looking statements are reasonable as of the date made, actual results may prove to be materially different from the results expressed or implied by the forward-looking statements.
There are or will be important factors that could cause our actual results to differ materially from those indicated in these forward-looking statements, including those more fully described in MediaAlpha’s filings with the Securities and Exchange Commission (“SEC”), including the Form 10-K filed on February 27, 2023. These factors should not be construed as exhaustive. MediaAlpha disclaims any obligation to update any forward-looking statements to reflect events or circumstances that occur after the date of this shareholder letter.
v3.23.2
Cover
|
Jul. 29, 2023 |
| Cover [Abstract] |
|
| Document Type |
8-K
|
| Document Period End Date |
Jul. 29, 2023
|
| Entity Registrant Name |
MediaAlpha, Inc.
|
| Entity Incorporation, State or Country Code |
DE
|
| Entity File Number |
001-39671
|
| Entity Tax Identification Number |
85-1854133
|
| Entity Address, Address Line One |
700 South Flower Street
|
| Entity Address, Address Line Two |
Suite 640
|
| Entity Address, City or Town |
Los Angeles
|
| Entity Address, State or Province |
CA
|
| Entity Address, Postal Zip Code |
90017
|
| City Area Code |
213
|
| Local Phone Number |
316-6256
|
| Written Communications |
false
|
| Soliciting Material |
false
|
| Pre-commencement Tender Offer |
false
|
| Pre-commencement Issuer Tender Offer |
false
|
| Title of 12(b) Security |
Class A common stock, $0.01 par value
|
| Trading Symbol |
MAX
|
| Security Exchange Name |
NYSE
|
| Entity Emerging Growth Company |
false
|
| Entity Central Index Key |
0001818383
|
| Amendment Flag |
false
|
| X |
- DefinitionBoolean flag that is true when the XBRL content amends previously-filed or accepted submission.
| Name: |
dei_AmendmentFlag |
| Namespace Prefix: |
dei_ |
| Data Type: |
xbrli:booleanItemType |
| Balance Type: |
na |
| Period Type: |
duration |
|
| X |
- DefinitionFor the EDGAR submission types of Form 8-K: the date of the report, the date of the earliest event reported; for the EDGAR submission types of Form N-1A: the filing date; for all other submission types: the end of the reporting or transition period. The format of the date is YYYY-MM-DD.
| Name: |
dei_DocumentPeriodEndDate |
| Namespace Prefix: |
dei_ |
| Data Type: |
xbrli:dateItemType |
| Balance Type: |
na |
| Period Type: |
duration |
|
| X |
- DefinitionThe type of document being provided (such as 10-K, 10-Q, 485BPOS, etc). The document type is limited to the same value as the supporting SEC submission type, or the word 'Other'.
| Name: |
dei_DocumentType |
| Namespace Prefix: |
dei_ |
| Data Type: |
dei:submissionTypeItemType |
| Balance Type: |
na |
| Period Type: |
duration |
|
| X |
- DefinitionAddress Line 1 such as Attn, Building Name, Street Name
| Name: |
dei_EntityAddressAddressLine1 |
| Namespace Prefix: |
dei_ |
| Data Type: |
xbrli:normalizedStringItemType |
| Balance Type: |
na |
| Period Type: |
duration |
|
| X |
- DefinitionAddress Line 2 such as Street or Suite number
| Name: |
dei_EntityAddressAddressLine2 |
| Namespace Prefix: |
dei_ |
| Data Type: |
xbrli:normalizedStringItemType |
| Balance Type: |
na |
| Period Type: |
duration |
|
| X |
- Definition
+ References
+ Details
| Name: |
dei_EntityAddressCityOrTown |
| Namespace Prefix: |
dei_ |
| Data Type: |
xbrli:normalizedStringItemType |
| Balance Type: |
na |
| Period Type: |
duration |
|
| X |
- DefinitionCode for the postal or zip code
| Name: |
dei_EntityAddressPostalZipCode |
| Namespace Prefix: |
dei_ |
| Data Type: |
xbrli:normalizedStringItemType |
| Balance Type: |
na |
| Period Type: |
duration |
|
| X |
- DefinitionName of the state or province.
| Name: |
dei_EntityAddressStateOrProvince |
| Namespace Prefix: |
dei_ |
| Data Type: |
dei:stateOrProvinceItemType |
| Balance Type: |
na |
| Period Type: |
duration |
|
| X |
- DefinitionA unique 10-digit SEC-issued value to identify entities that have filed disclosures with the SEC. It is commonly abbreviated as CIK. Reference 1: http://www.xbrl.org/2003/role/presentationRef
-Publisher SEC
-Name Exchange Act
-Number 240
-Section 12
-Subsection b-2
| Name: |
dei_EntityCentralIndexKey |
| Namespace Prefix: |
dei_ |
| Data Type: |
dei:centralIndexKeyItemType |
| Balance Type: |
na |
| Period Type: |
duration |
|
| X |
- DefinitionIndicate if registrant meets the emerging growth company criteria. Reference 1: http://www.xbrl.org/2003/role/presentationRef
-Publisher SEC
-Name Exchange Act
-Number 240
-Section 12
-Subsection b-2
| Name: |
dei_EntityEmergingGrowthCompany |
| Namespace Prefix: |
dei_ |
| Data Type: |
xbrli:booleanItemType |
| Balance Type: |
na |
| Period Type: |
duration |
|
| X |
- DefinitionCommission file number. The field allows up to 17 characters. The prefix may contain 1-3 digits, the sequence number may contain 1-8 digits, the optional suffix may contain 1-4 characters, and the fields are separated with a hyphen.
| Name: |
dei_EntityFileNumber |
| Namespace Prefix: |
dei_ |
| Data Type: |
dei:fileNumberItemType |
| Balance Type: |
na |
| Period Type: |
duration |
|
| X |
- DefinitionTwo-character EDGAR code representing the state or country of incorporation.
| Name: |
dei_EntityIncorporationStateCountryCode |
| Namespace Prefix: |
dei_ |
| Data Type: |
dei:edgarStateCountryItemType |
| Balance Type: |
na |
| Period Type: |
duration |
|
| X |
- DefinitionThe exact name of the entity filing the report as specified in its charter, which is required by forms filed with the SEC. Reference 1: http://www.xbrl.org/2003/role/presentationRef
-Publisher SEC
-Name Exchange Act
-Number 240
-Section 12
-Subsection b-2
| Name: |
dei_EntityRegistrantName |
| Namespace Prefix: |
dei_ |
| Data Type: |
xbrli:normalizedStringItemType |
| Balance Type: |
na |
| Period Type: |
duration |
|
| X |
- DefinitionThe Tax Identification Number (TIN), also known as an Employer Identification Number (EIN), is a unique 9-digit value assigned by the IRS. Reference 1: http://www.xbrl.org/2003/role/presentationRef
-Publisher SEC
-Name Exchange Act
-Number 240
-Section 12
-Subsection b-2
| Name: |
dei_EntityTaxIdentificationNumber |
| Namespace Prefix: |
dei_ |
| Data Type: |
dei:employerIdItemType |
| Balance Type: |
na |
| Period Type: |
duration |
|
| X |
- DefinitionLocal phone number for entity.
| Name: |
dei_LocalPhoneNumber |
| Namespace Prefix: |
dei_ |
| Data Type: |
xbrli:normalizedStringItemType |
| Balance Type: |
na |
| Period Type: |
duration |
|
| X |
- DefinitionBoolean flag that is true when the Form 8-K filing is intended to satisfy the filing obligation of the registrant as pre-commencement communications pursuant to Rule 13e-4(c) under the Exchange Act. Reference 1: http://www.xbrl.org/2003/role/presentationRef
-Publisher SEC
-Name Exchange Act
-Number 240
-Section 13e
-Subsection 4c
| Name: |
dei_PreCommencementIssuerTenderOffer |
| Namespace Prefix: |
dei_ |
| Data Type: |
xbrli:booleanItemType |
| Balance Type: |
na |
| Period Type: |
duration |
|
| X |
- DefinitionBoolean flag that is true when the Form 8-K filing is intended to satisfy the filing obligation of the registrant as pre-commencement communications pursuant to Rule 14d-2(b) under the Exchange Act. Reference 1: http://www.xbrl.org/2003/role/presentationRef
-Publisher SEC
-Name Exchange Act
-Number 240
-Section 14d
-Subsection 2b
| Name: |
dei_PreCommencementTenderOffer |
| Namespace Prefix: |
dei_ |
| Data Type: |
xbrli:booleanItemType |
| Balance Type: |
na |
| Period Type: |
duration |
|
| X |
- DefinitionTitle of a 12(b) registered security. Reference 1: http://www.xbrl.org/2003/role/presentationRef
-Publisher SEC
-Name Exchange Act
-Number 240
-Section 12
-Subsection b
| Name: |
dei_Security12bTitle |
| Namespace Prefix: |
dei_ |
| Data Type: |
dei:securityTitleItemType |
| Balance Type: |
na |
| Period Type: |
duration |
|
| X |
- DefinitionName of the Exchange on which a security is registered. Reference 1: http://www.xbrl.org/2003/role/presentationRef
-Publisher SEC
-Name Exchange Act
-Number 240
-Section 12
-Subsection d1-1
| Name: |
dei_SecurityExchangeName |
| Namespace Prefix: |
dei_ |
| Data Type: |
dei:edgarExchangeCodeItemType |
| Balance Type: |
na |
| Period Type: |
duration |
|
| X |
- DefinitionBoolean flag that is true when the Form 8-K filing is intended to satisfy the filing obligation of the registrant as soliciting material pursuant to Rule 14a-12 under the Exchange Act. Reference 1: http://www.xbrl.org/2003/role/presentationRef
-Publisher SEC
-Name Exchange Act
-Section 14a
-Number 240
-Subsection 12
| Name: |
dei_SolicitingMaterial |
| Namespace Prefix: |
dei_ |
| Data Type: |
xbrli:booleanItemType |
| Balance Type: |
na |
| Period Type: |
duration |
|
| X |
- DefinitionTrading symbol of an instrument as listed on an exchange.
| Name: |
dei_TradingSymbol |
| Namespace Prefix: |
dei_ |
| Data Type: |
dei:tradingSymbolItemType |
| Balance Type: |
na |
| Period Type: |
duration |
|
| X |
- DefinitionBoolean flag that is true when the Form 8-K filing is intended to satisfy the filing obligation of the registrant as written communications pursuant to Rule 425 under the Securities Act. Reference 1: http://www.xbrl.org/2003/role/presentationRef
-Publisher SEC
-Name Securities Act
-Number 230
-Section 425
| Name: |
dei_WrittenCommunications |
| Namespace Prefix: |
dei_ |
| Data Type: |
xbrli:booleanItemType |
| Balance Type: |
na |
| Period Type: |
duration |
|
MediaAlpha (NYSE:MAX)
Historical Stock Chart
Von Apr 2024 bis Mai 2024

MediaAlpha (NYSE:MAX)
Historical Stock Chart
Von Mai 2023 bis Mai 2024
