Filed by Global Net Lease, Inc.
Pursuant to Rule 425 Under
the Securities Act of 1933
And Deemed Filed Pursuant to Rule 14a-12
Under the Securities Exchange
Act of 1934
Subject Company: The Necessity Retail
REIT, Inc.
Subject Company Commissions File No.:
001-38597
INTERNALIZATION OF MANAGEMENT & ENHANCED CORPORATE GOVERNANCE KEY BENEFITS OF THE MERGER OF GLOBAL NET LEASE AND THE NECESSITY RETAIL REIT AUGUST 2023
FORWARD LOOKING STATEMENTS The statements in this presentation that are not historical facts may be forward - looking statements . These forward - looking statements involve risks and uncertainties that could cause actual results or events to be materially different . In addition, words such as “may,” “will,” “seeks,” “anticipates,” “believes,” “estimates,” "expects,” “plans,” “intends,” “would,” or similar expressions indicate a forward - looking statement, although not all forward - looking statements contain these identifying words . Any statements referring to the future value of an investment in Global Net Lease, Inc . (“GNL”), including the adjustments giving effect to The Necessity Retail REIT, Inc . (“RTL”) merging with and into Osmosis Sub I, LLC, with Osmosis Sub I, LLC continuing as the surviving entity and wholly - owned subsidiary of GNL (the “REIT Merger”) and GNL and RTL becoming internally managed (the “Internalization Merger” and, together with the REIT Merger, the “Proposed Transactions”) as described in this Supplement, as well as the potential success that GNL may have in executing the REIT Merger and Internalization Merger, are also forward - looking statements . There are a number of risks, uncertainties and other important factors that could cause GNL’s actual results, or GNL’s actual results after making adjustments to give effect to the REIT Merger and the Internalization Merger, to differ materially from those contemplated by such forward - looking statements, including but not limited to : ( i ) GNL’s ability to complete the proposed REIT Merger and Internalization Merger on the proposed terms or on the anticipated timeline, or at all, including risks and uncertainties related to securing the necessary stockholder approvals and satisfaction of other closing conditions to consummate the proposed transaction, (ii) the occurrence of any event, change or other circumstance that could give rise to the termination of the Internalization Merger Agreement and REIT Merger Agreement, each dated as of May 23 , 2023 relating to the Proposed Transactions, (iii) the ability of GNL to obtain lender consent to amend its Second Amended and Restated Credit Facility or any other loan agreement of GNL, if at all, or on terms favorable to GNL, (iv) risks related to the potential repeal of GNL’s Shareholder’s Rights Plan ; (v) risks related to the decrease in the beneficial ownership requirements of GNL’s applicable classes and series of stock ; (vi) risks related to diverting the attention of GNL’s management from ongoing business operations, (vii) failure to realize the expected benefits of the Proposed Transactions, (viii) significant transaction costs or unknown or inestimable liabilities, (ix) the risk of shareholder litigation in connection with the proposed transaction, including resulting expense or delay, (x) the risk that RTL’s business will not be integrated successfully or that such integration may be more difficult, time - consuming or costly than expected, (xi) risks related to future opportunities and plans for GNL post - closing, including the uncertainty of expected future financial performance and results of GNL post - closing following completion of the Proposed Transactions, (xii) the effect of the announcement of the proposed transaction on the ability of GNL and RTL to operate their respective businesses and retain and hire key personnel and to maintain favorable business relationships, (xiii) the effect of any downgrade of GNL’s or RTL’s corporate rating or to any of their respective debt or equity securities including the outstanding notes under the RTL Indenture ; (xiv) risks related to the market value of the GNL Common Stock to be issued in the Proposed Transactions ; (xv) other risks related to the completion of the Proposed Transactions, (xvi) potential adverse effects of the ongoing global COVID - 19 pandemic, including actions taken to contain or treat COVID - 19 , on RTL, RTL's tenants and the global economy and financial market, (xvii) the risk that one or more parties to the Internalization Merger Agreement and REIT Merger Agreement may not fulfil its obligations under the respective agreement, as well as the additional risks, uncertainties and other important factors set forth in the “Risk Factors” and “Management’s Discussion and Analysis of Financial Condition and Results of Operations” sections of GNL’s Annual Report on Form 10 - K for the year ended December 31 , 2022 filed with the SEC on February 23 , 2023 , and all other filings with the SEC after that date, as such risks, uncertainties and other important factors may be updated from time to time in GNL’s subsequent reports . Further, forward - looking statements speak only as of the date they are made, and the Company undertakes no obligation to update or revise forward - looking statements to reflect changed assumptions, the occurrence of unanticipated events or changes to future operating results over time, except as required by law . This presentation contains certain statements that are the Company’s and Management’s hopes, intentions, beliefs, expectations, or projections of the future and might be considered to be forward - looking statements under Federal Securities laws . Prospective investors are cautioned that any such forward - looking statements are not guarantees of future performance, and involve risks and uncertainties . The Company’s actual future results may differ significantly from the matters discussed in these forward - looking statements, and we may not release revisions to these forward - looking statements to reflect changes after we’ve made the statements . If the Company updates one or more forward - looking statements, no inference should be drawn that the Company will make additional updates with respect to those or other forward - looking statements . 2
PROJECTIONS This presentation also includes estimated projections of future operating results . These projections are not prepared in accordance with published guidelines of the SEC or the guidelines established by the American Institute of Certified Public Accountants for preparation and presentation of financial projections . This information is not fact and should not be relied upon as being necessarily indicative of future results ; the projections were prepared in good faith by management and are based on numerous assumptions that may prove to be wrong . All such statements, including but not limited to estimates of value accretion, synergies, run - rate figures and results of future operations after making adjustments to give effect to the Proposed Transactions reflect assumptions as to certain business decisions and events that are subject to change . As a result, actual results may differ materially from those contained in the estimates . Accordingly, there can be no assurance that the estimates will be realized, or that the transactions described in this presentation, including but not limited to the Proposed Transactions, will be realized at all . Important factors that may affect actual results and cause the projections to not be achieved include, but are not limited to, risks and uncertainties relating to the Company and other factors described in the “Risk Factors” and “Management’s Discussion and Analysis of Financial Condition and Results of Operations” sections of the Company’s Annual Report on Form 10 - K for the year ended December 31 , 2022 filed with the SEC on February 23 , 2023 , and all other filings with the SEC after that date, as such risks, uncertainties and other important factors may be updated from time to time in the Company’s subsequent reports . This presentation also contains estimates and information concerning our industry and tenants, including market position, market size and growth rates of the markets in which we operate, that are based on industry publications and other third - party reports . This information involves a number of assumptions and limitations, and you are cautioned not to give undue weight to these estimates . We have not independently verified the accuracy or completeness of the data contained in these publications and reports . The industry in which we operate is subject to a high degree of uncertainty and risk due to a variety of factors, including those described in the “Risk Factors” and “Management’s Discussion and Analysis of Financial Condition and Results of Operations” sections of the Company’s Annual Report on Form 10 - K for the year ended December 31 , 2022 filed with the SEC on February 23 , 2023 , and all other filings with the SEC after that date, as such risks, uncertainties and other important factors may be updated from time to time in the Company’s subsequent reports . Credit Ratings A securities rating is not a recommendation to buy, sell or hold securities and may be subject to revision or withdrawal at any time . Each rating agency has its own methodology of assigning ratings and, accordingly, each rating should be evaluated independently of any other rating . 3
ADDITIONAL INFORMATION AND WHERE TO FIND IT Additional Information About the REIT Merger and Internalization Merger and Where to Find It In connection with the Proposed Transactions, on July 6 , 2023 , GNL filed with the SEC a registration statement on Form S - 4 (as amended on July 17 , 2023 ), which includes a document that serves as a prospectus of GNL and a joint proxy statement of GNL and RTL (the “Joint Proxy Statement/Prospectus”) . Each party also plans to file other relevant documents with the SEC regarding the Proposed Transactions . The Form S - 4 became effective on July 18 , 2023 . INVESTORS AND SECURITY HOLDERS ARE URGED TO READ THE JOINT PROXY STATEMENT/PROSPECTUS AND OTHER RELEVANT DOCUMENTS FILED WITH THE SEC BECAUSE THEY CONTAIN IMPORTANT INFORMATION ABOUT THE PROPOSED TRANSACTIONS . GNL and RTL commenced mailing the definitive Joint Proxy Statement/Prospectus to stockholders on or about July 19 , 2023 . Investors and securityholders may obtain a free copy of the Joint Proxy Statement/Prospectus and other relevant documents filed by GNL and RTL with the SEC at the SEC’s website at www . sec . gov . Copies of the documents filed by GNL with the SEC are available free of charge on GNL’s website at www . globalnetlease . com or by contacting GNL’s Investor Relations at investorrelations@globalnetlease . com . Copies of the documents filed by RTL with the SEC are available free of charge on RTL’s website at www . necessityretailreit . com or by contacting RTL’s Investor Relations at ir@rtlreit . com . Participants in the Proxy Solicitation GNL, RTL, and their respective directors, executive officers and other members of management and employees of their respective advisors and their affiliates may be deemed to be participants in the solicitation of proxies in respect of the proposed transactions . Information about directors and executive officers of GNL is available in the GNL proxy statement for its 2023 Annual Meeting, as incorporated by reference in the Joint Proxy Statement/Prospectus . Information about directors and executive officers of RTL is available in the RTL proxy statement for its 2023 Annual Meeting, as incorporated by reference in the Joint Proxy Statement/Prospectus . Other information regarding the participants in the proxy solicitation and a description of their direct and indirect interests, by security holdings or otherwise, will be contained in the joint proxy statement/prospectus and other relevant materials filed with the SEC regarding the proposed transactions when they become available . Investors should read the joint proxy statement/prospectus carefully when it becomes available before making any voting or investment decisions . Investors may obtain free copies of these documents from GNL and RTL as indicated above . 4
TABLE OF CONTENTS I Executive Summary 6 II Benefits of Merger and Internalization 9 III Addressing Shareholder Concerns 21 IV Conclusion: Key Takeaways 25 V Appendix 27 5
EXECUTIVE SUMMARY 6 I
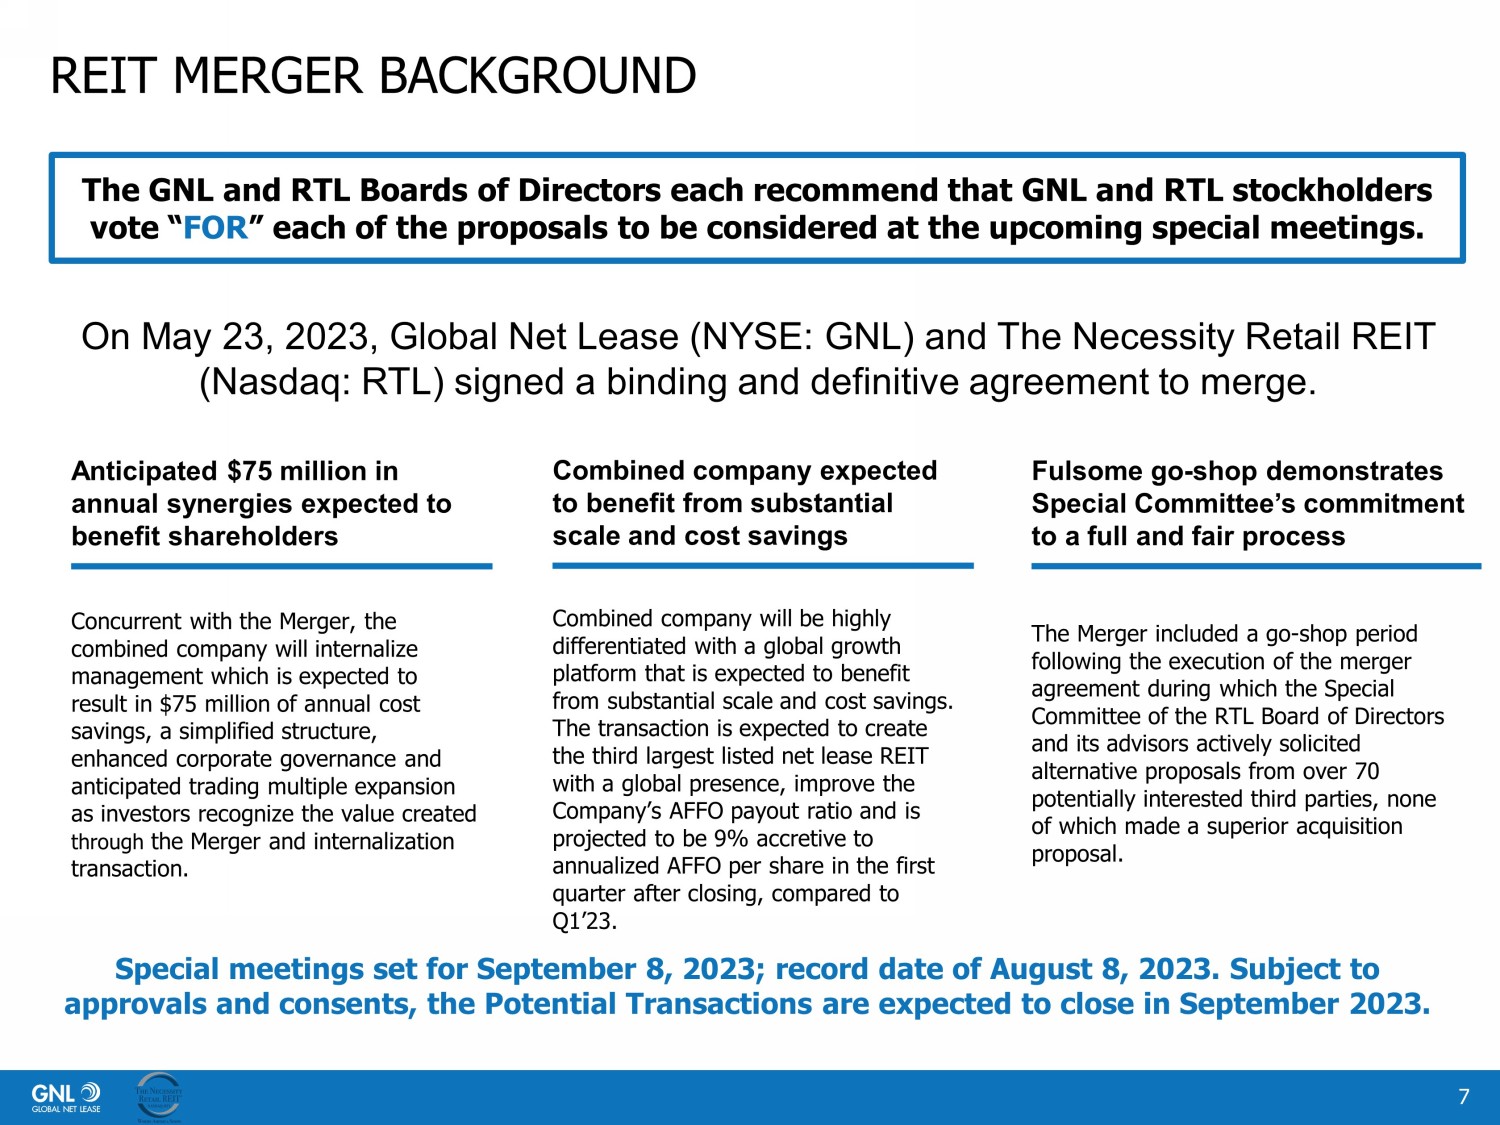
REIT MERGER BACKGROUND On May 23, 2023, Global Net Lease (NYSE: GNL) and The Necessity Retail REIT (Nasdaq: RTL) signed a binding and definitive agreement to merge. The Merger included a go - shop period following the execution of the merger agreement during which the Special Committee of the RTL Board of Directors and its advisors actively solicited alternative proposals from over 70 potentially interested third parties, none of which made a superior acquisition proposal. Fulsome go - shop demonstrates Special Committee’s commitment to a full and fair process Concurrent with the Merger, the combined company will internalize management which is expected to result in $75 million of annual cost savings, a simplified structure, enhanced corporate governance and anticipated trading multiple expansion as investors recognize the value created through the Merger and internalization transaction. Combined company will be highly differentiated with a global growth platform that is expected to benefit from substantial scale and cost savings. The transaction is expected to create the third largest listed net lease REIT with a global presence, improve the Company’s AFFO payout ratio and is projected to be 9% accretive to annualized AFFO per share in the first quarter after closing, compared to Q1’23. Anticipated $75 million in annual synergies expected to benefit shareholders Combined company expected to benefit from substantial scale and cost savings Special meetings set for September 8, 2023; record date of August 8, 2023. Subject to approvals and consents, the Potential Transactions are expected to close in September 2023. 7 The GNL and RTL Boards of Directors each recommend that GNL and RTL stockholders vote “ FOR ” each of the proposals to be considered at the upcoming special meetings.
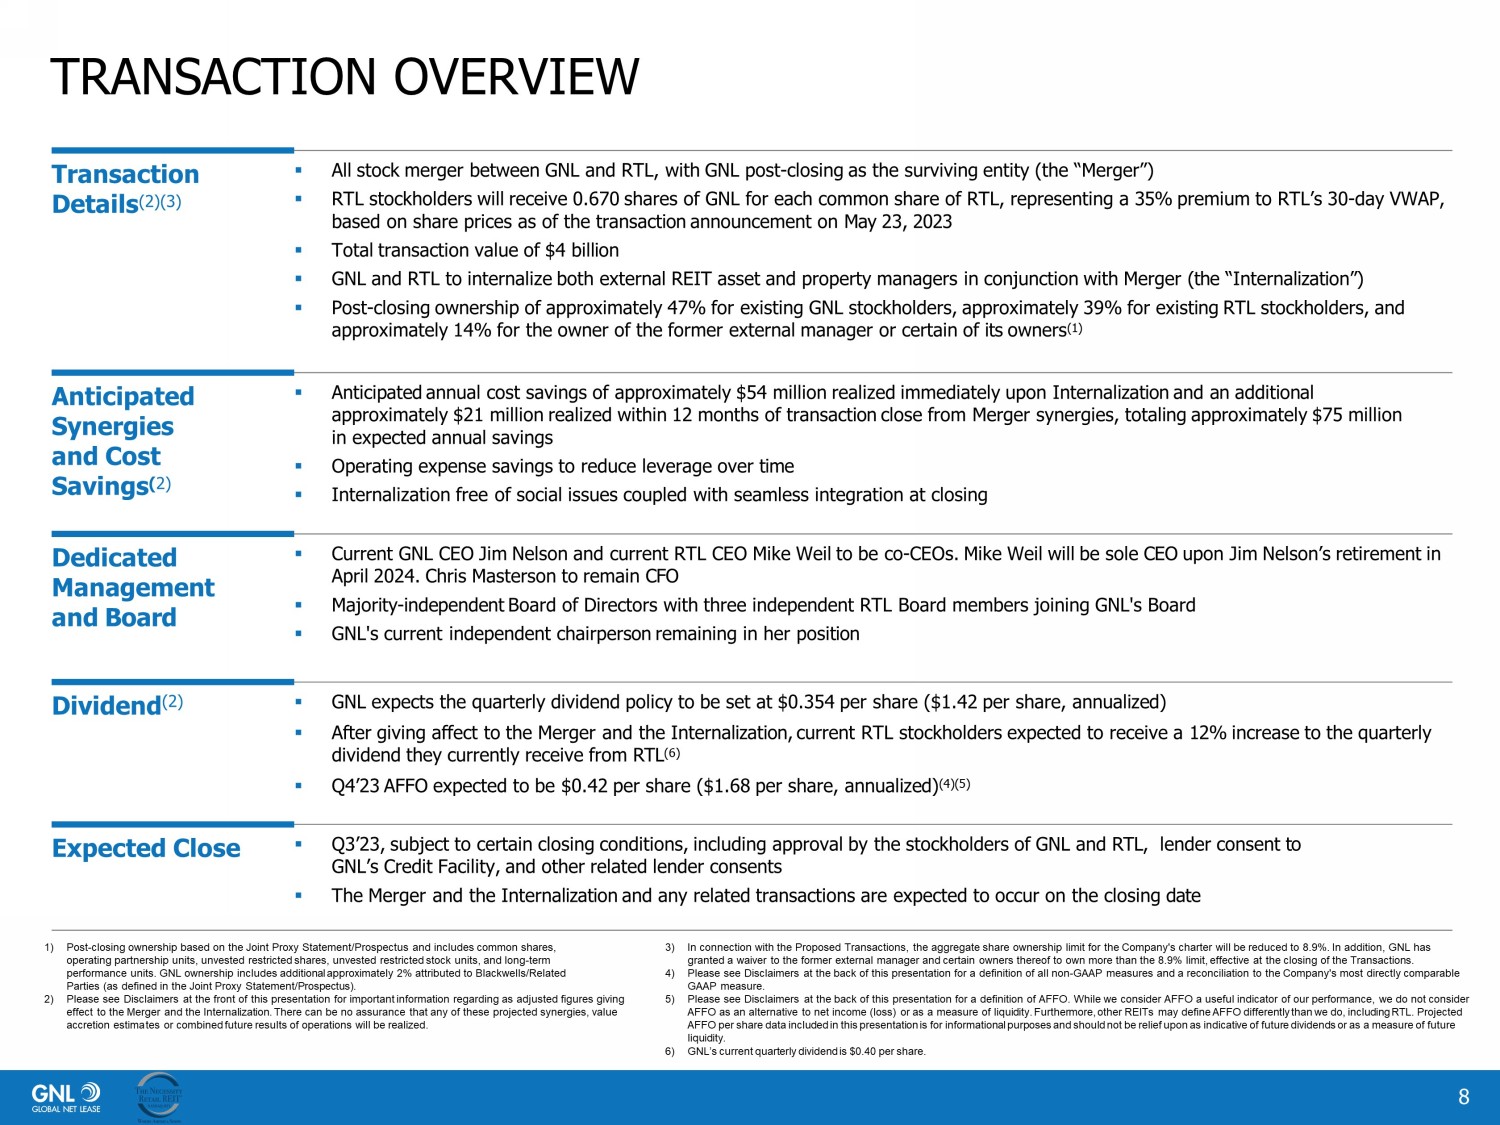
TRANSACTION OVERVIEW 8 1) Post - closing ownership based on the Joint Proxy Statement/Prospectus and includes common shares, operating partnership units, unvested restricted shares, unvested restricted stock units, and long - term performance units. GNL ownership includes additional approximately 2% attributed to Blackwells/Related Parties (as defined in the Joint Proxy Statement/Prospectus). 2) Please see Disclaimers at the front of this presentation for important information regarding as adjusted figures giving effect to the Merger and the Internalization. There can be no assurance that any of these projected synergies, value accretion estima tes or combine d future results of operations will be realized. Transaction Details (2)(3) ▪ All stock merger between GNL and RTL, with GNL p ost - closing as the surviving entity (the “Merger”) ▪ RTL stockholders will receive 0.670 shares of GNL for each common share of RTL, representing a 35% premium to RTL’s 30 - day VWAP, based on share prices as of the transaction announcement on May 23, 2023 ▪ Total transaction value of $4 billion ▪ GNL and RTL to internalize both external REIT asset and property managers in conjunction with Merger (the “Internalization”) ▪ Post - closing ownership of approximately 47% for existing GNL stockholders, approximately 39% for existing RTL stockholders, and approximately 14% for the owner of the former external manager or certain of its owners (1) Anticipated Synergies and Cost Savings ( 2) ▪ Anticipated annual cost savings of approximately $54 million realized immediately upon I nternalization and an additional approximately $21 million realized within 12 months of transaction close from Merger synergies, totaling approximately $75 million in expected annual savings ▪ Operating expense savings to reduce leverage over time ▪ Internalization free of social issues coupled with seamless integration at closing Dedicated Management and Board ▪ Current GNL CEO Jim Nelson and current RTL CEO Mike Weil to be co - CEOs. Mike Weil will be sole CEO upon Jim Nelson’s retirement in April 2024. Chris Masterson to remain CFO ▪ Majority - independent Board of Directors with three independent RTL Board members joining GNL's Board ▪ GNL's current independent chairperson remaining in her position Dividend (2) ▪ GNL expects the quarterly dividend policy to be set at $0.354 per share ($1.42 per share, annualized) ▪ After giving affect to the Merger and the Internalization, current RTL stockholders expected to receive a 12% increase to the quarterly dividend they currently receive from RTL (6) ▪ Q4’23 AFFO expected to be $0.42 per share ($1.68 per share, annualized) (4)(5) Expected Close ▪ Q3’23, subject to certain closing conditions, including approval by the stockholders of GNL and RTL, lender consent to GNL’s Credit Facility, and other related lender consents ▪ The Merger and the Internalization and any related transactions are expected to occur on the closing date 3) In connection with the Proposed Transactions, the aggregate share ownership limit for the Company's charter will be reduced to 8.9%. In addition, GNL has granted a waiver to the former external manager and certain owners thereof to own more than the 8.9% limit , effective at the closing of the Transactions. 4) Please see Disclaimers at the back of this presentation for a definition of all non - GAAP measures and a reconciliation to the Company's most directly comparable GAAP measure. 5) Please see Disclaimers at the back of this presentation for a definition of AFFO. While we consider AFFO a useful indicator of our performance, we do not consider AFFO as an alternative to net income (loss) or as a measure of liquidity. Furthermore, other REITs may define AFFO differently than we do, including RTL. Projected AFFO per share data included in this presentation is for informational purposes and should not be relief upon as indicative o f f uture dividends or as a measure of future liquidity. 6) GNL’s current quarterly dividend is $0.40 per share.
BENEFITS OF MERGER AND INTERNALIZATION 9 II
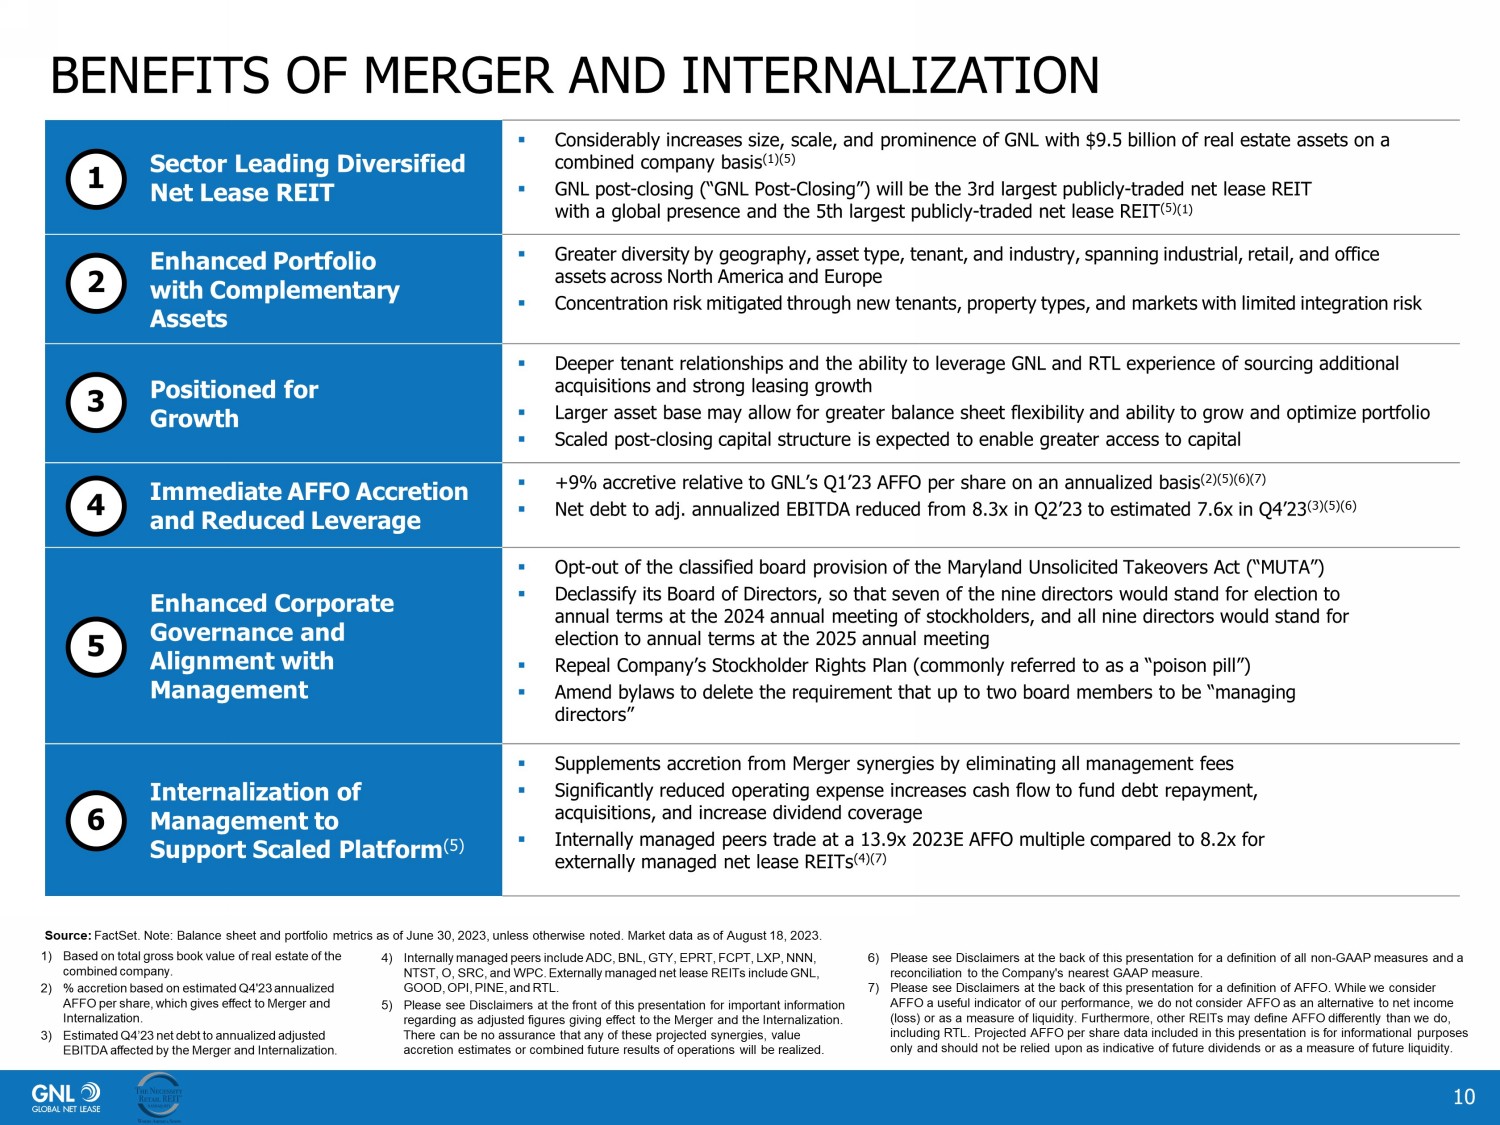
BENEFITS OF MERGER AND INTERNALIZATION 1) Based on total gross book value of real estate of the combined company. 2) % accretion based on estimated Q4'23 annualized AFFO per share, which gives effect to Merger and Internalization. 3) Estimated Q4’23 net debt to annualized adjusted EBITDA affected by the Merger and Internalization. Sector Leading Diversified Net Lease REIT ▪ Considerably increases size, scale, and prominence of GNL with $9.5 billion of real estate assets on a combined company basis (1)(5) ▪ GNL post - closing (“GNL Post - Closing”) will be the 3rd largest publicly - traded net lease REIT with a global presence and the 5th largest publicly - traded net lease REIT (5) (1) Enhanced Portfolio with Complementary Assets ▪ Greater diversity by geography, asset type, tenant, and industry, spanning industrial, retail, and office assets across North America and Europe ▪ Concentration risk mitigated through new tenants, property types, and markets with limited integration risk Positioned for Growth ▪ Deeper tenant relationships and the ability to leverage GNL and RTL experience of sourcing additional acquisitions and strong leasing growth ▪ Larger asset base may allow for greater balance sheet flexibility and ability to grow and optimize portfolio ▪ Scaled post - closing capital structure is expected to enable greater access to capital Immediate AFFO Accretion and Reduced Leverage ▪ +9% accretive relative to GNL’s Q1’23 AFFO per share on an annualized basis (2)(5)(6)(7) ▪ Net debt to adj. annualized EBITDA reduced from 8.3x in Q2’23 to estimated 7.6x in Q4’23 (3)(5)(6) Enhanced Corporate Governance and Alignment with Management ▪ Opt - out of the classified board provision of the Maryland Unsolicited Takeovers Act (“MUTA”) ▪ Declassify its Board of Directors, so that seven of the nine directors would stand for election to annual terms at the 2024 annual meeting of stockholders, and all nine directors would stand for election to annual terms at the 2025 annual meeting ▪ Repeal Company’s Stockholder Rights Plan (commonly referred to as a “poison pill”) ▪ Amend bylaws to delete the requirement that up to two board members to be “managing directors” Internalization of Management to Support Scaled Platform (5) ▪ Supplements accretion from Merger synergies by eliminating all management fees ▪ Significantly reduced operating expense increases cash flow to fund debt repayment, acquisitions, and increase dividend coverage ▪ Internally managed peers trade at a 13.9x 2023E AFFO multiple compared to 8.2x for externally managed net lease REITs (4)(7) 10 6) Please see Disclaimers at the back of this presentation for a definition of all non - GAAP measures and a reconciliation to the Company's nearest GAAP measure. 7) Please see Disclaimers at the back of this presentation for a definition of AFFO. While we consider AFFO a useful indicator of our performance, we do not consider AFFO as an alternative to net income (loss) or as a measure of liquidity. Furthermore, other REITs may define AFFO differently than we do, including RTL. Projected AFFO per share data included in this presentation is for informational purposes only and should not be relied upon as indicative of future dividends or as a measure of future liquidity. Source: FactSet. Note: Balance sheet and portfolio metrics as of June 30, 2023, unless otherwise noted. Market data as of August 18, 2023. 4) Internally managed peers include ADC, BNL, GTY, EPRT, FCPT, LXP, NNN, NTST, O, SRC, and WPC. Externally managed net lease REITs include GNL, GOOD, OPI, PINE, and RTL. 5) Please see Disclaimers at the front of this presentation for important information regarding as adjusted figures giving effect to the Merger and the Internalization. There can be no assurance that any of these projected synergies, value accretion estimates or combined future results of operations will be realized. 1 2 3 4 6 5
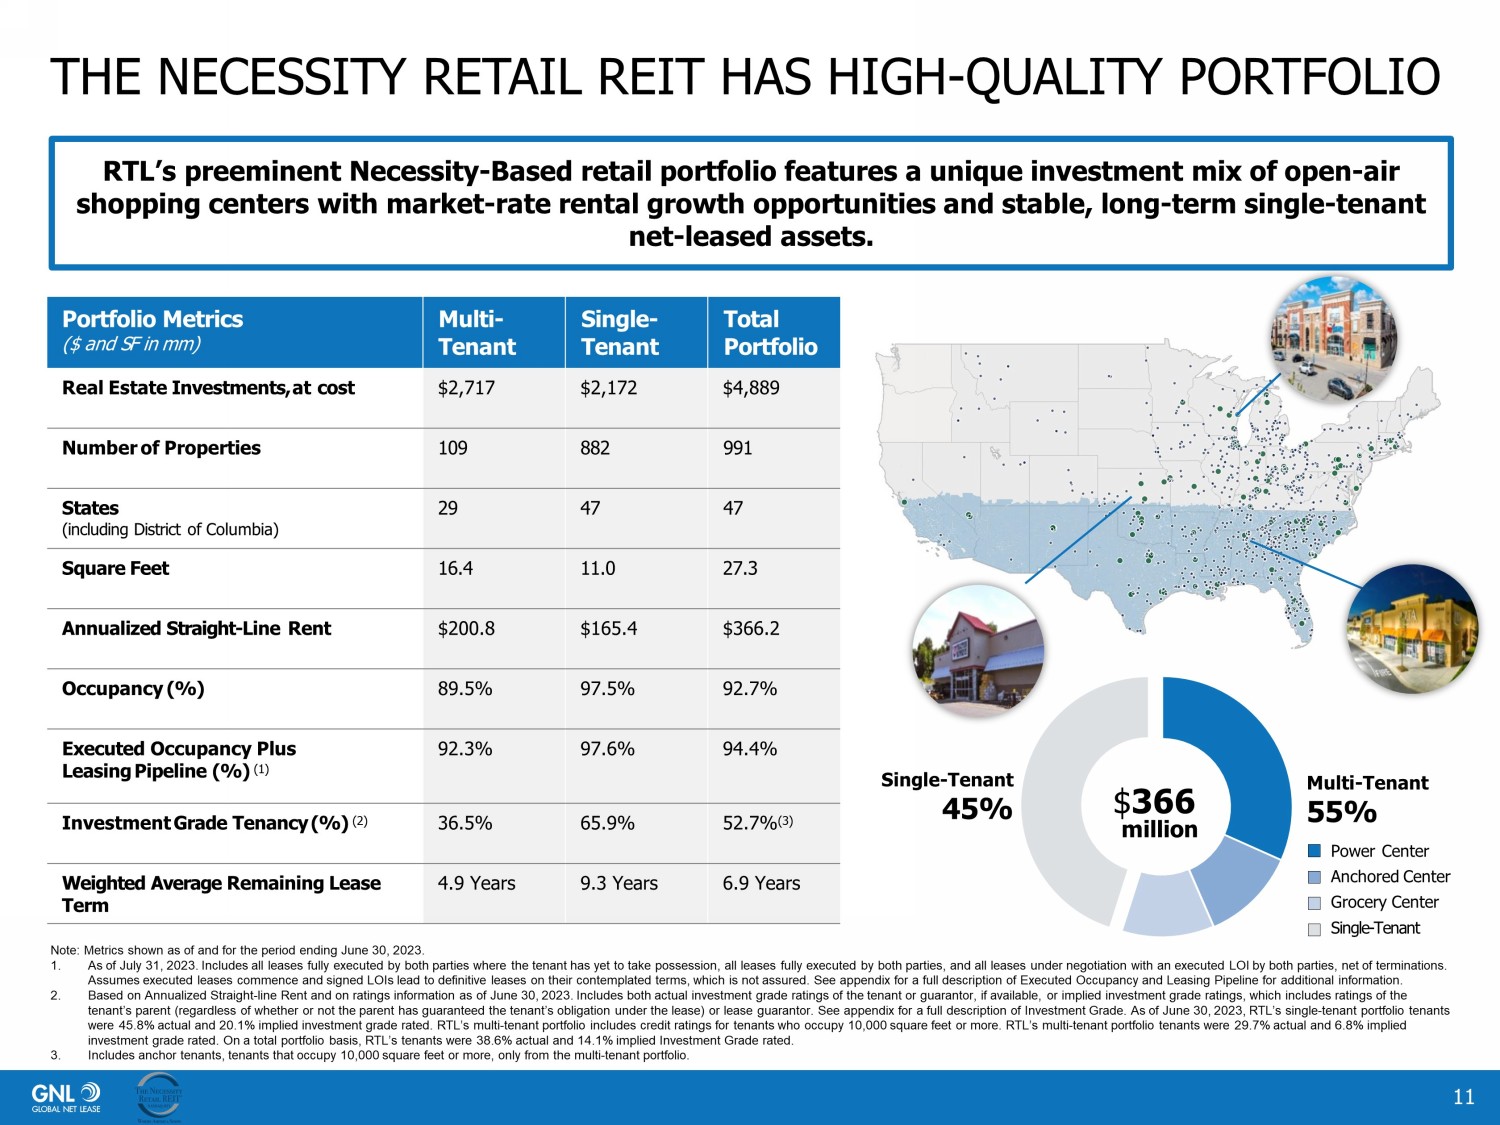
THE NECESSITY RETAIL REIT HAS HIGH - QUALITY PORTFOLIO 11 RTL’s preeminent Necessity - Based retail portfolio features a unique investment mix of open - air shopping centers with market - rate rental growth opportunities and stable, long - term single - tenant net - leased assets. Portfolio Metrics ($ and SF in mm) Multi - Tenant Single - Tenant Total Portfolio Real Estate Investments, at cost $2,717 $2,172 $4,889 Number of Properties 109 882 991 States (including District of Columbia) 29 47 47 Square Feet 16.4 11.0 27.3 Annualized Straight - Line Rent $200.8 $165.4 $366.2 Occupancy (%) 89.5% 97.5% 92.7% Executed Occupancy Plus Leasing Pipeline (%) (1) 92.3% 97.6% 94.4% Investment Grade Tenancy (%) (2) 36.5% 65.9% 52.7% (3) Weighted Average Remaining Lease Term 4.9 Years 9.3 Years 6.9 Years Note: Metrics shown as of and for the period ending June 30, 2023. 1. As of July 31, 2023. Includes all leases fully executed by both parties where the tenant has yet to take possession, all leas es fully executed by both parties, and all leases under negotiation with an executed LOI by both parties, net of terminations. Assumes executed leases commence and signed LOIs lead to definitive leases on their contemplated terms, which is not assured. Se e appendix for a full description of Executed Occupancy and Leasing Pipeline for additional information. 2. Based on Annualized Straight - line Rent and on ratings information as of June 30, 2023. Includes both actual investment grade rat ings of the tenant or guarantor, if available, or implied investment grade ratings, which includes ratings of the tenant’s parent (regardless of whether or not the parent has guaranteed the tenant’s obligation under the lease) or lease gua ran tor. See appendix for a full description of Investment Grade. As of June 30, 2023, RTL’s single - tenant portfolio tenants were 45.8% actual and 20.1% implied investment grade rated. RTL’s multi - tenant portfolio includes credit ratings for tenants who occupy 10,000 square feet or more. RTL’s multi - tenant portfolio tenants were 29.7% actual and 6.8% implied investment grade rated. On a total portfolio basis, RTL’s tenants were 38.6% actual and 14.1% implied Investment Grade rated. 3. Includes anchor tenants, tenants that occupy 10,000 square feet or more, only from the multi - tenant portfolio. Power Center Anchored Center Grocery Center Single - Tenant Single - Tenant 45% $ 366 Multi - Tenant 55% million
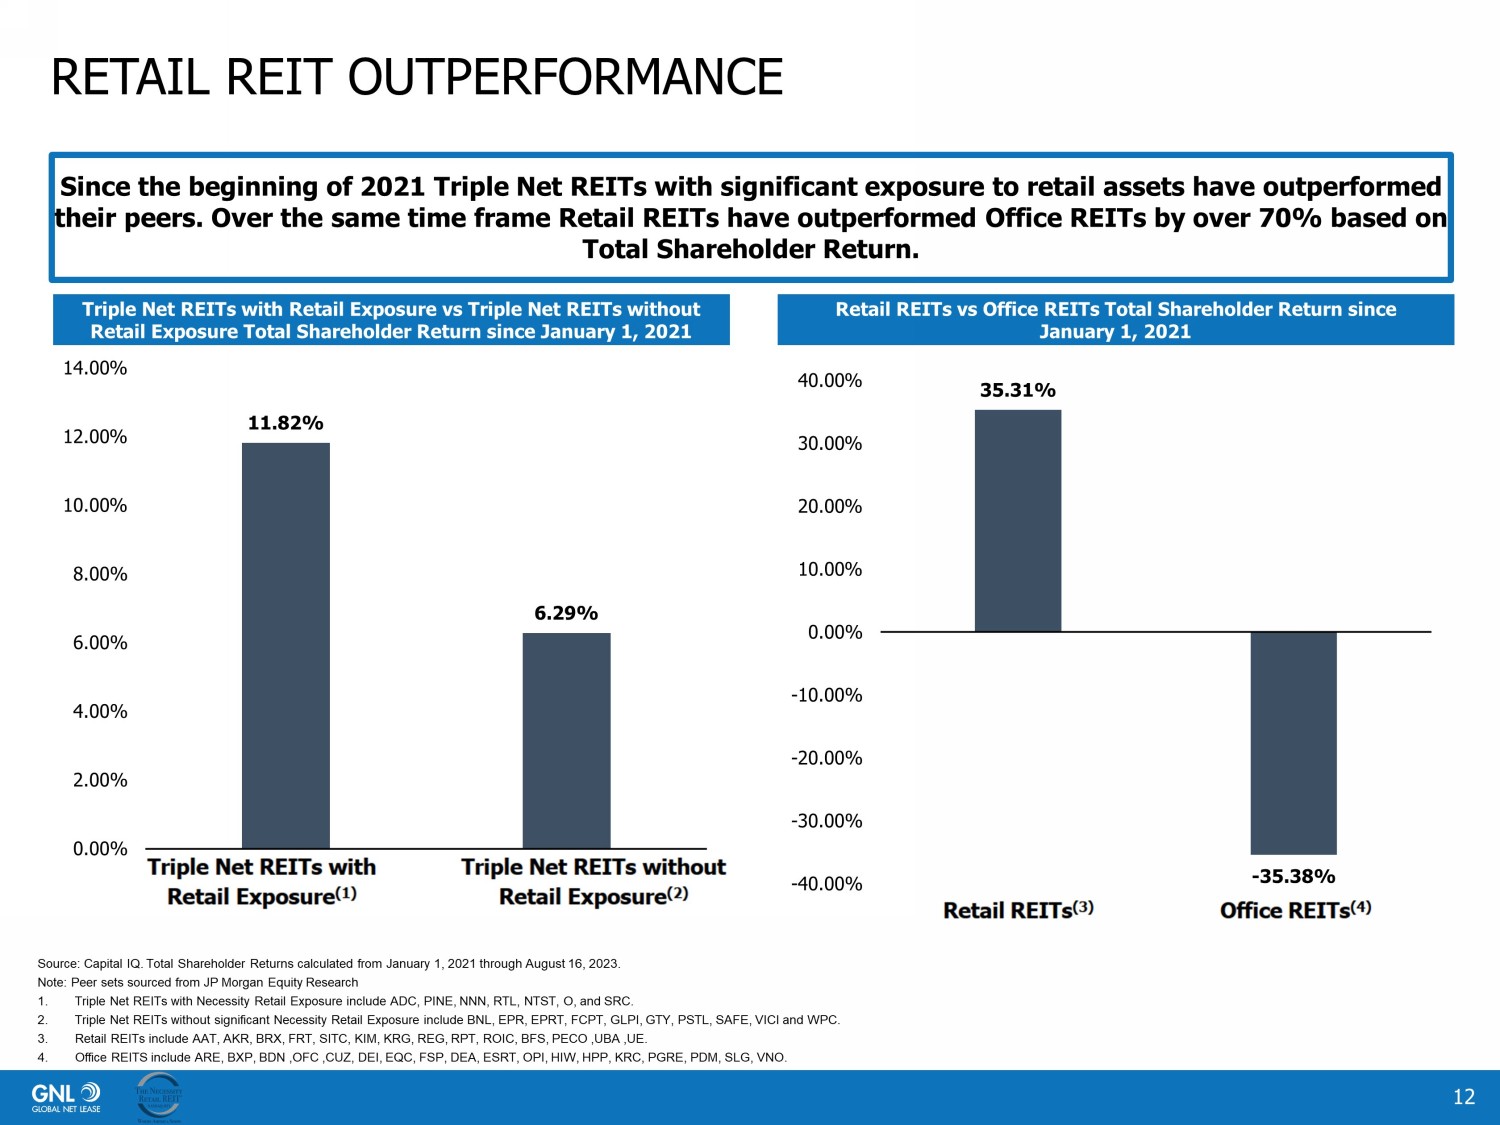
RETAIL REIT OUTPERFORMANCE 12 Since the beginning of 2021 Triple Net REITs with significant exposure to retail assets have outperformed their peers. Over the same time frame Retail REITs have outperformed Office REITs by over 70% based on Total Shareholder Return. Triple Net REITs with Retail Exposure vs Triple Net REITs without Retail Exposure Total Shareholder Return since January 1, 2021 Retail REITs vs Office REITs Total Shareholder Return since January 1, 2021 35.31% - 35.38% -40.00% -30.00% -20.00% -10.00% 0.00% 10.00% 20.00% 30.00% 40.00% Retail REITs Office REITs 11.82% 6.29% 0.00% 2.00% 4.00% 6.00% 8.00% 10.00% 12.00% 14.00% Triple Net REIT with Retail Exposure Triple Net REIT without Retail Exposure Source: Capital IQ. Total Shareholder Returns calculated from January 1, 2021 through August 16, 2023. Note: Peer sets sourced from JP Morgan Equity Research 1. Triple Net REITs with Necessity Retail Exposure include ADC, PINE, NNN, RTL, NTST, O, and SRC. 2. Triple Net REITs without significant Necessity Retail Exposure include BNL, EPR, EPRT, FCPT, GLPI, GTY, PSTL, SAFE, VICI and WPC . 3. Retail REITs include AAT, AKR, BRX, FRT, SITC, KIM, KRG, REG, RPT, ROIC, BFS, PECO ,UBA ,UE. 4. Office REITS include ARE, BXP, BDN ,OFC ,CUZ, DEI, EQC, FSP, DEA, ESRT, OPI, HIW, HPP, KRC, PGRE, PDM, SLG, VNO.

KEY METRICS MADE EVEN STRONGER THROUGH COMBINATION 13 + Gross Book Value of Real Estate ($ millions) $4,6 18 $ 4 , 893 $9, 511 Net Debt / Annualized Adj. EBITDA (2) 8.3x 9. 9 x 7.6x (3) Number of Properties 317 991 1,3 08 Square Feet (millions) 39.6 27. 3 6 6 . 9 Total Straight - Line Rent ($ millions) (4) $36 3 $ 366 $ 729 % Leased 98% 93% 96% Weighted Average Remaining Lease Term (5) 7.6 years 5.9 Years (6) 6 . 9 Years % of Leases with Rent Escalators 95% 65% 80% % Retail / Industrial / Office (7) 5% / 55% / 40% 91% / 8% / 1% 4 8 % / 31% / 20% Top 10 Tenant Concentration (7) 32% 30 % 20 % Top 10 Industry Concentration (7) 60% 5 9 % 43% % Investment Grade Tenants (7)(8) 60% 53 % 5 7 % “GNL Post - Closing” (1) 1. Please see Disclaimers at the front of this presentation for important information regarding as adjusted figures giving effect to the Merger and the Internalization. There can be no assurance that any of these projected synergies, value accretion estimates or combined future results of operations will be realized. 2. Please see Disclaimers at back of this presentation for a definition of all non - GAAP measures and a reconciliation to the Company's most directly comparable GAAP measure. 3. Standalone GNL and RTL represent Q1’23 net debt to annualized adjusted EBITDA. GNL Post - closing represents estimated Q4’24 net debt to annualized adjusted EBITDA with affect for the Merger and Internalization. 4. For Q 2 ’23, calculated as of June 30 , 2023, using annualized straight - line rent (“SLR”) converted from local currency into USD as June 30 , 2023 for the in - place lease on the property on a straight - line basis, includes ten ant concessions such as free rent, as applicable. 5. For Q 2 ’23, calculated as of June 30 , 2023, using square feet. 6. Historical Weighted Average Remaining Lease Term restated based on square footage rather than SLR. 7. Metric based on annualized SLR as of June 30 , 2023. 8. As used herein, Investment Grade includes both actual investment grade ratings of the tenant or guarantor, if available, or implied investment grade. Implied investment grade may include actual ratings of tenant parent, guaranto r parent (regardless of whether or not the parent has guaranteed the tenant’s obligation under the lease) or by using a proprietary Moody’s analytical tool, which generates an implied rating by measuring a company’s probability of default. The term “parent” for these purposes includes any entity, including any governmental entity, owning more than 50% of the voting stock in a tenant. Multi - tenant portfolio includes credit ratings for tenants who occupy 10,000 square feet or more. Note: Balance sheet and portfolio metrics as of June 30, 2023, unless otherwise noted.
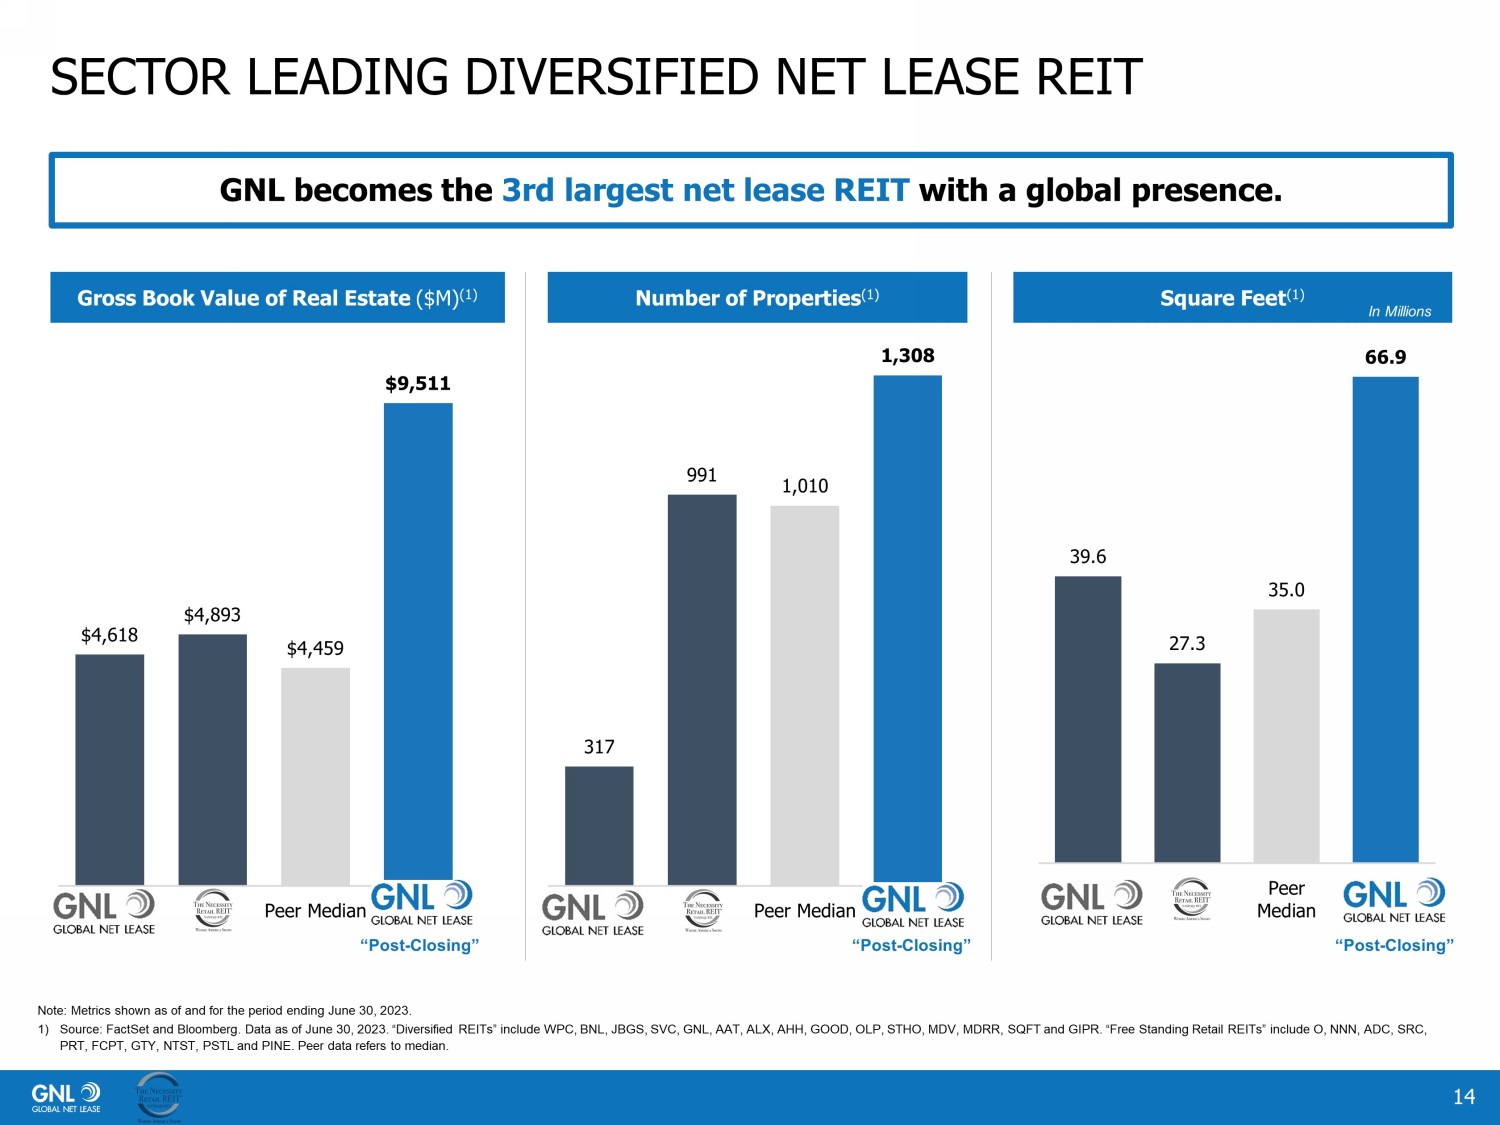
$4,618 $4,893 $4,459 $9,511 Peer Median 317 991 1,010 1,308 Peer Median 39.6 27.3 35.0 66.9 Peer Median SECTOR LEADING DIVERSIFIED NET LEASE REIT 14 GNL becomes the 3rd largest net lease REIT with a global presence. Note: Metrics shown as of and for the period ending June 30, 2023. 1) Source: FactSet and Bloomberg. Data as of June 30, 2023. “Diversified REITs” include WPC, BNL, JBGS, SVC, GNL, AAT, ALX, AHH, GO OD, OLP, STHO, MDV, MDRR, SQFT and GIPR. “Free Standing Retail REITs” include O, NNN, ADC, SRC, PRT, FCPT, GTY, NTST, PSTL and PINE. Peer data refers to median. Gross Book Value of Real Estate ($M) (1) Number of Properties (1) Square Feet (1) “Post - Closing” “Post - Closing” “Post - Closing” In Millions
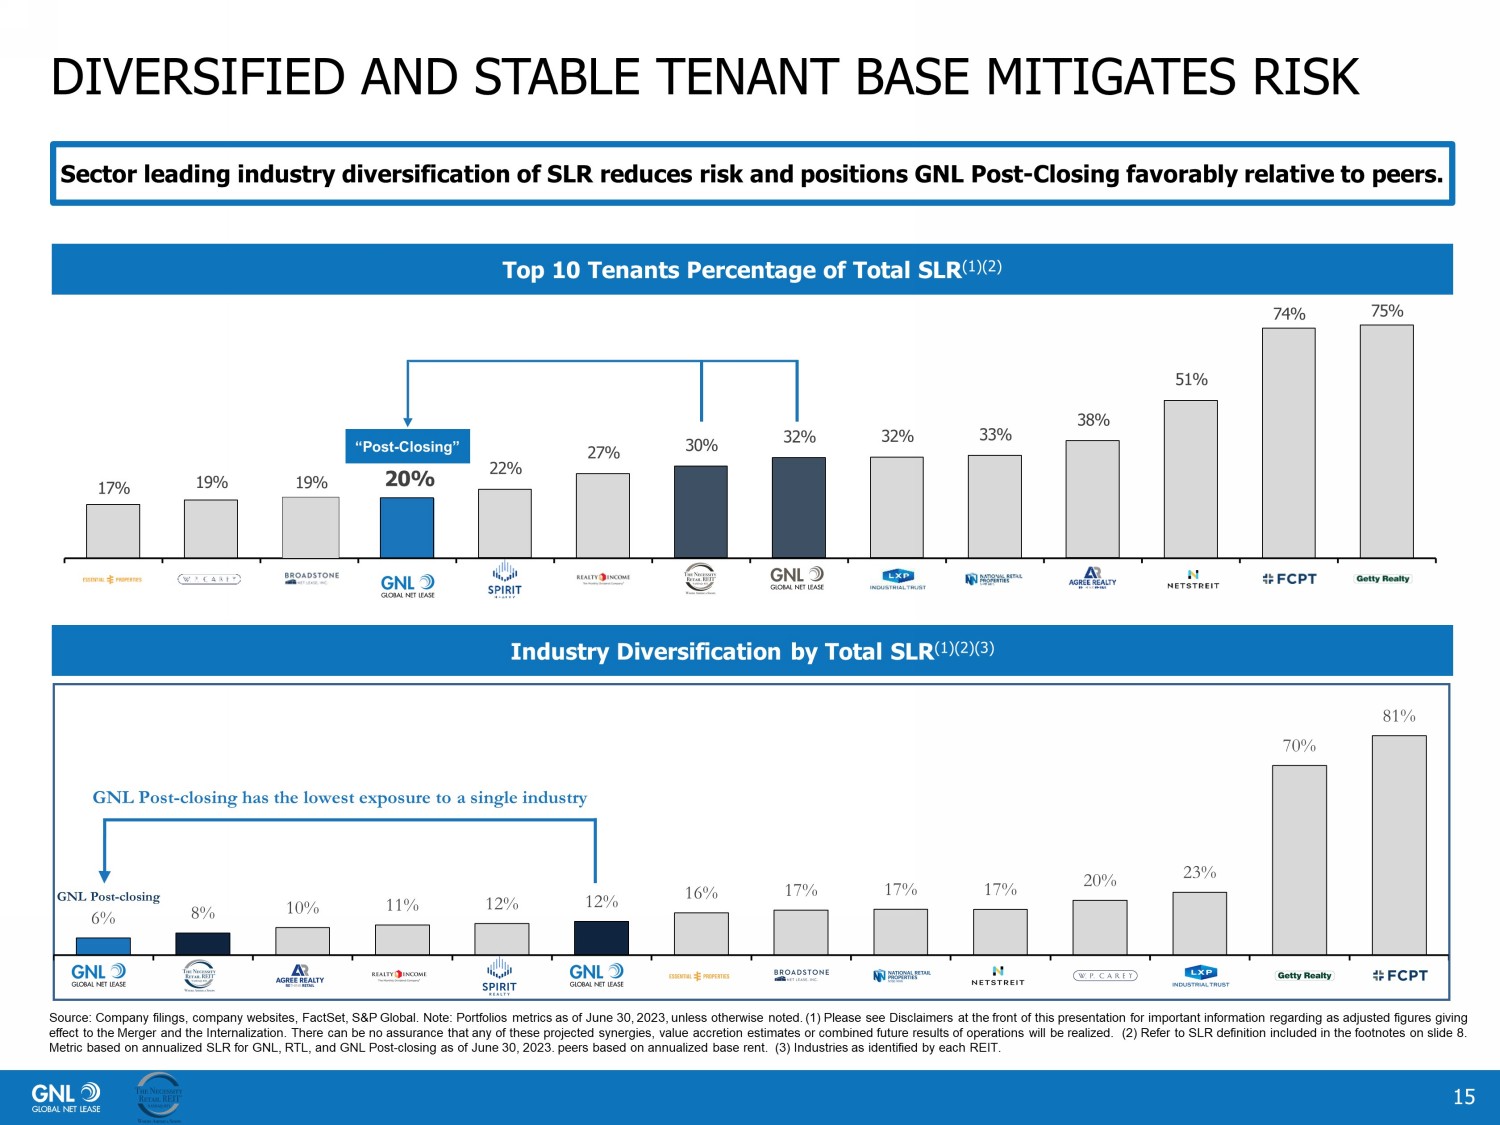
DIVERSIFIED AND STABLE TENANT BASE MITIGATES RISK 15 Sector leading industry diversification of SLR reduces risk and positions GNL Post - Closing favorably relative to peers. Top 10 Tenants Percentage of Total SLR (1)(2) “Post - Closing” 17% 19% 20 % 19% 22% 27% 30 % 32% 32% 33% 38% 51% 74% 75% Industry Diversification by Total SLR (1)(2)(3) Source: Company filings, company websites, FactSet, S&P Global. Note: Portfolios metrics as of June 30, 2023, unless otherwise noted. (1) Please see Disclaimers at the front of this presentation for important information regarding as adjusted figures giving effect to the Merger and the Internalization. There can be no assurance that any of these projected synergies, value accretio n e stimates or combined future results of operations will be realized. (2) Refer to SLR definition included in the footnotes on sl ide 8. Metric based on annualized SLR for GNL, RTL, and GNL Post - closing as of June 30, 2023. peers based on annualized base rent. (3) Industries as identified by each REIT. 6% 8% 10% 11% 12% 12% 16% 17% 17% 17% 20% 23% 70% 81% GNL Post - closing has the lowest exposure to a single industry GNL Post - closing
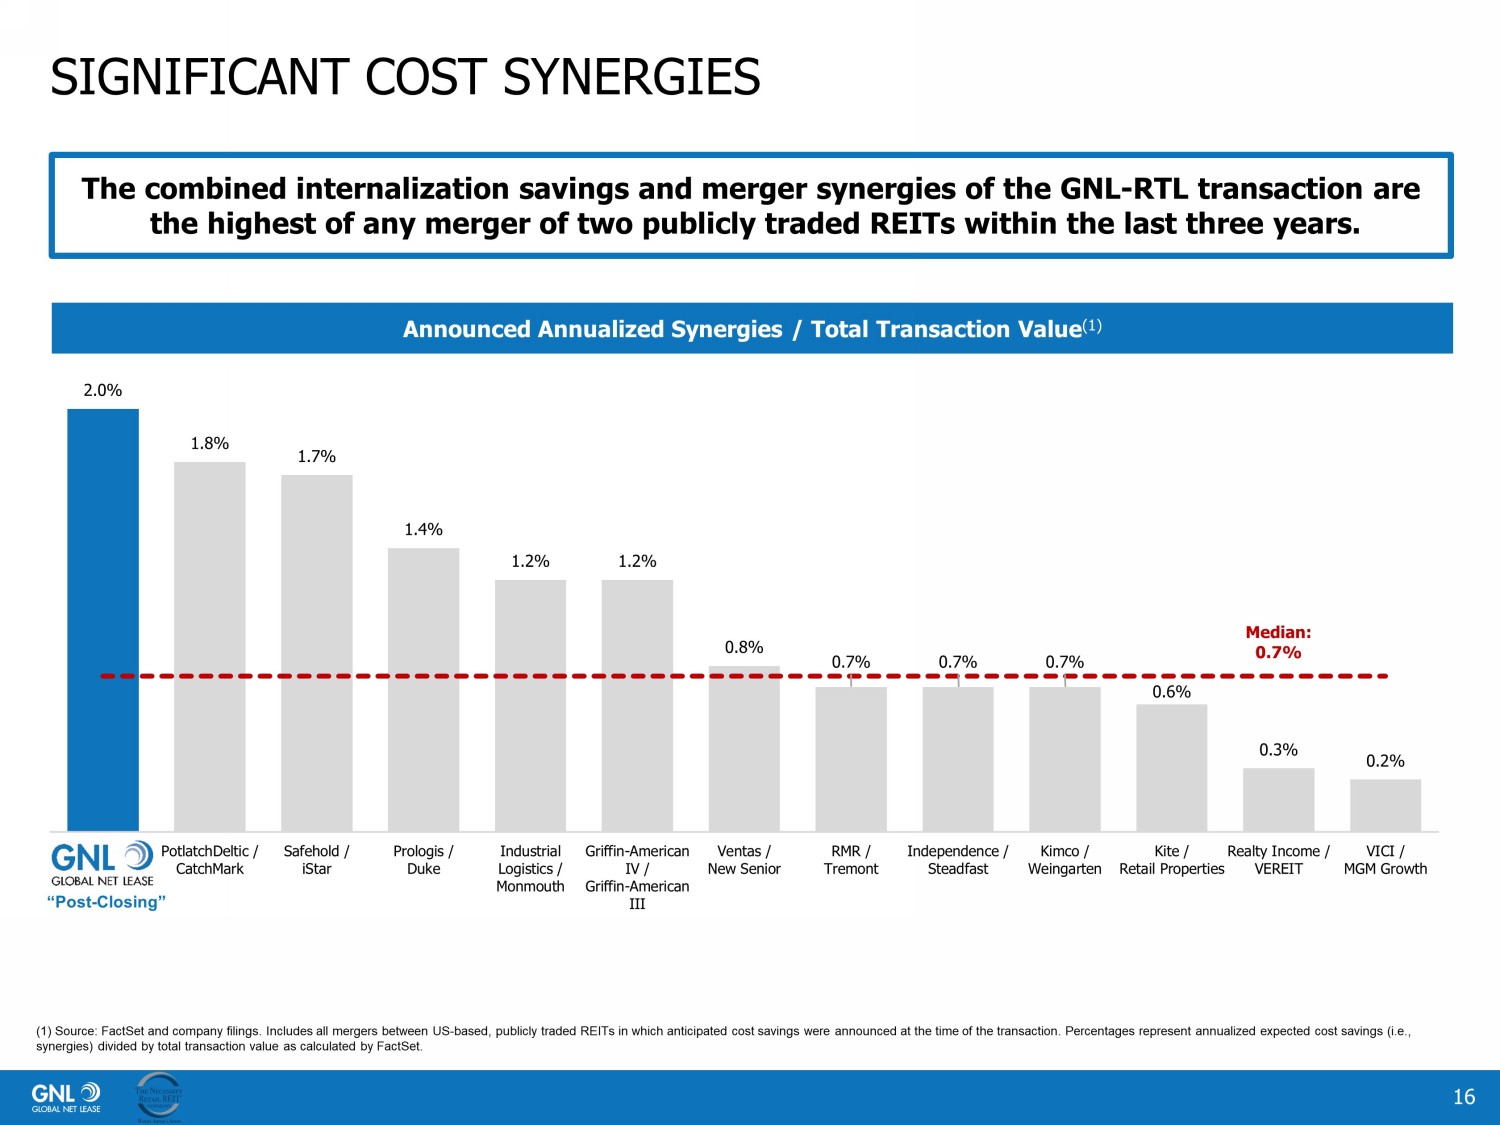
SIGNIFICANT COST SYNERGIES 16 The combined internalization savings and merger synergies of the GNL - RTL transaction are the highest of any merger of two publicly traded REITs within the last three years. (1) Source: FactSet and company filings. Includes all mergers between US - based, publicly traded REITs in which anticipated cost savings were announced at the time of the transaction. Percentages represent annualized expected cost savings (i.e., synergies) divided by total transaction value as calculated by FactSet. Announced Annualized Synergies / Total Transaction Value (1) 2.0% 1.8% 1.7% 1.4% 1.2% 1.2% 0.8% 0.7% 0.7% 0.7% 0.6% 0.3% 0.2% Median: 0.7% GNL / Necessity Retail PotlatchDeltic / CatchMark Safehold / iStar Prologis / Duke Industrial Logistics / Monmouth Griffin-American IV / Griffin-American III Ventas / New Senior RMR / Tremont Independence / Steadfast Kimco / Weingarten Kite / Retail Properties Realty Income / VEREIT VICI / MGM Growth “Post - Closing”
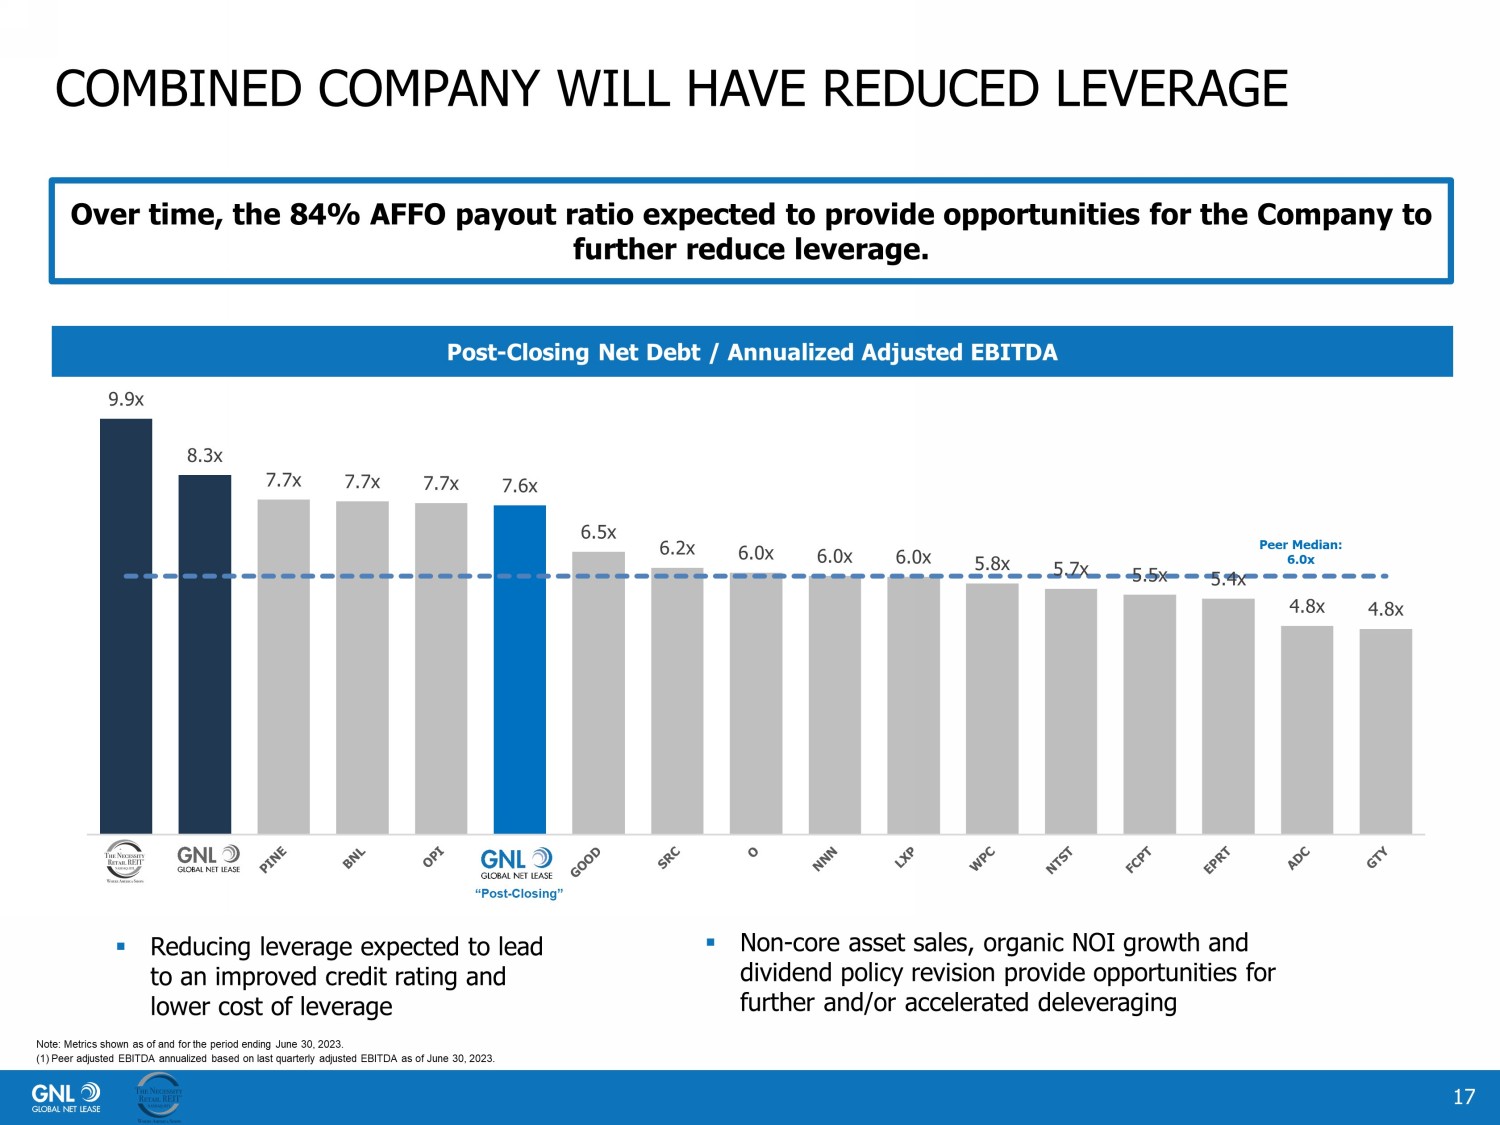
COMBINED COMPANY WILL HAVE REDUCED LEVERAGE 17 Note: Metrics shown as of and for the period ending June 30, 2023. (1) Peer adjusted EBITDA annualized based on last quarterly adjusted EBITDA as of June 30, 2023. ▪ Reducing leverage expected to lead to an improved credit rating and lower cost of leverage ▪ Non - core asset sales, organic NOI growth and dividend policy revision provide opportunities for further and/or accelerated deleveraging Over time, the 84% AFFO payout ratio expected to provide opportunities for the Company to further reduce leverage. Post - Closing Net Debt / Annualized Adjusted EBITDA 9.9x 8.3x 7.7x 7.7x 7.7x 7.6x 6.5x 6.2x 6.0x 6.0x 6.0x 5.8x 5.7x 5.5x 5.4x 4.8x 4.8x “Post - Closing” Peer Median: 6.0x
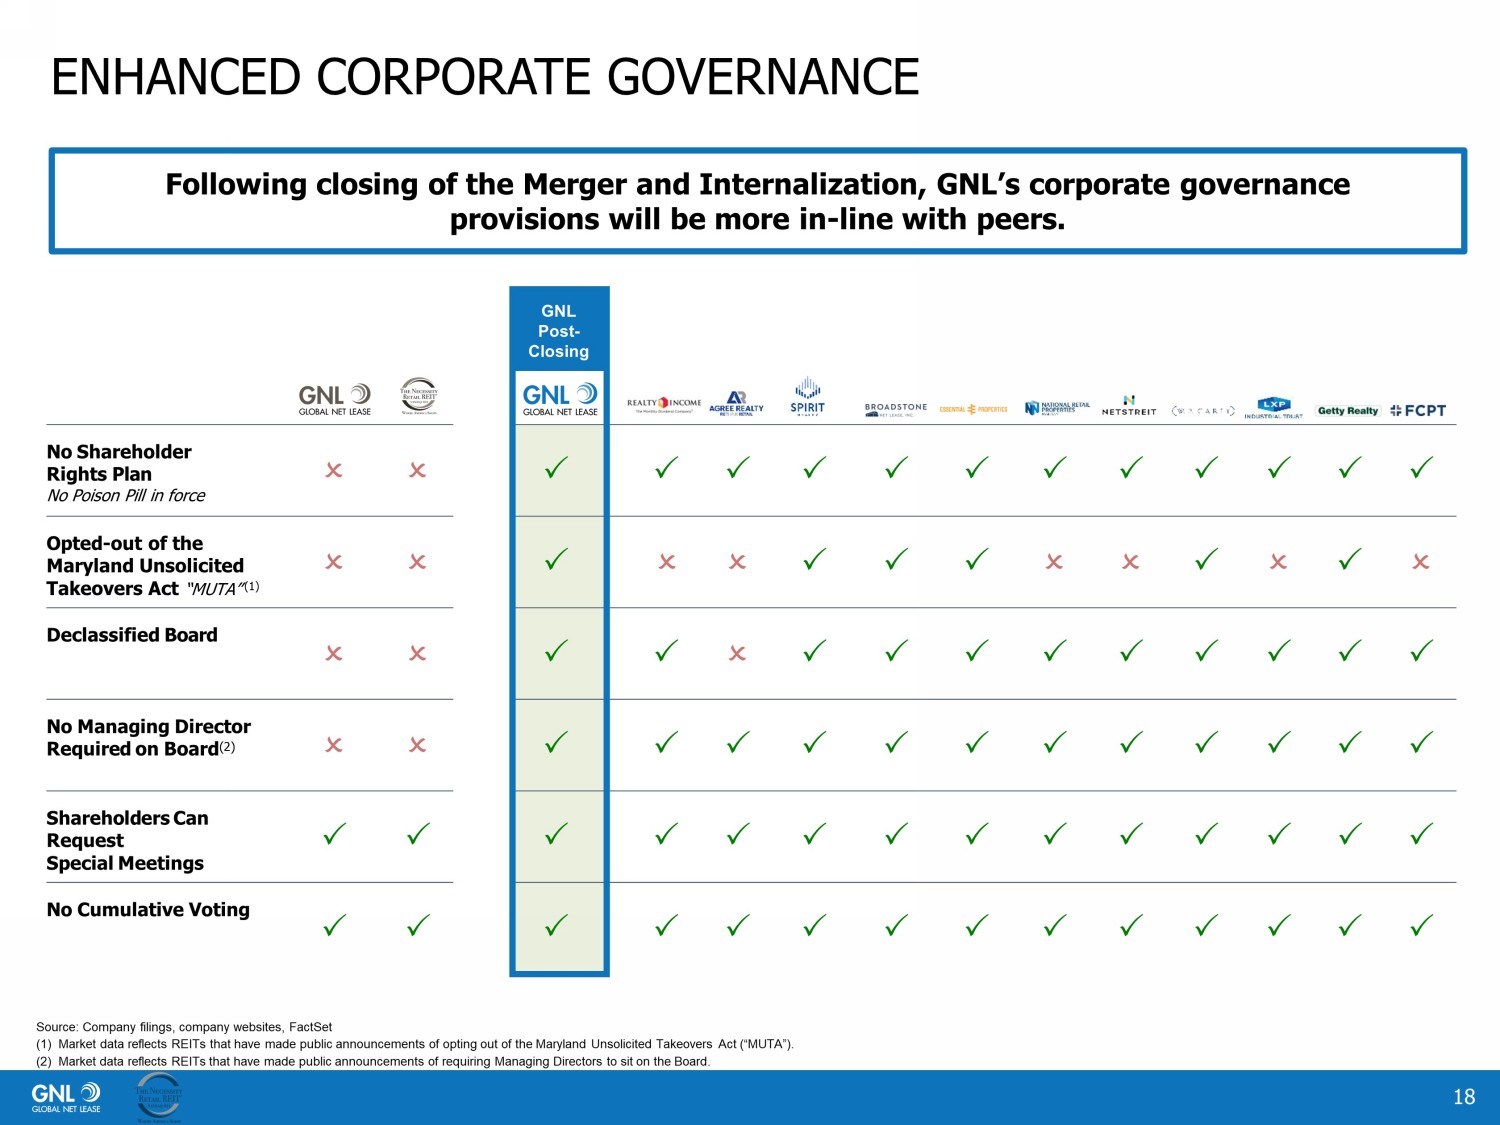
ENHANCED CORPORATE GOVERNANCE 18 Following closing of the Merger and Internalization, GNL’s corporate governance provisions will be more in - line with peers. Source: Company filings, company websites, FactSet (1) Market data reflects REITs that have made public announcements of opting out of the Maryland Unsolicited Takeovers Act ( “MU TA”). (2) Market data reflects REITs that have made public announcements of requiring Managing Directors to sit on the Board. No Shareholder Rights Plan No Poison Pill in force Opted - out of the Maryland Unsolicited Takeovers Act “MUTA” (1) Declassified Board No Managing Director Required on Board (2) Shareholders Can Request Special Meetings No Cumulative Voting GNL Post - Closing
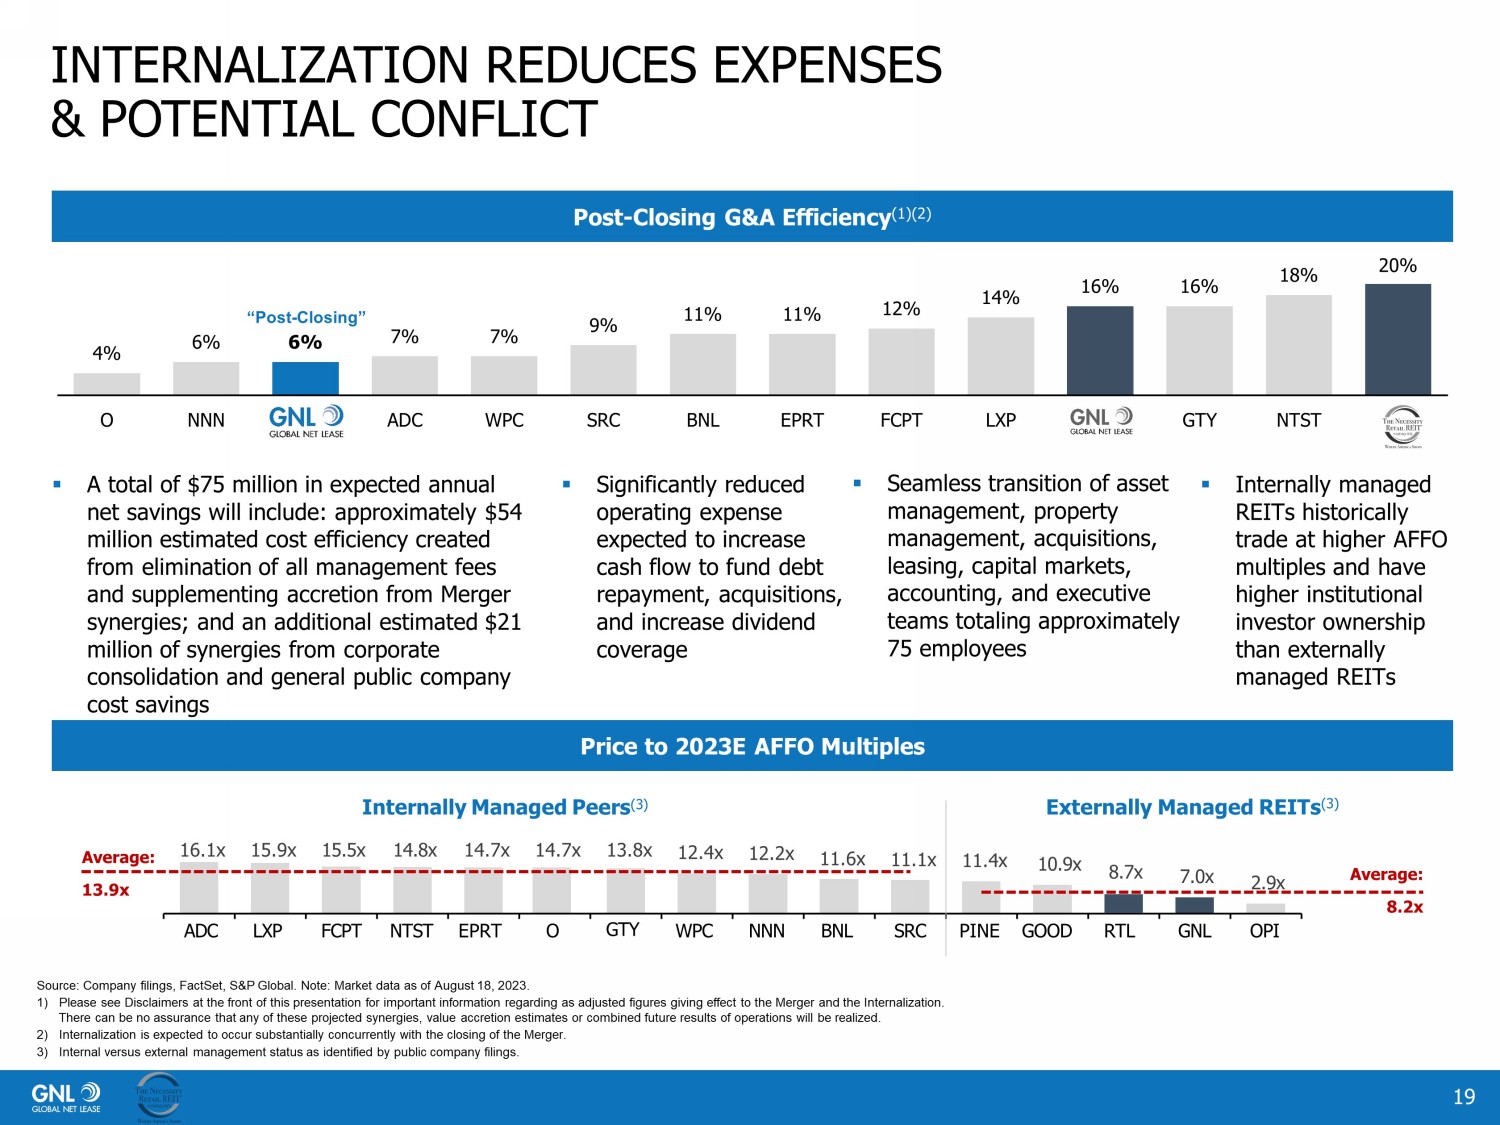
INTERNALIZATION REDUCES EXPENSES & POTENTIAL CONFLICT 19 Source: Company filings, FactSet, S&P Global. Note: Market data as of August 18, 2023. 1) Please see Disclaimers at the front of this presentation for important information regarding as adjusted figures giving effec t t o the Merger and the Internalization. There can be no assurance that any of these projected synergies, value accretion estimates or combined future results of oper ati ons will be realized. 2) Internalization is expected to occur substantially concurrently with the closing of the Merger. 3) Internal versus external management status as identified by public company filings. Price to 2023E AFFO Multiples 4% 6% 6% 7% 7% 9% 11% 11% 12% 14% 16% 16% 18% 20% O NNN GNL ADC WPC SRC BNL EPRT FCPT LXP GNL GTY NTST RTL “Post - Closing” ▪ A total of $75 million in expected annual net savings will include: approximately $54 million estimated cost efficiency created from elimination of all management fees and supplementing accretion from Merger synergies; and an additional estimated $21 million of synergies from corporate consolidation and general public company cost savings ▪ Significantly reduced operating expense expected to increase cash flow to fund debt repayment, acquisitions, and increase dividend coverage ▪ Seamless transition of asset management, property management, acquisitions, leasing, capital markets, accounting, and executive teams totaling approximately 75 employees ▪ Internally managed REITs historically trade at higher AFFO multiples and have higher institutional investor ownership than externally managed REITs Post - Closing G&A Efficiency (1)(2) Internally Managed Peers (3) Externally Managed REITs (3) 1 6.1 x 1 5 . 9 x 15. 5 x 1 4.8 x 1 4 . 7 x 14. 7 x 1 3 . 8 x 1 2 . 4 x 12. 2 x 11. 6 x 11. 1 x 1 1 . 4 x 10 . 9 x 8.7 x 7.0 x 2 . 9 x ADC LXP FCPT NTST EPRT O GTY WPC NNN BNL SRC PINE GOOD RTL GNL OPI Average: 13.9x Average: 8.2x
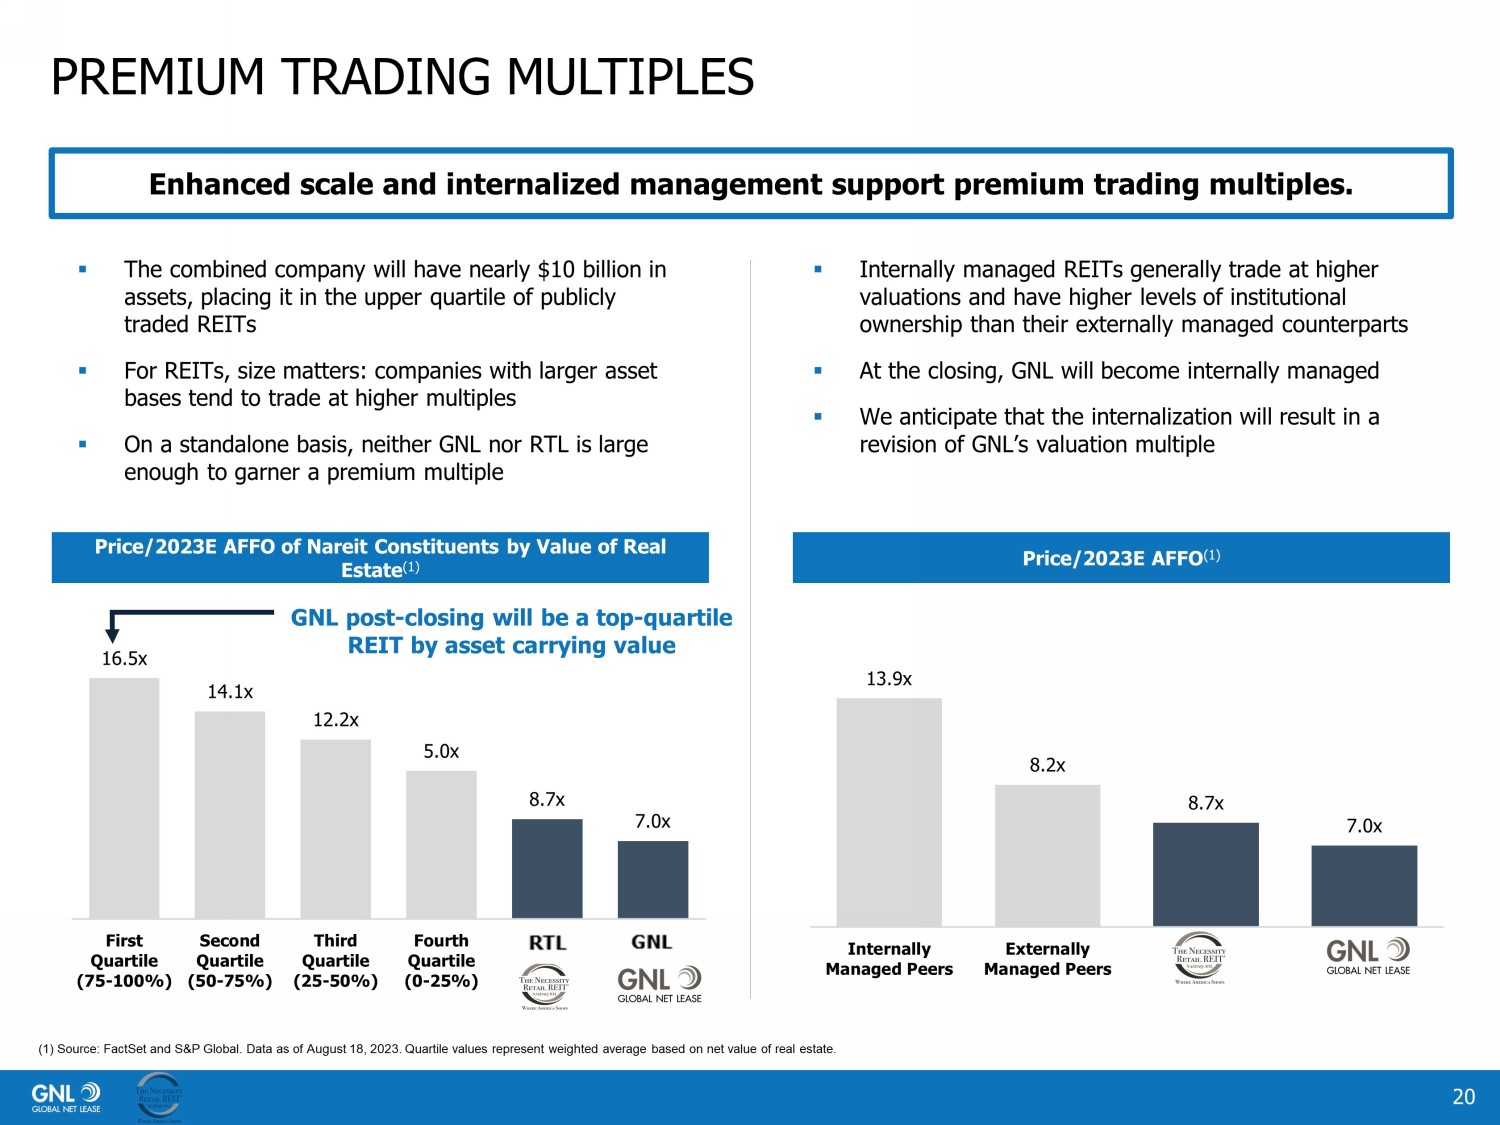
PREMIUM TRADING MULTIPLES 20 Enhanced scale and internalized management support premium trading multiples. (1) Source: FactSet and S&P Global. Data as of August 18, 2023. Quartile values represent weighted average based on net value of real estate. Price/2023E AFFO of Nareit Constituents by Value of Real Estate (1) ▪ The combined company will have nearly $10 billion in assets, placing it in the upper quartile of publicly traded REITs ▪ For REITs, size matters: companies with larger asset bases tend to trade at higher multiples ▪ On a standalone basis, neither GNL nor RTL is large enough to garner a premium multiple ▪ Internally managed REITs generally trade at higher valuations and have higher levels of institutional ownership than their externally managed counterparts ▪ At the closing, GNL will become internally managed ▪ We anticipate that the internalization will result in a revision of GNL’s valuation multiple Price/2023E AFFO (1) GNL post - closing will be a top - quartile REIT by asset carrying value 13.9x 8.2x 8.7x 7.0x Internally Managed Peers Externally Managed Peers 16.5x 14.1x 12.2x 5.0x 8.7x 7.0x First Quartile (75-100%) Second Quartile (50-75%) Third Quartile (25-50%) Fourth Quartile (0-25%) GNL RTL
ADDRESSING SHAREHOLDER CONCERNS 21 III
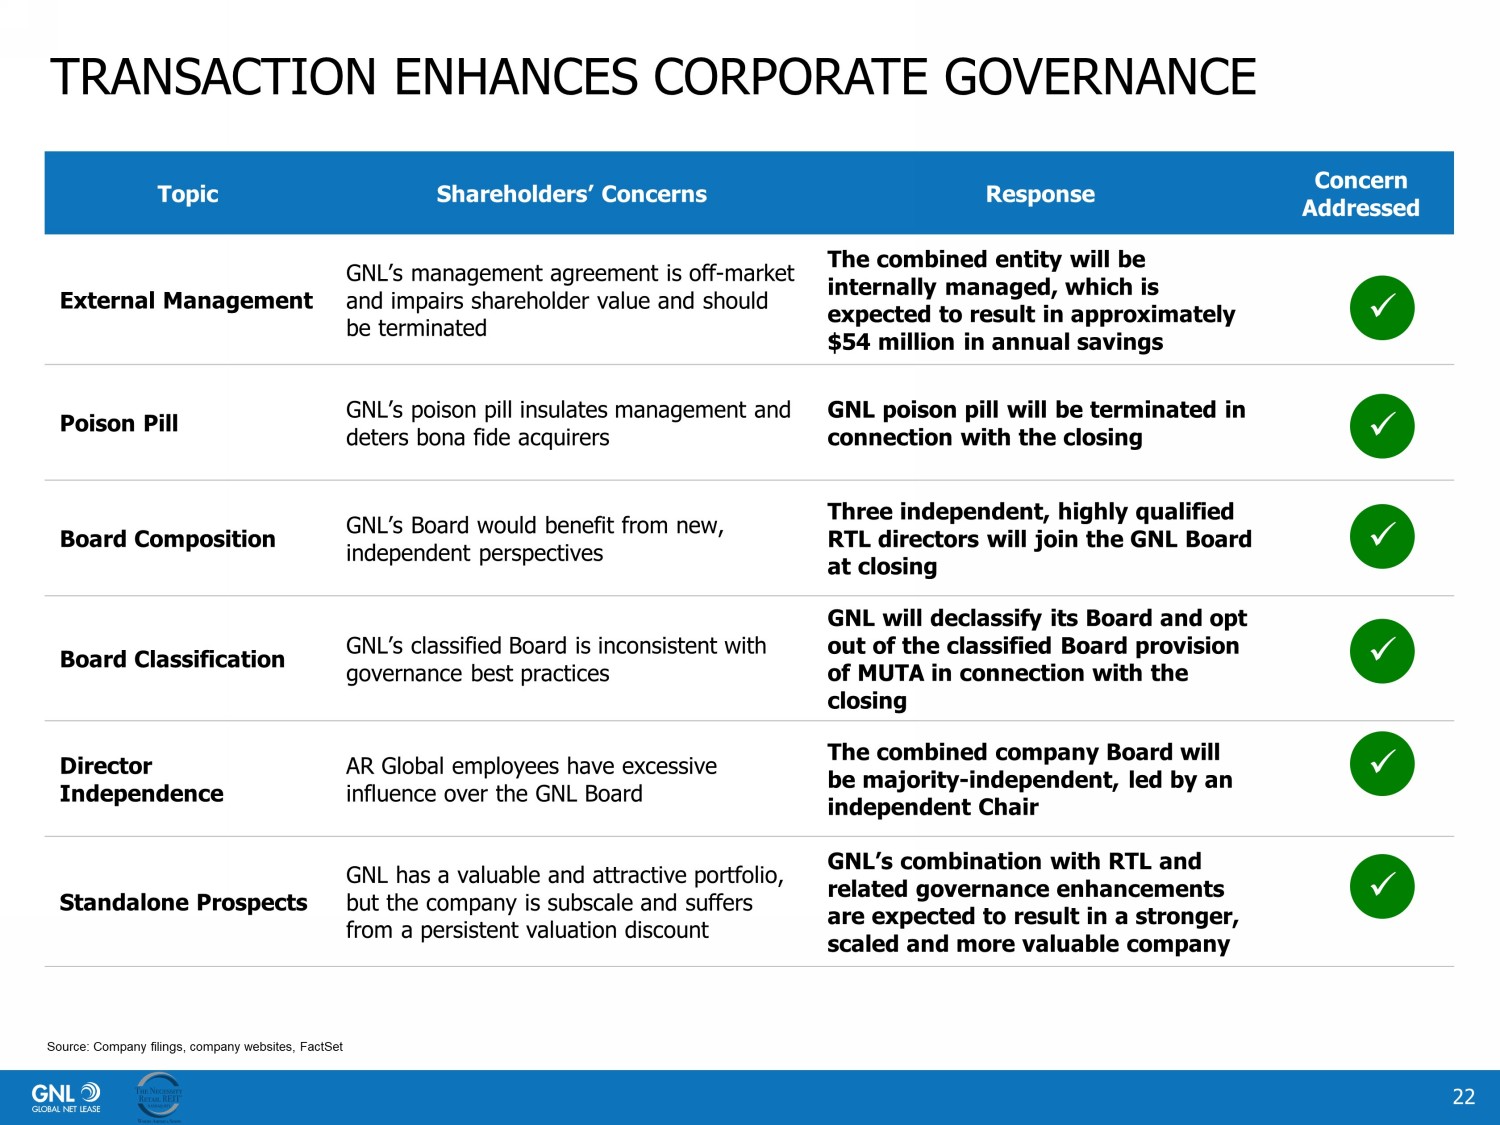
TRANSACTION ENHANCES CORPORATE GOVERNANCE 22 Topic Shareholders’ Concerns Response Concern Addressed External Management GNL’s management agreement is off - market and impairs shareholder value and should be terminated The combined entity will be internally managed, which is expected to result in approximately $54 million in annual savings Poison Pill GNL’s poison pill insulates management and deters bona fide acquirers GNL poison pill will be terminated in connection with the closing Board Composition GNL’s Board would benefit from new, independent perspectives Three independent, highly qualified RTL directors will join the GNL Board at closing Board Classification GNL’s classified Board is inconsistent with governance best practices GNL will declassify its Board and opt out of the classified Board provision of MUTA in connection with the closing Director Independence AR Global employees have excessive influence over the GNL Board The combined company Board will be majority - independent, led by an independent Chair Standalone Prospects GNL has a valuable and attractive portfolio, but the company is subscale and suffers from a persistent valuation discount GNL’s combination with RTL and related governance enhancements are expected to result in a stronger, scaled and more valuable company x x x x x x Source: Company filings, company websites, FactSet

Topic Description of Enhancement Expected Enhancement Insider Ownership AR Global, the Company’s previous external manager will now own 14% of the combined company’s shares outstanding + Enhanced alignment with shareholders Shareholder Rights Plan Repealing the Company’s shareholder rights plan + Enhanced accountability to shareholders Board Classification Declassifying the Board of Directors such that seven of the Company’s nine directors would stand for election for annual terms at the 2024 annual meeting; all nine directors would stand for election at the 2025 meeting + Enhanced accountability to shareholders Maryland Unsolicited Takeovers Act (“MUTA”) Opting out of the classified board provision of MUTA, preventing the Board from re - classifying without shareholder approval + Enhanced accountability to shareholders Board Composition Amending the Company’s bylaws to delete the requirement that up to two board members be “managing directors”; Adding three independent RTL directors to the Board + Increased independence and enhanced independent oversight of management NEW GOVERNANCE CHANGES CREATE BETTER ACCOUNTABILITY & ALIGNMENT 23 Source: Company filings, company websites, FactSet
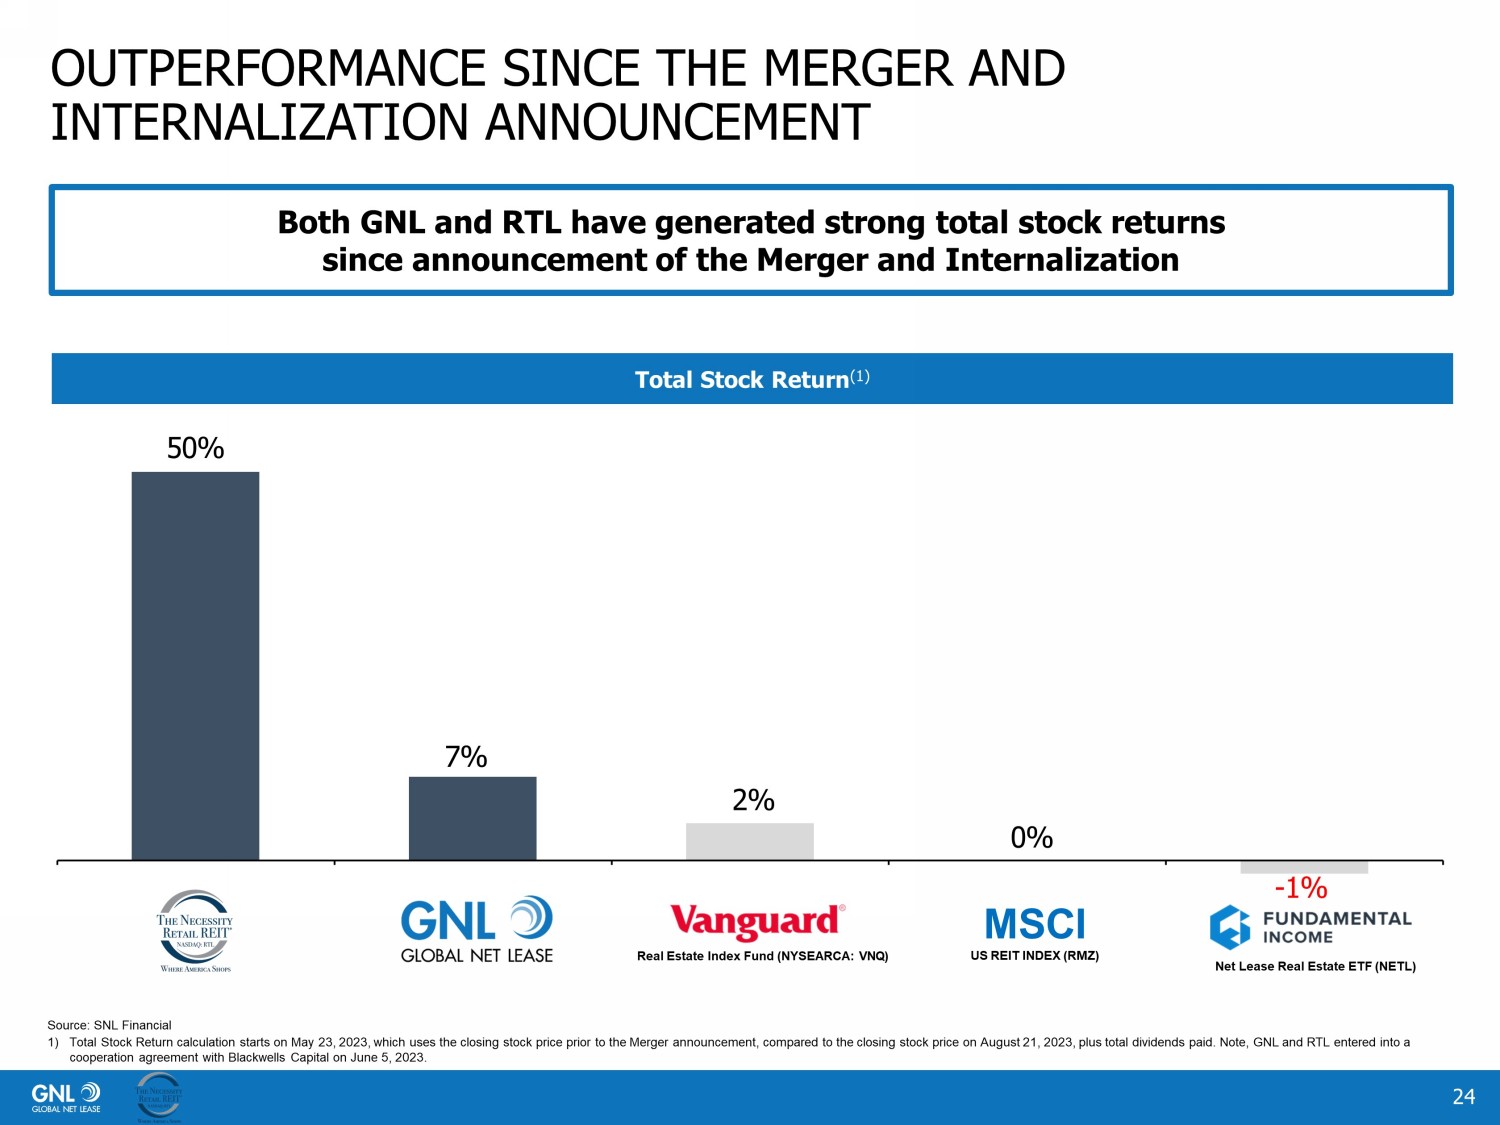
OUTPERFORMANCE SINCE THE MERGER AND INTERNALIZATION ANNOUNCEMENT 24 Both GNL and RTL have generated strong total stock returns since announcement of the Merger and Internalization Total Stock Return (1) 5 0 % 7 % 2 % 0 % - 1 % Real Estate Index Fund (NYSEARCA: VNQ) MSCI US REIT INDEX (RMZ) Net Lease Real Estate ETF (NETL) Source: SNL Financial 1) Total Stock Return calculation starts on May 23, 2023, which uses the closing stock price prior to the Merger announcement, c omp ared to the closing stock price on August 21, 2023, plus total dividends paid. Note, GNL and RTL entered into a cooperation agreement with Blackwells Capital on June 5, 2023.
CONCLUSION 25 IV
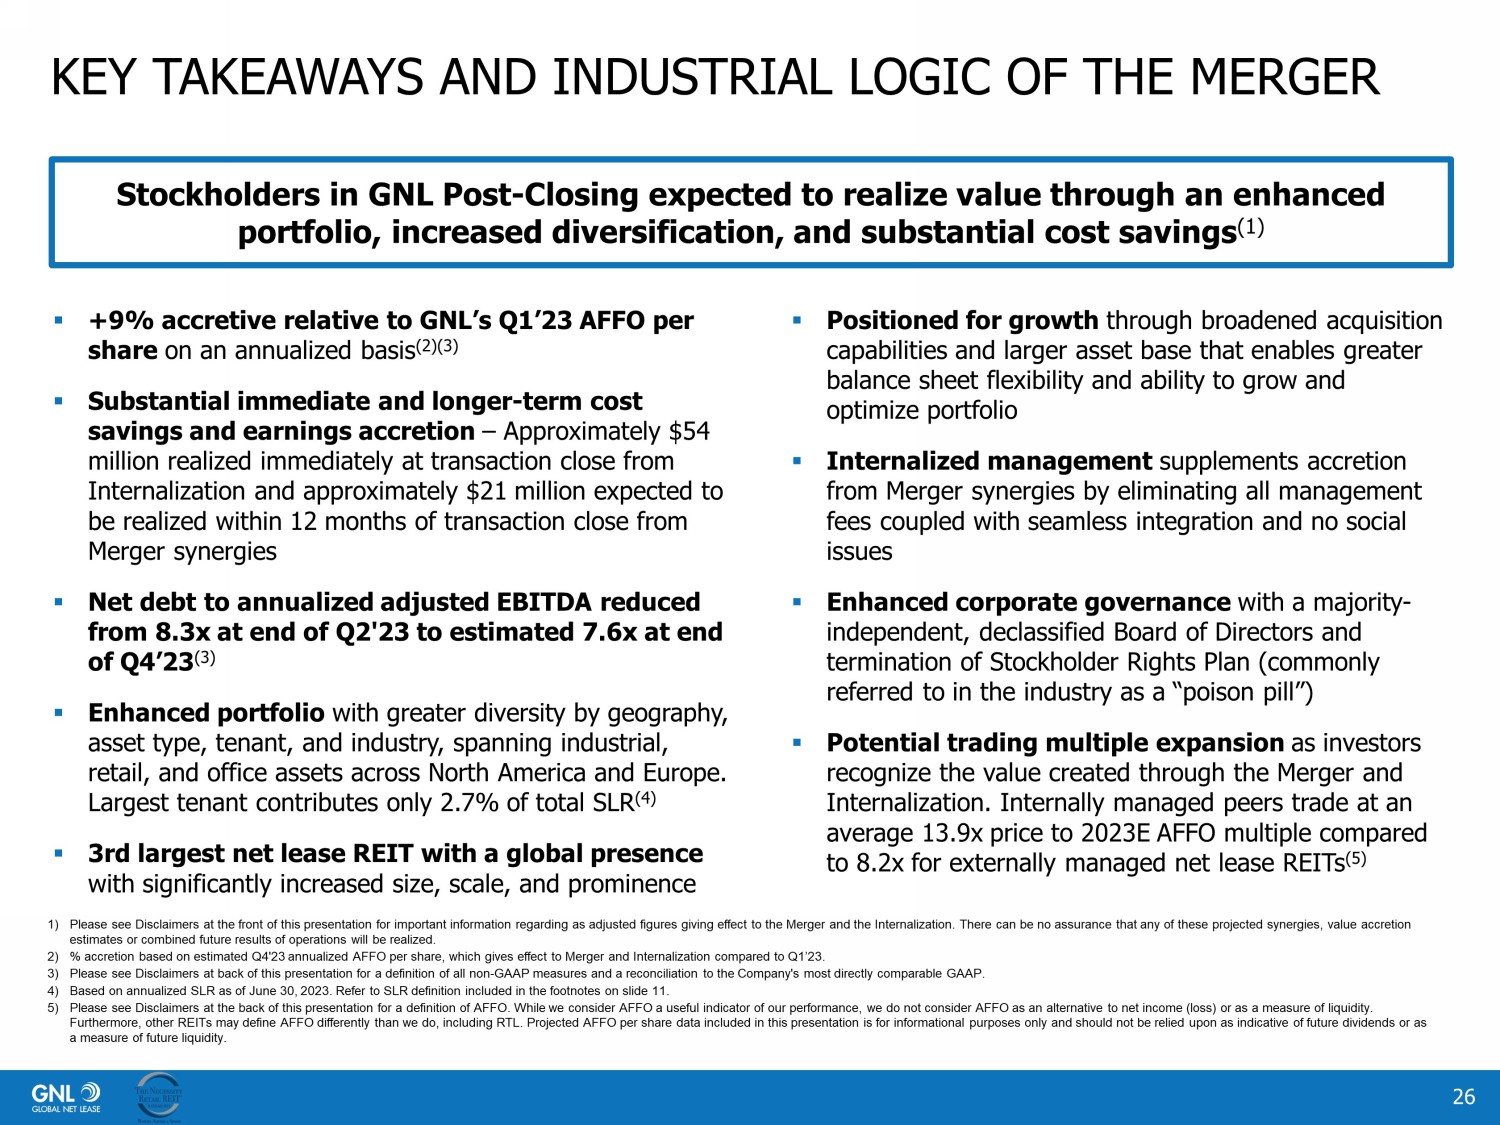
KEY TAKEAWAYS AND INDUSTRIAL LOGIC OF THE MERGER ▪ +9% accretive relative to GNL’s Q1’23 AFFO per share on an annualized basis (2)(3) ▪ Substantial immediate and longer - term cost savings and earnings accretion – Approximately $54 million realized immediately at transaction close from Internalization and approximately $21 million expected to be realized within 12 months of transaction close from Merger synergies ▪ Net debt to annualized adjusted EBITDA reduced from 8.3x at end of Q2'23 to estimated 7.6x at end of Q4’23 (3) ▪ Enhanced portfolio with greater diversity by geography, asset type, tenant, and industry, spanning industrial, retail, and office assets across North America and Europe. Largest tenant contributes only 2.7% of total SLR (4) ▪ 3rd largest net lease REIT with a global presence with significantly increased size, scale, and prominence 26 Stockholders in GNL Post - Closing expected to realize value through an enhanced portfolio, increased diversification, and substantial cost savings (1) ▪ Positioned for growth through broadened acquisition capabilities and larger asset base that enables greater balance sheet flexibility and ability to grow and optimize portfolio ▪ Internalized management supplements accretion from Merger synergies by eliminating all management fees coupled with seamless integration and no social issues ▪ Enhanced corporate governance with a majority - independent, declassified Board of Directors and termination of Stockholder Rights Plan (commonly referred to in the industry as a “poison pill”) ▪ Potential trading multiple expansion as investors recognize the value created through the Merger and Internalization. Internally managed peers trade at an average 13.9x price to 2023E AFFO multiple compared to 8.2x for externally managed net lease REITs (5) 1) Please see Disclaimers at the front of this presentation for important information regarding as adjusted figures giving effec t t o the Merger and the Internalization. There can be no assurance that any of these projected synergies, value accretion estimates or combined future results of operations will be realized. 2) % accretion based on estimated Q4'23 annualized AFFO per share, which gives effect to Merger and Internalization compared to Q1’ 23. 3) Please see Disclaimers at back of this presentation for a definition of all non - GAAP measures and a reconciliation to the Compan y's most directly comparable GAAP. 4) Based on annualized SLR as of June 30, 2023. Refer to SLR definition included in the footnotes on slide 11. 5) Please see Disclaimers at the back of this presentation for a definition of AFFO. While we consider AFFO a useful indicator o f o ur performance, we do not consider AFFO as an alternative to net income (loss) or as a measure of liquidity. Furthermore, other REITs may define AFFO differently than we do, including RTL. Projected AFFO per share data included in thi s p resentation is for informational purposes only and should not be relied upon as indicative of future dividends or as a measure of future liquidity.
APPENDIX Financial Definitions & NON - GAAP Reconciliations 27 V
FINANCIAL DEFINITIONS 28 Non - GAAP Financial Measures This section discusses non - GAAP financial measures we use to evaluate our performance, including Funds from Operations (“FFO”), Core Funds from Operations (“Core FFO”), Adjusted Funds from Operations (“AFFO”), Adjusted Earnings before Interest, Taxes, Depreciation and Amortization (“Adjusted EBITDA”), Net Operating Income (“NOI”), Cash Net Operating Income (“Cash NOI”), and Constant Currency . While NOI is a property - level measure, AFFO is based on total Company performance and therefore reflects the impact of other items not specifically associated with NOI such as, interest expense, general and administrative expenses and operating fees to related parties . Additionally, NOI as defined herein, does not reflect an adjustment for straight - line rent but AFFO does include this adjustment . A description of these non - GAAP measures and reconciliations to the most directly comparable GAAP measure, which is net income, is provided below . Caution on Use of Non - GAAP Measures FFO, Core FFO, AFFO, Adjusted EBITDA, NOI, Cash NOI, and Constant Currency should not be construed to be more relevant or accurate than the current GAAP methodology in calculating net income or in its applicability in evaluating our operating performance . The method utilized to evaluate the value and performance of real estate under GAAP should be construed as a more relevant measure of operational performance and considered more prominently than the non - GAAP measures . Other REITs may not define FFO in accordance with the current National Association of Real Estate Investment Trusts (“NAREIT”) definition (as we do), or may interpret the current NAREIT definition differently than we do, or may calculate Core FFO or AFFO differently than we do . Consequently, our presentation of FFO, Core FFO and AFFO may not be comparable to other similarly - titled measures presented by other REITs . We consider FFO, Core FFO and AFFO useful indicators of our performance . Because FFO, Core FFO and AFFO calculations exclude such factors as depreciation and amortization of real estate assets and gain or loss from sales of operating real estate assets (which can vary among owners of identical assets in similar conditions based on historical cost accounting and useful - life estimates), FFO, Core FFO and AFFO presentations facilitate comparisons of operating performance between periods and between other REITs in our peer group . Constant currency results exclude any benefit or loss caused by foreign exchange fluctuations between foreign currencies and the United States dollar which would not have occurred if there had been a constant exchange rate . Revenue from tenants on a Constant Currency basis is calculated by applying the average monthly currency rates from prior comparable period to Revenues from tenants from the applicable period . We believe that this measure provides investors with information about revenue results and trends that eliminates currency volatility while increasing the comparability of our underlying results and trends .
FINANCIAL DEFINITIONS 29 Funds from Operations, Core Funds from Operations and Adjusted Funds from Operations Funds From Operations Due to certain unique operating characteristics of real estate companies, as discussed below, NAREIT, an industry trade group, has promulgated a measure known as FFO, which we believe to be an appropriate supplemental measure to reflect the operating performance of a REIT . FFO is not equivalent to net income or loss as determined under GAAP . We calculate FFO, a non - GAAP measure, consistent with the standards established over time by the Board of Governors of NAREIT, as restated in a White Paper approved by the Board of Governors of NAREIT effective in December 2018 (the “White Paper”) . The White Paper defines FFO as net income or loss computed in accordance with GAAP, excluding depreciation and amortization related to real estate, gain and loss from the sale of certain real estate assets, gain and loss from change in control and impairment write - downs of certain real estate assets and investments in entities when the impairment is directly attributable to decreases in the value of depreciable real estate held by the entity . Adjustments for unconsolidated partnerships and joint ventures are calculated to exclude the proportionate share of the non - controlling interest to arrive at FFO, Core FFO, AFFO and NOI attributable to stockholders, as applicable . Our FFO calculation complies with NAREIT’s definition . The historical accounting convention used for real estate assets requires straight - line depreciation of buildings and improvements, and straight - line amortization of intangibles, which implies that the value of a real estate asset diminishes predictably over time . We believe that, because real estate values historically rise and fall with market conditions, including inflation, interest rates, unemployment and consumer spending, presentations of operating results for a REIT using historical accounting for depreciation and certain other items may be less informative . Historical accounting for real estate involves the use of GAAP . Any other method of accounting for real estate such as the fair value method cannot be construed to be any more accurate or relevant than the comparable methodologies of real estate valuation found in GAAP . Nevertheless, we believe that the use of FFO, which excludes the impact of real estate related depreciation and amortization, among other things, provides a more complete understanding of our performance to investors and to management, and, when compared year over year, reflects the impact on our operations from trends in occupancy rates, rental rates, operating costs, general and administrative expenses, and interest costs, which may not be immediately apparent from net income .

FINANCIAL DEFINITIONS 30 Funds from Operations, Core Funds from Operations and Adjusted Funds from Operations (Cont’d) Core Funds From Operations In calculating Core FFO, we start with FFO, then we exclude certain non - core items such as merger, transaction and other costs, settlement costs related to our Blackwells/Related Parties litigation, as well as certain other costs that are considered to be non - core, such as debt extinguishment costs, fire loss and other costs related to damages at our properties . The purchase of properties, and the corresponding expenses associated with that process, is a key operational feature of our core business plan to generate operational income and cash flows in order to make dividend payments to stockholders . In evaluating investments in real estate, we differentiate the costs to acquire the investment from the subsequent operations of the investment . We also add back non - cash write - offs of deferred financing costs and prepayment penalties incurred with the early extinguishment of debt which are included in net income but are considered financing cash flows when paid in the statement of cash flows . We consider these write - offs and prepayment penalties to be capital transactions and not indicative of operations . By excluding expensed acquisition, transaction and other costs as well as non - core costs, we believe Core FFO provides useful supplemental information that is comparable for each type of real estate investment and is consistent with management’s analysis of the investing and operating performance of our properties . Adjusted Funds From Operations In calculating AFFO, we start with Core FFO, then we exclude certain income or expense items from AFFO that we consider more reflective of investing activities, other non - cash income and expense items and the income and expense effects of other activities that are not a fundamental attribute of our business plan . These items include early extinguishment of debt and other items excluded in Core FFO as well as unrealized gain and loss, which may not ultimately be realized, such as gain or loss on derivative instruments, gain or loss on foreign currency transactions, and gain or loss on investments . In addition, by excluding non - cash income and expense items such as amortization of above - market and below - market leases intangibles, amortization of deferred financing costs, straight - line rent and equity - based compensation from AFFO, we believe we provide useful information regarding income and expense items which have a direct impact on our ongoing operating performance . We also exclude revenue attributable to the reimbursement by third parties of financing costs that we originally incurred because these revenues are not, in our view, related to operating performance . We also include the realized gain or loss on foreign currency exchange contracts for AFFO as such items are part of our ongoing operations and affect our current operating performance .

FINANCIAL DEFINITIONS 31 Funds from Operations, Core Funds from Operations and Adjusted Funds from Operations (Cont’d) Adjusted Funds From Operations (cont’d) In calculating AFFO, we exclude certain expenses which under GAAP are characterized as operating expenses in determining operating net income . All paid and accrued acquisition, transaction and other costs (including prepayment penalties for debt extinguishments) and certain other expenses, including general and administrative expenses incurred for the 2023 proxy contest and related Blackwells/Related Parties litigation, negatively impact our operating performance during the period in which expenses are incurred or properties are acquired and will also have negative effects on returns to investors, but are excluded by us as we believe they are not reflective of our on - going performance . Further, under GAAP, certain contemplated non - cash fair value and other non - cash adjustments are considered operating non - cash adjustments to net income . In addition, as discussed above, we view gain and loss from fair value adjustments as items which are unrealized and may not ultimately be realized and not reflective of ongoing operations and are therefore typically adjusted for when assessing operating performance . Excluding income and expense items detailed above from our calculation of AFFO provides information consistent with management’s analysis of our operating performance . Additionally, fair value adjustments, which are based on the impact of current market fluctuations and underlying assessments of general market conditions, but can also result from operational factors such as rental and occupancy rates, may not be directly related or attributable to our current operating performance . By excluding such changes that may reflect anticipated and unrealized gain or loss, we believe AFFO provides useful supplemental information . By providing AFFO, we believe we are presenting useful information that can be used to, among other things, assess our performance without the impact of transactions or other items that are not related to our portfolio of properties . AFFO presented by us may not be comparable to AFFO reported by other REITs that define AFFO differently . Furthermore, we believe that in order to facilitate a clear understanding of our operating results, AFFO should be examined in conjunction with net income (loss) calculated in accordance with GAAP and presented in our consolidated financial statements . AFFO should not be considered as an alternative to net income (loss) as an indication of our performance or to cash flows as a measure of our liquidity or ability to make distributions .
FINANCIAL DEFINITIONS 32 Adjusted Earnings before Interest, Taxes, Depreciation and Amortization, Net Operating Income, Cash Net Operating Income, and Constant Currency. We believe that Adjusted EBITDA, which is defined as earnings before interest, taxes, depreciation and amortization adjusted for acquisition, transaction and other costs, other non - cash items and including our pro - rata share from unconsolidated joint ventures, is an appropriate measure of our ability to incur and service debt . We also exclude revenue attributable to the reimbursement by third parties of financing costs that we originally incurred because these revenues are not, in our view, related to operating performance . All paid and accrued acquisition, transaction and other costs (including prepayment penalties for debt extinguishments) and certain other expenses, including general and administrative expenses incurred for the 2023 proxy contest and related Blackwells/Related Parties litigation, negatively impact our operating performance during the period in which expenses are incurred or properties are acquired and will also have negative effects on returns to investors, but are not reflective of on - going performance . Due to the increase in general and administrative expenses as a result of the 2023 proxy contest and related litigation as a portion of our total general and administrative expenses in the first quarter of 2023 , we began including this adjustment to arrive at Adjusted EBITDA in order to better reflect our operating performance . Adjusted EBITDA for the fourth quarter of 2022 (the only prior period with these types of costs) has been conformed to this presentation . Adjusted EBITDA should not be considered as an alternative to cash flows from operating activities, as a measure of our liquidity or as an alternative to net income as an indicator of our operating activities . Other REITs may calculate Adjusted EBITDA differently and our calculation should not be compared to that of other REITs .
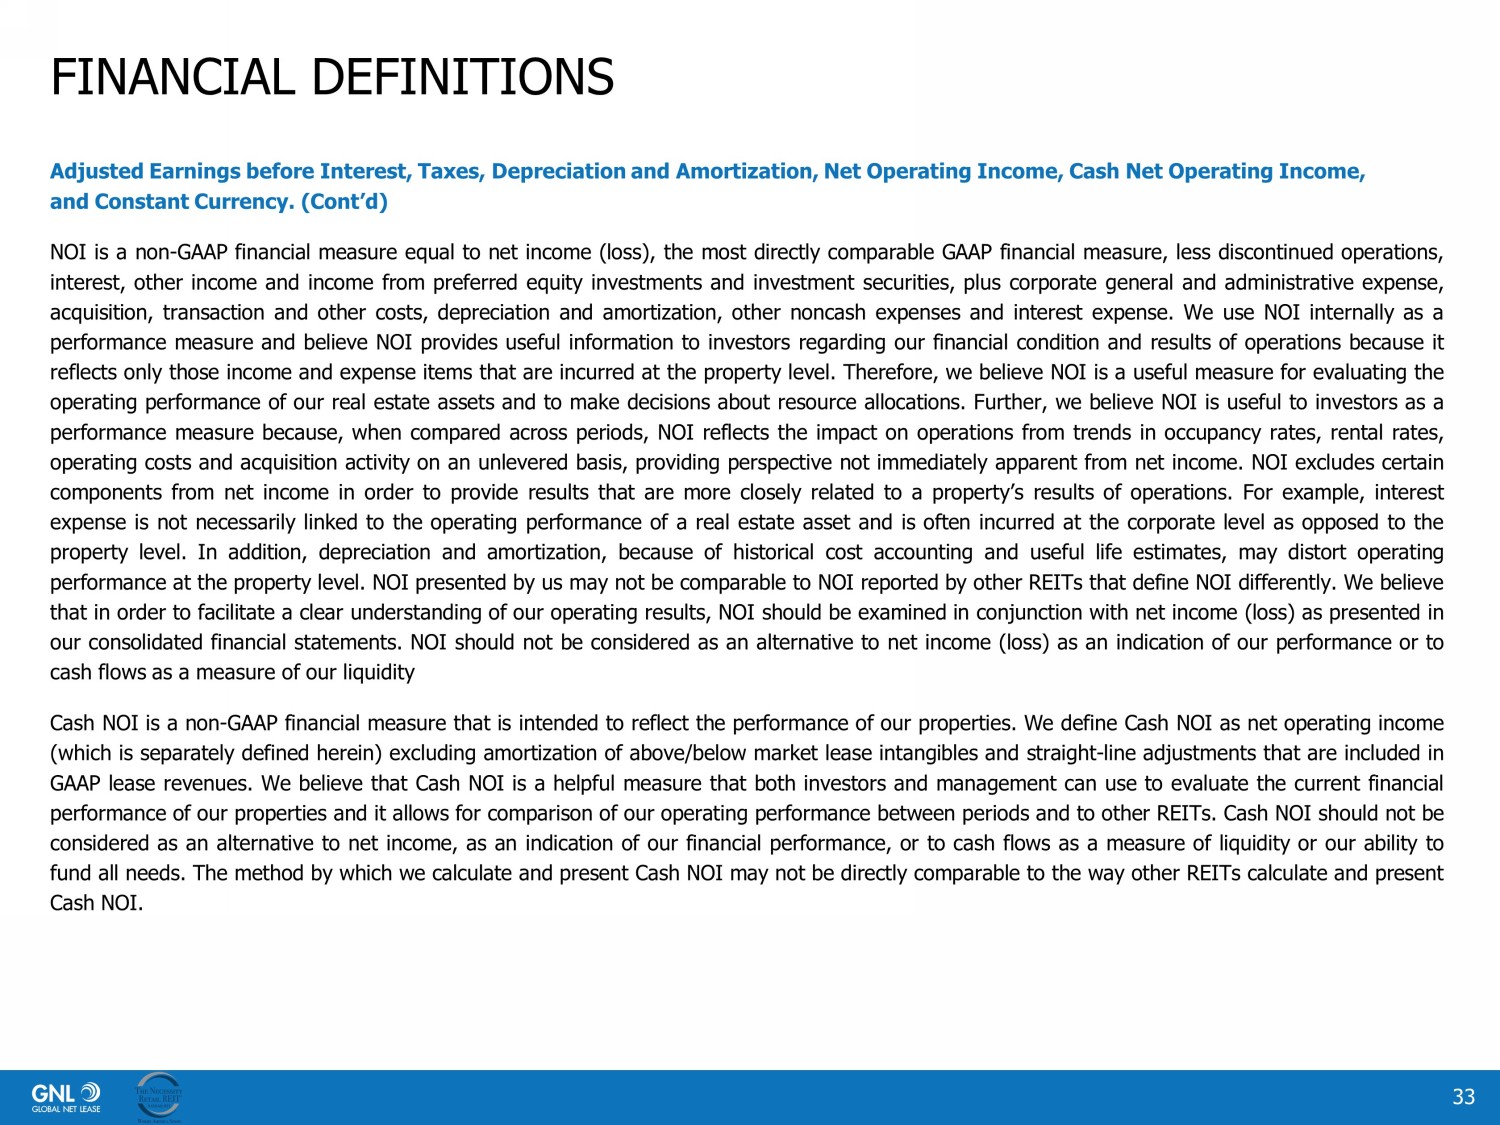
FINANCIAL DEFINITIONS 33 Adjusted Earnings before Interest, Taxes, Depreciation and Amortization, Net Operating Income, Cash Net Operating Income, and Constant Currency. (Cont’d) NOI is a non - GAAP financial measure equal to net income (loss), the most directly comparable GAAP financial measure, less discontinued operations, interest, other income and income from preferred equity investments and investment securities, plus corporate general and administrative expense, acquisition, transaction and other costs, depreciation and amortization, other noncash expenses and interest expense . We use NOI internally as a performance measure and believe NOI provides useful information to investors regarding our financial condition and results of operations because it reflects only those income and expense items that are incurred at the property level . Therefore, we believe NOI is a useful measure for evaluating the operating performance of our real estate assets and to make decisions about resource allocations . Further, we believe NOI is useful to investors as a performance measure because, when compared across periods, NOI reflects the impact on operations from trends in occupancy rates, rental rates, operating costs and acquisition activity on an unlevered basis, providing perspective not immediately apparent from net income . NOI excludes certain components from net income in order to provide results that are more closely related to a property’s results of operations . For example, interest expense is not necessarily linked to the operating performance of a real estate asset and is often incurred at the corporate level as opposed to the property level . In addition, depreciation and amortization, because of historical cost accounting and useful life estimates, may distort operating performance at the property level . NOI presented by us may not be comparable to NOI reported by other REITs that define NOI differently . We believe that in order to facilitate a clear understanding of our operating results, NOI should be examined in conjunction with net income (loss) as presented in our consolidated financial statements . NOI should not be considered as an alternative to net income (loss) as an indication of our performance or to cash flows as a measure of our liquidity Cash NOI is a non - GAAP financial measure that is intended to reflect the performance of our properties . We define Cash NOI as net operating income (which is separately defined herein) excluding amortization of above/below market lease intangibles and straight - line adjustments that are included in GAAP lease revenues . We believe that Cash NOI is a helpful measure that both investors and management can use to evaluate the current financial performance of our properties and it allows for comparison of our operating performance between periods and to other REITs . Cash NOI should not be considered as an alternative to net income, as an indication of our financial performance, or to cash flows as a measure of liquidity or our ability to fund all needs . The method by which we calculate and present Cash NOI may not be directly comparable to the way other REITs calculate and present Cash NOI .
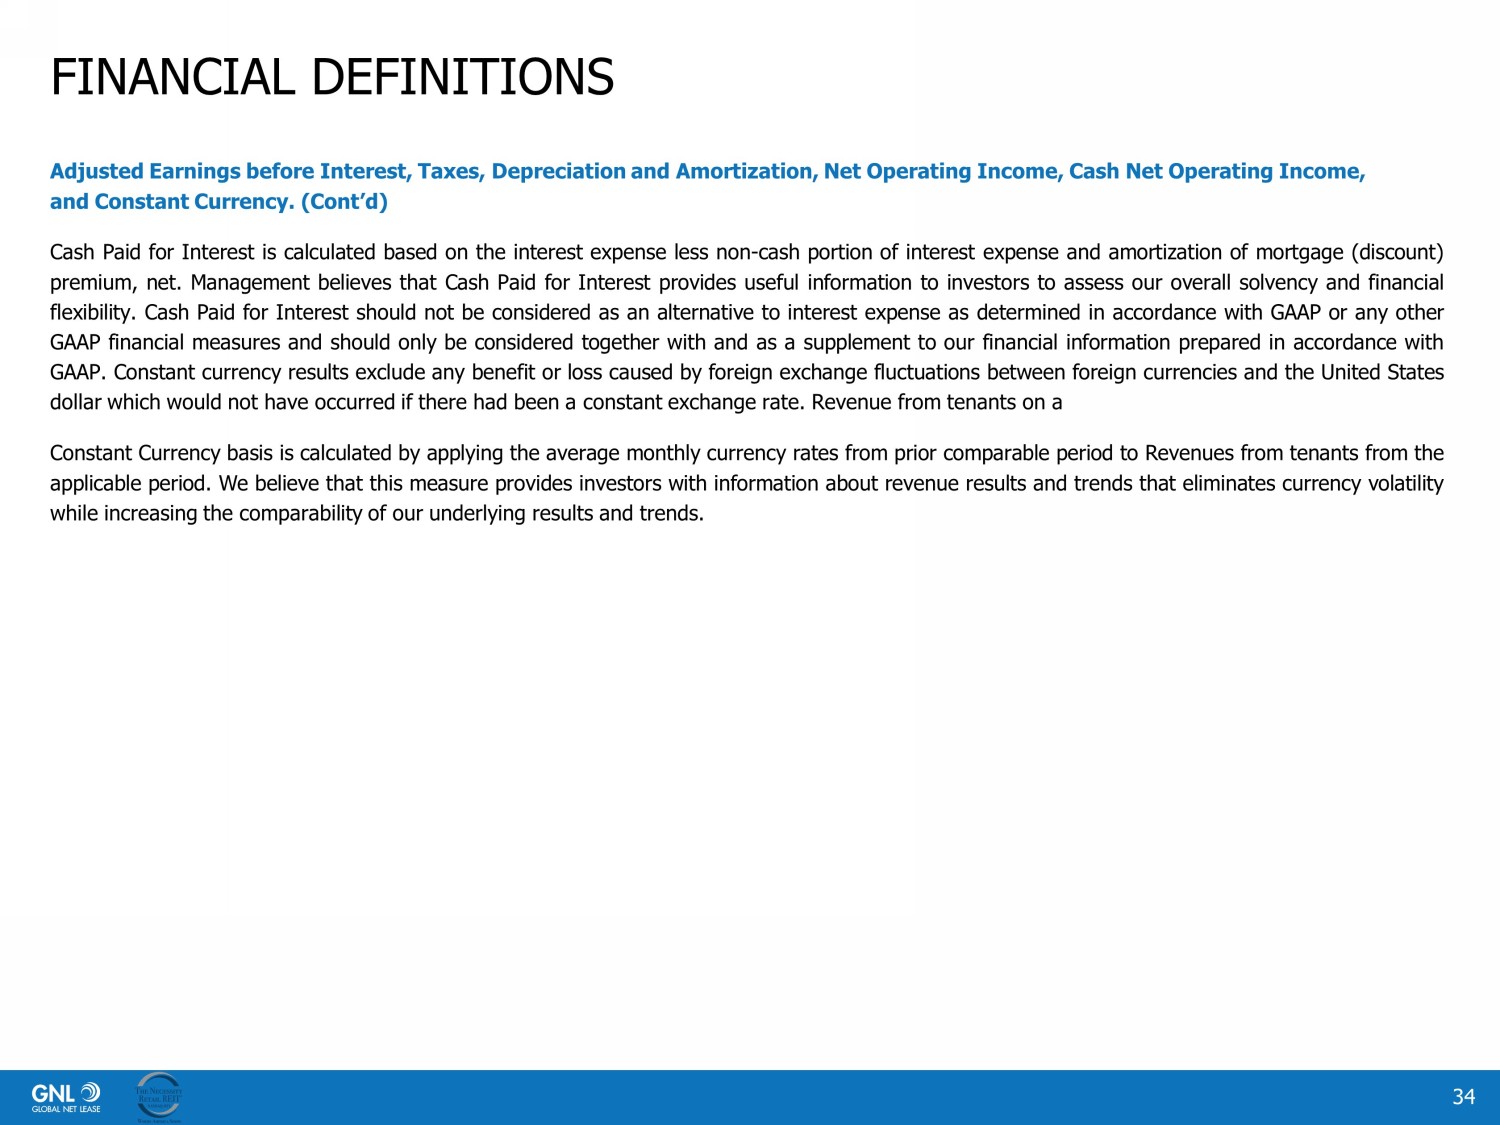
FINANCIAL DEFINITIONS 34 Adjusted Earnings before Interest, Taxes, Depreciation and Amortization, Net Operating Income, Cash Net Operating Income, and Constant Currency. (Cont’d) Cash Paid for Interest is calculated based on the interest expense less non - cash portion of interest expense and amortization of mortgage (discount) premium, net . Management believes that Cash Paid for Interest provides useful information to investors to assess our overall solvency and financial flexibility . Cash Paid for Interest should not be considered as an alternative to interest expense as determined in accordance with GAAP or any other GAAP financial measures and should only be considered together with and as a supplement to our financial information prepared in accordance with GAAP . Constant currency results exclude any benefit or loss caused by foreign exchange fluctuations between foreign currencies and the United States dollar which would not have occurred if there had been a constant exchange rate . Revenue from tenants on a Constant Currency basis is calculated by applying the average monthly currency rates from prior comparable period to Revenues from tenants from the applicable period . We believe that this measure provides investors with information about revenue results and trends that eliminates currency volatility while increasing the comparability of our underlying results and trends .
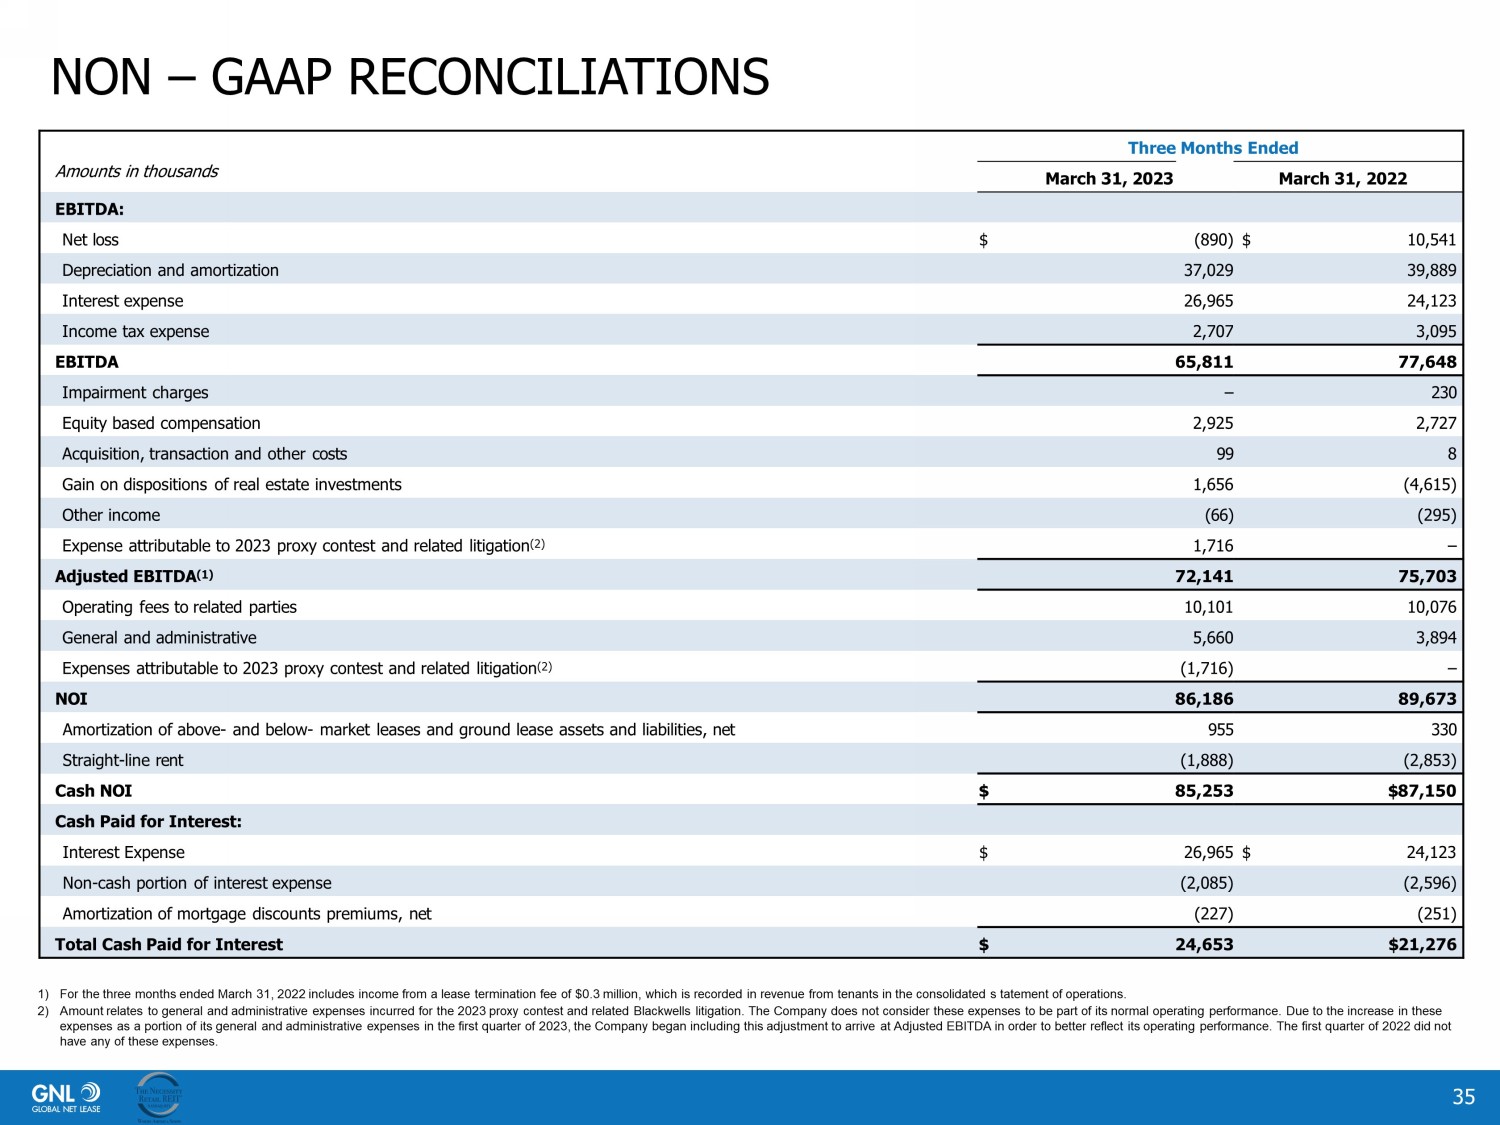
NON – GAAP RECONCILIATIONS 35 1) For the three months ended March 31, 2022 includes income from a lease termination fee of $0.3 million, which is recorded in rev enue from tenants in the consolidated s tatement of operations. 2) Amount relates to general and administrative expenses incurred for the 2023 proxy contest and related Blackwells litigation. The Company does not consider these expenses to be part of its normal operating performance. Due to the increase in these expenses as a portion of its general and administrative expenses in the first quarter of 2023, the Company began including th is adjustment to arrive at Adjusted EBITDA in order to better reflect its operating performance. The first quarter of 2022 did n ot have any of these expenses. Amounts in thousands Three Months Ended March 31, 2023 March 31, 2022 EBITDA: Net loss $ (890) $ 10,541 Depreciation and amortization 37,029 39,889 Interest expense 26,965 24,123 Income tax expense 2,707 3,095 EBITDA 65,811 77,648 Impairment charges – 230 Equity based compensation 2,925 2,727 Acquisition, transaction and other costs 99 8 Gain on dispositions of real estate investments 1,656 (4,615) Other income (66) (295) Expense attributable to 2023 proxy contest and related litigation (2) 1,716 – Adjusted EBITDA (1) 72,141 75,703 Operating fees to related parties 10,101 10,076 General and administrative 5,660 3,894 Expenses attributable to 2023 proxy contest and related litigation (2) (1,716) – NOI 86,186 89,673 Amortization of above - and below - market leases and ground lease assets and liabilities, net 955 330 Straight - line rent (1,888) (2,853) Cash NOI $ 85,253 $ 87,1 5 0 Cash Paid for Interest: Interest Expense $ 26,965 $ 24,123 Non - cash portion of interest expense (2,085) (2,596) Amortization of mortgage discounts premiums, net (227) (251) Total Cash Paid for Interest $ 24,653 $ 21,276

NON – GAAP RECONCILIATIONS 36 (Amounts in thousands) Three Months Ended March 31, 2023 March 31, 2022 Funds from operations (FFO): Net (loss) income attributable to common stockholders (in accordance with GAAP) $ (5,989) $ 5,483 Impairment charges – 230 Depreciation and amortization 37,029 39,889 FFO (as defined by NAREIT) attributable to stockholders (1) 31,040 45,602 Acquisition, transaction and other costs 99 8 Core FFO attributable to stockholders (1) 31,139 45,610 Non - cash equity based compensation 2,925 2,727 Non - cash portion of interest expense 2,085 2,596 Amortization related to above - and below - market lease intangibles and right - of - use assets, net 955 330 Straight - line rent (1,888) (2,853) Straight - line rent (rent deferral agreement) (2) – (120) Eliminate unrealized gains on foreign currency transactions (3) 2,647 (4,210) Amortization of mortgage discounts 227 251 Expenses attributable to 2023 proxy contest and related litigation (4) 1,716 – Adjusted funds from operations (AFFO) attributable to stockholders (1) $ 39,806 $ 44,331 Basic weighted - average shares outstanding 103,783 103,596 Diluted weighted - average shares outstanding 103,7 8 3 103,596 Net (loss) income per share attributable to common stockholders $ (0.06) $ 0.05 FFO per shar e $ 0.30 $ 0.44 Core FFO per share $ 0.30 $ 0.44 AFFO per share $ 0.38 $ 0.43 Dividends declared $ 41,677 $ 41,566 Revenue from tenants - Quarter Ended March 31, 2023 $ 94,332 Foreign currency translation impact (using average foreign currency exchange rates for the first quarter of 2022) 3,176 Revenue from Tenants (year over year constant currency adjusted): $ 97,508 Amounts in thousands 1) FFO, Core FFO and AFFO for the three months ended March 31, 2022 include income from a lease termination fee of $0.3 million, wh ich is recorded in revenue from tenants in the consolidated statement of operations. The termination fee of approximately $9.0 million which was paid by the ten ant at the end of the lease term on January 4, 2022 was earned and record ed as income evenly over the period from September 3, 2021 through January 4, 2022. 2) Represents amounts related to deferred rent pursuant to lease negotiations which qualify for FASB relief for which rent was d efe rred but not reduced. These amounts are included in the straight - line rent receivable on our balance sheet but are considered to be earned revenue attributed to the current period for rent that was deferred, for purposes of AFFO, as they are expected to be collected. Accordingly, when the deferred amounts are collected, t he amounts reduce AFFO. As of March 31, 2023, the Company has collected all previously deferred rents. 3) For AFFO purposes, we add back unrealized (gain) loss. For the three months ended March 31, 2023, the loss on derivative instruments was $1.7 million which consisted of unrealized losses of $2.6 million and realized gains of $0.9 million. For the th ree months ended March 31, 2022, the gain on derivative instruments was $4.6 million which consisted of unrealized gains of $4 .2 million and realized gains of $0.4 million. 4) Amount relates to general and administrative expenses incurred for the 2023 proxy contest and related Blackwells litigation. The Company does not consider these expenses to be part of its normal operating performance and has, accordingly, increased its AFFO for this amount.
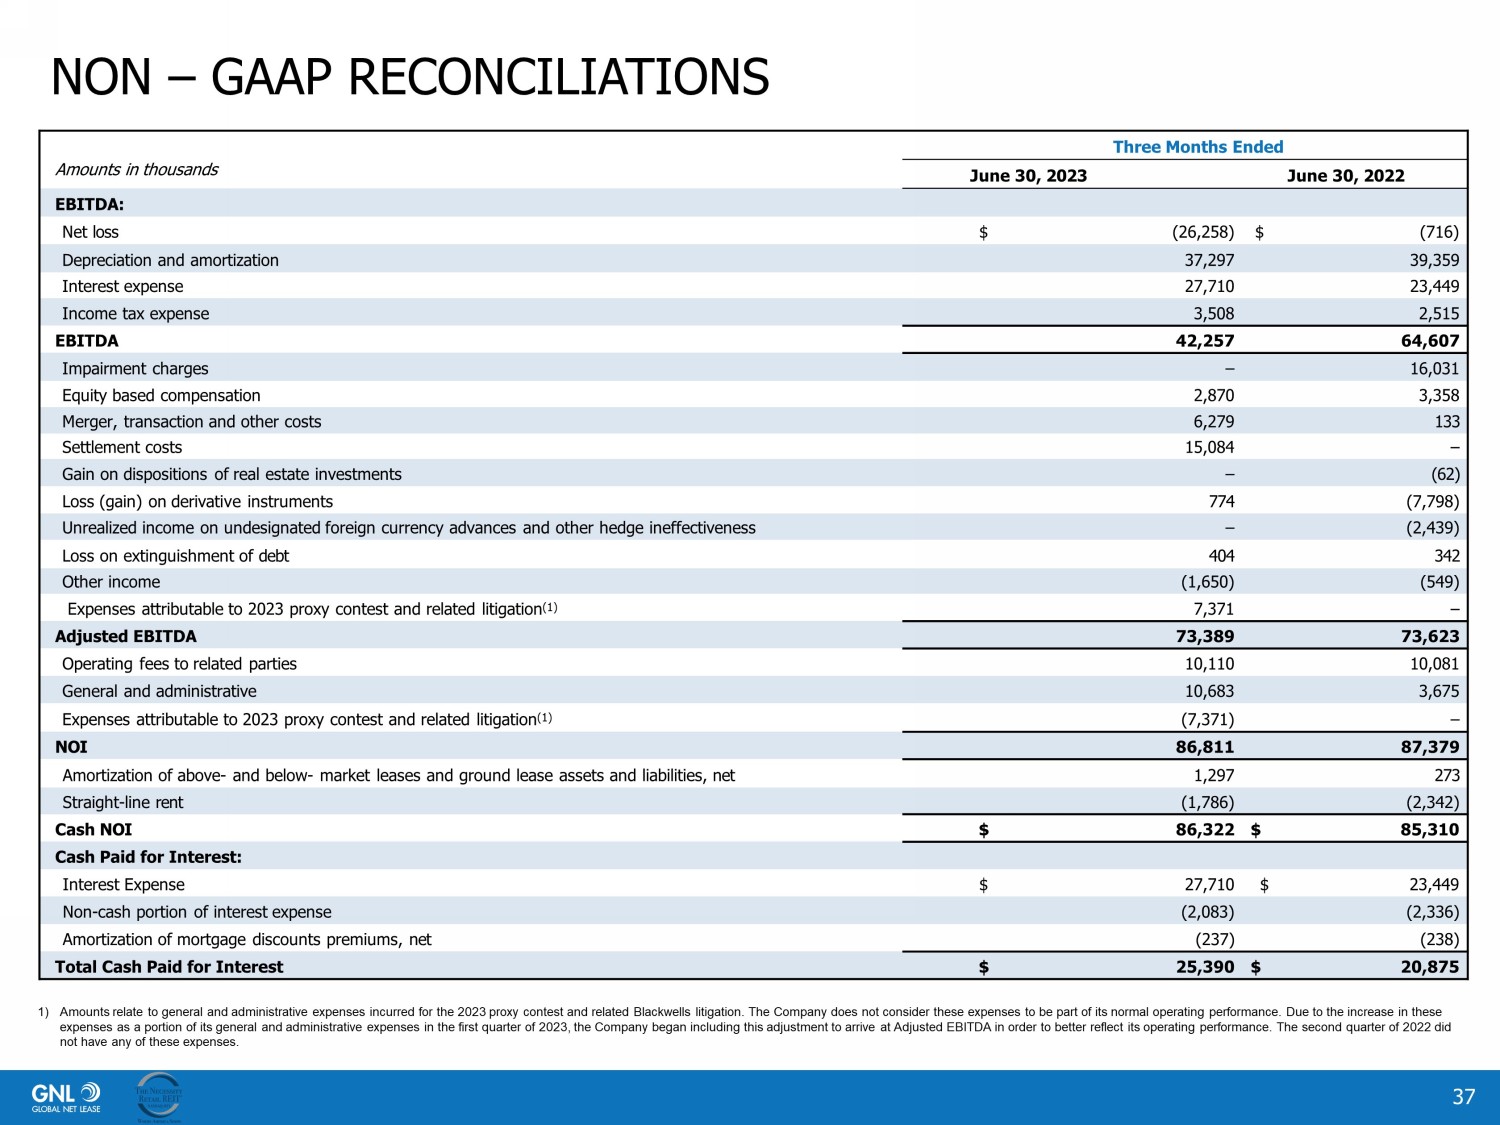
NON – GAAP RECONCILIATIONS 37 1) Amounts relate to general and administrative expenses incurred for the 2023 proxy contest and related Blackwells litigation. The Company does not consider these expenses to be part of its normal operating performance. Due to the increase in these expenses as a portion of its general and administrative expenses in the first quarter of 2023, the Company began including th is adjustment to arrive at Adjusted EBITDA in order to better reflect its operating performance. The second quarter of 2022 did not have any of these expenses. Amounts in thousands Three Months Ended June 30 , 2023 June 30 , 2022 EBITDA: Net loss $ (26,258) $ (716) Depreciation and amortization 37,297 39,359 Interest expense 27,710 23,449 Income tax expense 3,508 2,515 EBITDA 42,257 64,607 Impairment charges – 16,031 Equity based compensation 2,870 3,358 Merger, transaction and other costs 6,279 133 Settlement costs 15,084 – Gain on dispositions of real estate investments – (62) Loss (gain) on derivative instruments 774 (7,798) Unrealized income on undesignated foreign currency advances and other hedge ineffectiveness – (2,439) Loss on extinguishment of debt 404 342 Other income (1,650) (549) Expenses attributable to 2023 proxy contest and related litigation (1) 7,371 – Adjusted EBITDA 73,389 73,623 Operating fees to related parties 10,110 10,081 General and administrative 10,683 3,675 Expenses attributable to 2023 proxy contest and related litigation (1) (7,371) – NOI 86,811 87,379 Amortization of above - and below - market leases and ground lease assets and liabilities, net 1,297 273 Straight - line rent (1,786) (2,342) Cash NOI $ 86,322 $ 85,310 Cash Paid for Interest: Interest Expense $ 27,710 $ 23,449 Non - cash portion of interest expense (2,083) (2,336) Amortization of mortgage discounts premiums, net (237) (238) Total Cash Paid for Interest $ 25,390 $ 20,875
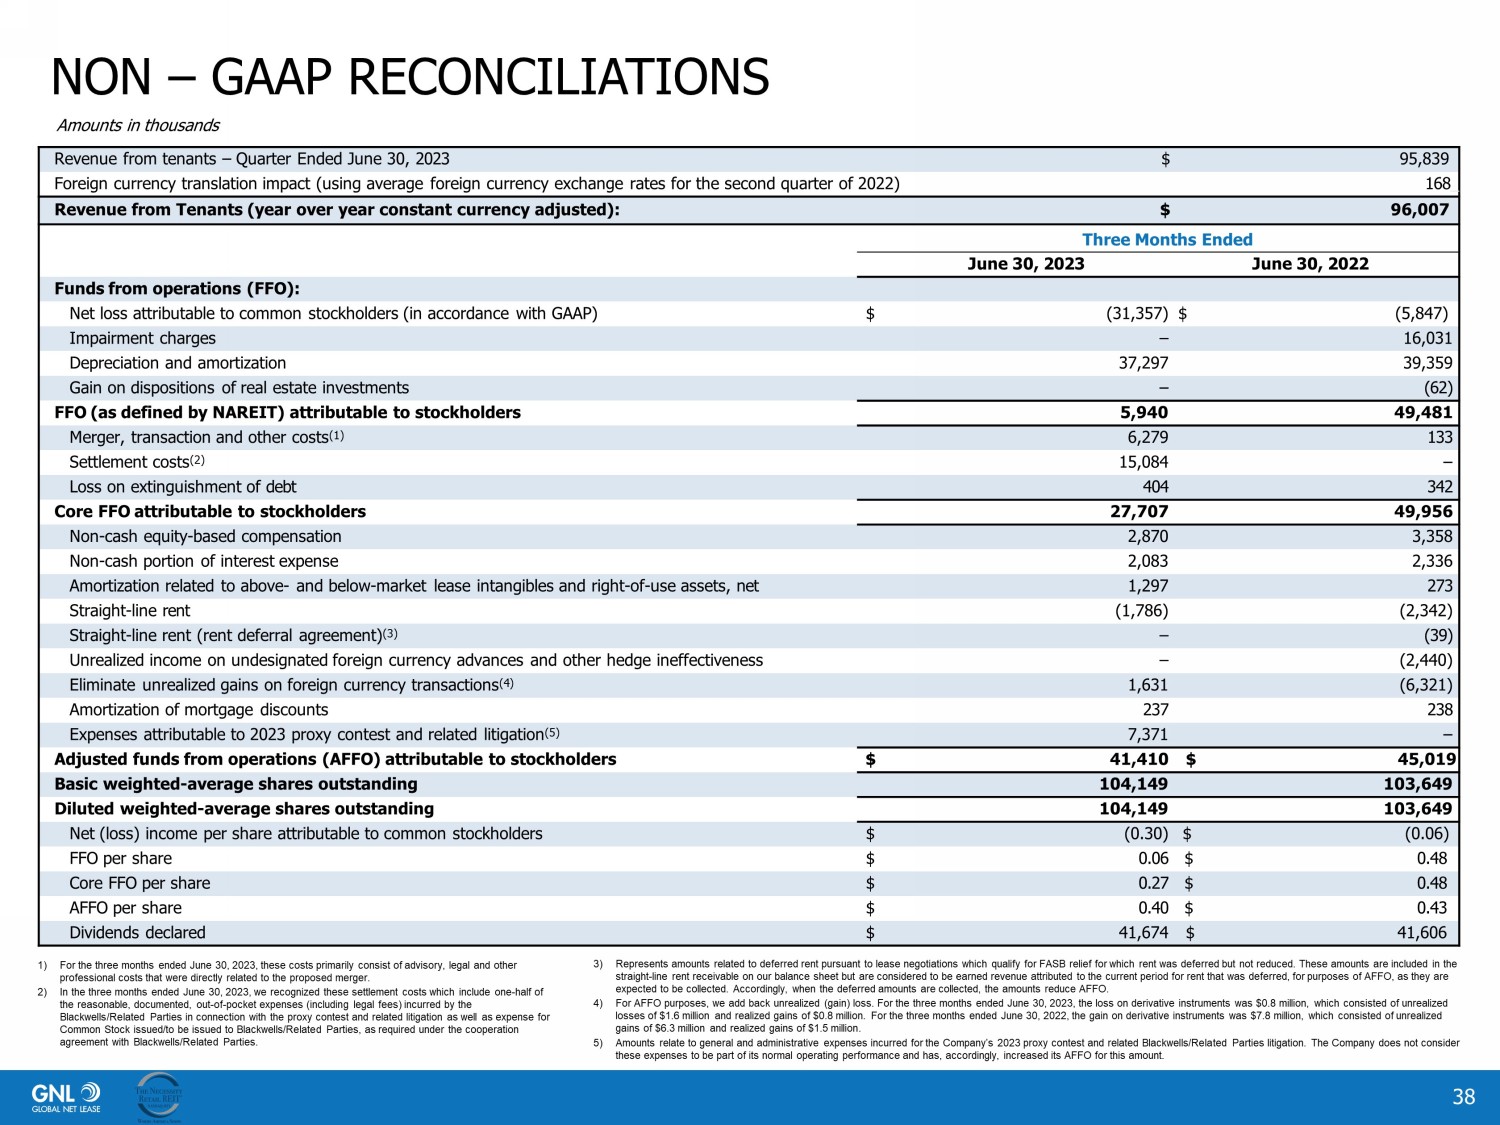
NON – GAAP RECONCILIATIONS 38 Revenue from tenants – Quarter Ended June 30, 2023 $ 95,839 Foreign currency translation impact (using average foreign currency exchange rates for the second quarter of 2022) 168 _ Revenue from Tenants (year over year constant currency adjusted): $ 96,007 Three Months Ended June 30, 2023 June 30, 2022 Funds from operations (FFO): Net loss attributable to common stockholders (in accordance with GAAP) $ (31,357) $ (5,847) Impairment charges – 16,031 Depreciation and amortization 37,297 39,359 Gain on dispositions of real estate investments – (62) FFO (as defined by NAREIT) attributable to stockholders 5,940 49,481 Merger, transaction and other costs (1) 6,279 133 Settlement costs (2) 15,084 – Loss on extinguishment of debt 404 342 Core FFO attributable to stockholders 27,707 49,956 Non - cash equity - based compensation 2,870 3,358 Non - cash portion of interest expense 2,083 2,336 Amortization related to above - and below - market lease intangibles and right - of - use assets, net 1,297 273 Straight - line rent (1,786) (2,342) Straight - line rent (rent deferral agreement) (3) – (39) Unrealized income on undesignated foreign currency advances and other hedge ineffectiveness – (2,440) Eliminate unrealized gains on foreign currency transactions (4) 1,631 (6,321) Amortization of mortgage discounts 237 238 Expenses attributable to 2023 proxy contest and related litigation (5) 7,371 – Adjusted funds from operations (AFFO) attributable to stockholders $ 41,410 $ 45,019 Basic weighted - average shares outstanding 104,149 103,649 Diluted weighted - average shares outstanding 104,149 103,649 Net (loss) income per share attributable to common stockholders $ (0.30) $ (0.06) FFO per share $ 0.06 $ 0.48 Core FFO per share $ 0.27 $ 0.48 AFFO per share $ 0.40 $ 0.43 Dividends declared $ 41,674 $ 41,606 Amounts in thousands 1) For the three months ended June 30, 2023, these costs primarily consist of advisory, legal and other professional costs that were directly related to the proposed merger. 2) In the three months ended June 30, 2023, we recognized these settlement costs which include one - half of the reasonable, documented, out - of - pocket expenses (including legal fees) incurred by the Blackwells/Related Parties in connection with the proxy contest and related litigation as well as expense for Common Stock issued/to be issued to Blackwells/Related Parties, as required under the cooperation agreement with Blackwells/Related Parties. 3) Represents amounts related to deferred rent pursuant to lease negotiations which qualify for FASB relief for which rent was d efe rred but not reduced. These amounts are included in the straight - line rent receivable on our balance sheet but are considered to be earned revenue attributed to the current period for rent that was deferred, for purposes of AFFO, as they are expected to be collected. Accordingly, when the deferred amounts are collected, the amounts reduce AFFO. 4) For AFFO purposes, we add back unrealized (gain) loss. For the three months ended June 30, 2023, the loss on derivative instr ume nts was $0.8 million, which consisted of unrealized losses of $1.6 million and realized gains of $0.8 million. For the three months ended June 30, 2022, the gain on derivative i nst ruments was $7.8 million, which consisted of unrealized gains of $6.3 million and realized gains of $1.5 million. 5) Amounts relate to general and administrative expenses incurred for the Company’s 2023 proxy contest and related Blackwells/Re lat ed Parties litigation. The Company does not consider these expenses to be part of its normal operating performance and has, accordingly, increased its AFFO for this amount.

GNL CORPORATE HEADQUARTERS | 650 FIFTH AVENUE 30TH FLOOR NEW YORK, NY 10019 CONTACT Investor Relations investorrelations@globalnetlease.com
Global Net Lease (NYSE:GNL-B)
Historical Stock Chart
Von Apr 2024 bis Mai 2024

Global Net Lease (NYSE:GNL-B)
Historical Stock Chart
Von Mai 2023 bis Mai 2024
