€2.2 billion of operating Free Cash Flow in
2014, the Group is net debt free
Regulatory News:
PSA Peugeot Citroën (Paris:UG):
- €53.6 billion in revenue for the
year1
- Recurring Operating Income of €905
million, up €1.3 billion, from a loss of €-364 million in
2013
- Favourable swing attributable to the
Automotive division, which ended the year with recurring operating
income at €63 million, up €1.1 billion from a loss of -€1,039
million in 2013
"Our 2014 results show evidence that the process of rebuilding
the Group's financial fundamentals is underway," said Carlos
Tavares, Chairman of the PSA Peugeot Citroën Managing Board. “By
generating €2.2 billion in operating Free Cash Flow2 during the
year, and becoming net debt free, we are ahead of our
reconstruction plan. I would like to thank all of our teams for
their achievements in a sometimes difficult environment. More than
ever, we remain focused on fully meeting our objectives and
achieving a 2% operating margin for the Automotive division."
Consolidated net revenue came to €53,607 million in 2014,
up 1% over 2013. Automotive division revenue dipped 0.9% to
€36,085 million, with favourable changes in the product mix and in
prices offsetting a very negative currency effect.
The Group ended the year with a Recurring Operating
Income ok €905 million, representing a positive swing of €1,269
million from a loss of -€364 million in 2013. The Automotive
division reported Recurring Operating Income of €63
million in 2014, up €1,102 million from a loss of €1,039 million
the year before. The return to profit was attributable to the
positive product and price mix resulting from the success of recent
launches by the brands and from the pricing power policy. It was
also supported by further reductions in fixed costs.
Including its pro forma share of the 2014 income of the DPCA and
CAPSA joint ventures, the Division's recurring operating income
came to €366 million, an improvement of €1,246 million over the
previous year.
Non-recurring operating income and expenses represented a
net expense of -€682 million, primarily due to restructuring costs
incurred by the Automotive division.
Financial income and expenses represented a net
financial expense of -€763 million compared with- €664 million
in 2013, with the year-on-year change corresponding mainly to the
non-recurring gain realised in 2013 on the sale of BNP Paribas
shares.
The Group's net loss eased to -€555 million in 2014 up
€1,672 million from -€2,227 million the year before.
Banque PSA Finance's recurring operating income came to
€337 million, a decline of -€31 million year-on-year that was due
to changes in the Bank's refinancing situation. In February 2015,
the first two joint ventures with Santander Consumer Finance were
launched, one in France and the other in the United Kingdom. These
new entities will enable Banque PSA Finance to offer competitive
interest rates to customers of the Peugeot, Citroën and DS brands
while at the same time improving its margins. The start-up of
operations by these new ventures also enabled Banque PSA Finance to
announce that it would no longer be using the French State's
guarantee for its future bond issues.
1 Income statement figures for 2013 and 2014 have been restated
to exclude the impact of applying IFRS 5,10 and 11 and IFRIC
21.
2 Free cash flow of manufacturing and sales companies
Faurecia's recurring operating income amounted to
€673 million, up 25% on 2013.
Free cash flow of manufacturing and sales companies for
the year amounted to €1,792 million, lifted by the improvement in
funds from operations and working capital requirement (up €1,752
million over the period) thanks mainly to the inventory reduction
action plans and supply chain optimisation. Excluding restructuring
costs of €583 million and net non-recurring income of €193 million
(mainly corresponding to gains on sales of property assets),
operating Free Cash Flow was a positive €2,182 million.
Total inventory, including independent dealers, stood at 339,100
vehicles at 31 December 2014, down 44,800 units from end-2013.
The manufacturing and sales companies' net financial
position at 31 December 2014 was a positive €548 million,
versus a negative €4,181 million at the previous year-end,
reflecting the €2,995-million proceeds from the April and May 2014
share issues as well as the increase in Free Cash Flow.
As the rebuilding of the Group's financial fundamentals is not
achieved, no dividend payment will be proposed for the financial
year 2014.
Outlook
In 2015, PSA Peugeot Citroën expects to see automotive demand
increase by a modest 1% in Europe and by approximately 7% in China,
but decline by some 10% in Latin America and by around 30% in
Russia.
The Group aims to generate operating free cash flow of around €2
billion over the period 2015-2017. It is also targeting an
operating margin3 of 2% in 2018 for the Automotive division, with
the objective of reaching 5% over the period of the next
medium-term plan, covering 2019-2023.
Financial Calendar
- 29 April 2015: First-quarter 2015
revenues
The PSA Peugeot Citroën Group's consolidated
financial statements for the year ended 31 December 2014 were
approved by the Managing Board on 10 February 2015 and reviewed by
the Supervisory Board on 17 February 2015. The Group's Statutory
Auditors have completed their audit and are currently issuing their
report on the consolidated financial statements.
About PSA Peugeot Citroën
With its three world-renowned brands, Peugeot, Citroën and DS,
PSA Peugeot Citroën sold 3 million vehicles worldwide in 2014. The
second largest carmaker in Europe, PSA Peugeot Citroën recorded
sales and revenue of €54 billion in 2014. The Group confirms its
position of European leader in terms of CO2 emissions, with an
average of 110.3 grams of CO2/km in 2014. PSA Peugeot Citroën has
sales operations in 160 countries. It is also involved in financing
activities (Banque PSA Finance) and automotive equipment
(Faurecia).
For more information, please visit psa-peugeot-citroen.com
3 Recurring operating income relating to revenues
Appendices
Comparative information has been restated to reflect the
application of IFRS 5, 10 and 11 and IFRIC 21.
Recurring Operating Income including Banque PSA
Finance*
2013. 2014.
Manufacturing and
Manufacturing and Finance (in
millions of euros)
Sales Companies Finance
Companies Eliminations
TOTAL
Sales Companies Companies Eliminations
TOTAL Revenues 52,459 1,773
(310)
53,922 53,019 1,703 (363)
54,359 Recurring operating income/(loss) (516)
369 -
(147) 779 337
-
1,116 Non-recurring operating
income/(expense) (1,165) - -
(1,165) (679) (2) (0)
(681) Operating Income/(loss) (1,681) 369
-
(1,312) 100 335 0
435
*Following the announcement of the partnership with Santander,
the Banque PSA Finance operations intended to be transferred to the
partnership vehicles have been excluded from consolidated recurring
operating income for 2014. This table shows consolidated recurring
operating income as if all Banque PSA Finance operations were still
fully consolidated.
Consolidated Income Statement
2013 2014 (in millions of euros)
Manufacturing andSales
Companies
Finance Companies Eliminations
TOTAL
Manufacturing andSales
Companies
Finance Companies Eliminations
TOTAL Revenues 52,459 668 (48)
53,079 53,019 628 (40)
53,607 Recurring operating income/(loss) (516)
152 -
(364) 779 126 -
905 Operating Income/(loss) (1,681) 152
-
(1,529) 100 123 -
223 Net financial expense (664) -
-
(664) (755) (8) -
(763) Income taxes (266) (40) -
(306) (226) (87)
(313) Share in net earnings of companies at equity
165 8 -
173 270 12
-
282 Net income/(loss) from operations intended to
be transferred to new joint ventures (19) 118
-
99 (34) 50 -
16
Consolidated profit/(loss) (2,465) 238 -
(2,227) (645) 90 -
(555) Group share (2,556) 223 6
(2,327) (787) 86 (5)
(706) Attributable to minority interests 91 15
(6)
100 142 4 5
151 (in euros)
Basic earnings per €1 par value share
Group share
(6,80)
(1,15)
Consolidated Balance Sheet
Assets
31 December 2013 31 December
2014 (in millions of euros)
Manufacturing andSales
Companies
Finance Companies Eliminations
TOTAL
Manufacturing andSales
Companies
Finance Companies Eliminations
TOTAL Total non-current assets 19,709 389
(1)
20,097 20,331 279 (5)
20,605 Total current assets 15,524
24,668 (568)
39,624 16,526 6,209
(704)
22,031 Total assets intended to be
transferred to new joint ventures 43 - -
43 167 18,529 (120)
18,576 TOTAL ASSETS
35,276
25,057 (569) 59,764
37,024 25, 017 (829)
61,212 EQUITY AND LIABILITIES
31 December 2013
31 December 2014 (in millions of euros)
Manufacturing andSales
Companies
Finance Companies Eliminations
TOTAL
Manufacturing andSales
Companies
Finance Companies Eliminations
TOTAL Total equity
7,837
10,418 Total non-current liabilities 12,622
364 (1)
12,985 11,637 2
(1)
11,638 Total current liabilities
18,109 21,401 (568)
38,942
18,071 13,368 (537)
30,903 Liabilities
intended to be transferred to new joint ventures - -
- - 37 8,508 (292)
8,253 TOTAL EQUITY & LIABILITIES
59,764
61,212
Consolidated Statement of Cash Flows
2013 2014 (in millions of euros)
Manufacturing andSales
Companies
Finance Companies Eliminations
TOTAL
Manufacturing andSales
Companies
Finance Companies Eliminations
TOTAL Consolidated profit/(loss) from continuing
operations (2,446) (128)
- (2,547) (611)
(211) - (822) Funds from
operations 804 (21) -
783 2,126 13
- 2,139 Net cash from/(used in) operating
activities 1,244 (478) (9) 757
3,878 448 (262) 4,064 Net cash used in
investing activities of continuing operations (2,474)
(33) - (2,507) (2,314) (22) -
(2,336) Net cash from/(used in) financing activities of
continuing operations 2,058 (153) -
1,905 675 3 334 1,012
Net cash used
by new borrowings and repayments of borrowings of finance
operations not transferred to new joint ventures
- (2,294) -
(2,294) - (1,448)
- (1,448) Net cash from/(used by) changes
in assets and liabilities of finance operations intended to be
transferred to new joint ventures (72)
3,099 74 3,101
(20) 1,817 10
1,807 Effect of changes in exchange rates (91)
(6) 4 (93) 47 1 - 48
Increase/(decrease) in cash and cash equivalents of continuing
operations and operations intended to be transferred to new joint
ventures 665 135 69
869 2,266 799
82 3,147 Net cash and cash equivalents at
beginning of period 5,496 1,669 (279)
6,886 6,161 1,804 (210) 7,755
Net
cash and cash equivalents at end of period – continuing
operations 6,161 1,804
(210) 7,755 8,427
2,603 (128) 10,902
PSA Peugeot CitroënMedia RelationsJean-Baptiste Thomas,
+33 (0) 1 40 66 47 59jean-baptiste.thomas@mpsa.comorPierre-Olivier
Salmon, +33 (0) 1 40 66 49 94pierreolivier.salmon@mpsa.comorAntonia
Krpina, +33 (0) 1 40 66 58 54antonia.krpina@mpsa.comorInvestor
RelationsFrédéric Brunet, +33 (0) 1 40 66 42
59frederic.brunet@mpsa.comorAnne-Laure Desclèves, +33 (0) 1 40 66
43 65annelaure.descleves@mpsa.comorKarine Douet, +33 (0) 1 40 66 57
45karine.douet@mpsa.com
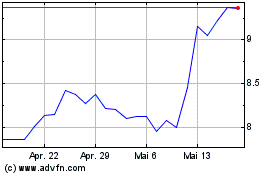
United Guardian (NASDAQ:UG)
Historical Stock Chart
Von Jun 2024 bis Jul 2024

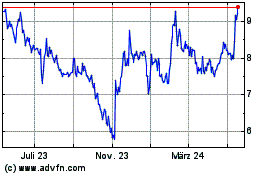
United Guardian (NASDAQ:UG)
Historical Stock Chart
Von Jul 2023 bis Jul 2024
