| Company name: | FTSE 100 Daily Leveraged RT TR Index |
| EPIC: | UKXL2X | Trading Currency: | EUR |
| Market Sector: | | ISIN: | |
| Market Segment: | | Share Type: | IX |
| WWW Address: | | Description: | |
| Industry Sector: | |
| Price | Price Change [%] | Bid | Offer | Eröffn. | Hoch | Low | Volume |
| 40,089.99 |  287.23 [0.72] 287.23 [0.72] | - | - | 39,802.76 | 40,490.80 | 39,796.87 | - |
| Market Cap. [m] | Shares In Issue [m] | Beta | EPS | DPS | PE Ratio | Yield | 52-Wks-Range |
| - | - | - | - | - | - | - | 41,180.11 - 29,710.91 |

FTSE 100 Daily Leveraged... Key Figures| Key Figures | | (at previous day's close) |
| Market Cap. | - | m |
| Shares In Issue | - | m |
| Prev. Close | 39,802.76 | |
| PE Ratio | - | |
| Dividend Yield | - | % |
| EPS - basic | - | ¢(€) |
| Dividend PS | - | ¢(€) |
| Dividend Cover | - | |
| Cash Flow PS | - | ¢(€) |
| Return On Equity (ROE) | - | % |
| Operating Margin | - | % |
| PEG Factor | - | |
| EPS Growth Rate | - | % |
| Dividends PS Growth Rate | - | % |
| Net Debt | - | m |
| Gross Gearing | - | % |
| Quick Assets | - | m |
| Net Working Capital | - | m |
| Intangibles / Fixed Assets | - | % |
| Turnover PS | - | ¢(€) |
| Pre-Tax Profit PS | - | ¢(€) |
| Retained Profit PS | - | ¢(€) |
| Cash PS | - | ¢(€) |
| Net Cash PS | - | ¢(€) |
| Net Tangible Asset Value PS * | - | ¢(€) |
| Net Asset Value PS | - | ¢(€) |
| Spread | - (-%) | |
| * Calculation based on Ordinary Capital figure as contained in last annual report, and the most recent shares in issue figure. Therefore the ratio might be exposed to inaccuracies. |
|
FTSE 100 Daily Leveraged... Balance Sheet| %1$s Balance Sheet | | Sorry No Data Available |
|
Share Price Performance| Share Price Performance | | Sample Period † | Hoch | Low | | 1 Woche | 41,180.11 | 38,943.55 |
| 4 Wochen | 41,180.11 | 37,784.11 |
| 12 Wochen | 41,180.11 | 33,323.45 |
| 1 Jahr | 41,180.11 | 29,710.91 |
Share Price Chart (5 years)| Share Price Chart (5 years) | 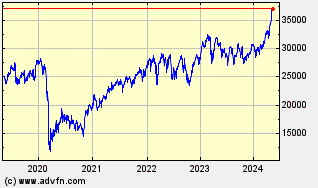 |
|
FTSE 100 Daily Leveraged... Historic Returns| %1$s Historic Returns | | Zeitraum † | Eröffn. | Änderung heute | % | Eröffn. i.D. | Tagesvol. i.D. [m] | Gesamtvol. [m] | VWAP | | 1 Woche | 38,949.31 | 1,140.68 | 2.93 | 38,943.55 | - | | - |
| 4 Wochen | 37,970.26 | 2,119.73 | 5.58 | 37,784.11 | - | | - |
| 12 Wochen | 35,687.98 | 4,402.01 | 12.33 | 33,323.45 | - | | - |
| 26 Wochen | 35,764.72 | 4,325.27 | 12.09 | 33,264.11 | - | | - |
| 1 Jahr | 30,040.35 | 10,049.64 | 33.45 | 29,710.91 | - | | - |
| 3 Jahre | 23,891.76 | 16,198.23 | 67.80 | 22,532.96 | - | | - |
| 5 Jahre | 22,403.07 | 17,686.92 | 78.95 | 11,280.82 | - | | - |
| † periods calculated are whole weeks rather than calendar months | |
|
FTSE 100 Daily Leveraged... Key Management Ratios
|
FTSE 100 Daily Leveraged... Investment Ratios| %1$s Investment Ratios | | (Market value analysis) at previous day's close |
| PQ Ratio | - | |
| PE Ratio | - | |
| Tobin's Q Ratio | - | |
| Tobin's Q Ratio (excl. intangibles) | - | |
| Dividend Yield | - | % |
| Market-to-Book Ratio | - | |
| Price-to-Pre-Tax Profit PS | - | |
| Price-to-Retained Profit PS | - | |
| Price-to-Cash Flow PS | - | |
| Price-to-Sales PS | - | |
| Price-to-Net Tangible Asset Value PS | - | |
| Price-to-Cash PS | - | |
| Net Working Capital PS | - | |
| Price Pct to Working Capital PS | - | % |
| Earnings Yield | - | % |
| Average PE | - | |
| Years in average | - | |
| PE to PE average | - | % |
|
FTSE 100 Daily Leveraged... Financial Ratios| %1$s Financial Ratios | | (Leverage Ratios) |
| Debt Ratio | - | % |
| Debt-to-Equity Ratio | - | |
| Debt-to-Equity Ratio (excl. Intgbl) | - | |
| Debt-to-Equity Market Value | - | |
| Net Gearing | - | % |
| Net Gearing (excl. Intangibles) | - | % |
| Gross Gearing | - | % |
| Gross Gearing (excl. Intangibles) | - | % |
| Gearing Under 1 Year | - | % |
| Gearing Under 1 Year (excl. Intgbl) | - | % |
| Assets/Equity | - | |
| Cash/Equity | - | |
| (Liquidity Ratios) |
| Net Working Capital to Total Assets | - | % |
| Current Ratio | - | |
| Quick Ratio (Acid Test) | - | |
| Liquidity Ratio | - | |
| Cash & Equiv/Current Assets | - | % |
| (Solvency Ratios) |
| Enterprise Value | - | m |
| CFO/Sales | - | |
| CFO/Attributable Profit | - | |
| CFO/Assets | - | |
| CFO/Debt | - | |
| Total Debt/Equity Market Value | - | |
| Total Debt/Sales | - | |
| Total Debt/Pre-Tax Profit | - | |
| Total Debt | - | m |
| Total Debt/Net Current Assets | - | % |
| (Dodds - Graham Ratios) | | |
| 3 yr Compound Earnings Growth | - | % |
| 5 yr Compound Earnings Growth | - | % |
| 10 yr Compound Earnings Growth | - | % |
| Earn drops > 5% in 10yrs | - | |
| Beta coefficients | | Beta (60-Mnth) | Beta (36-Mnth) | | Sorry No Data Available | Sorry No Data Available |
|
FTSE 100 Daily Leveraged... Operating Ratios| %1$s Operating Ratios | | (Profitability Ratios) |
| Return On Capital Employed (ROCE) | - | % |
| Return On Assets (ROA) | - | % |
| Net Profit Margin | - | % |
| Assets Turnover | - | |
| Return On Equity (ROE) | - | % |
| Return On Investment (ROI) | - | % |
| Dividend Payout Ratio | - | % |
| Plowback Ratio | 100.00 | % |
| Growth from Plowback Ratio | - | % |
| Net Income Of Revenues | - | % |
| (Asset Utilisation Multiples) |
| Shareholders Equity Turnover | - | |
| Fixed Assets Turnover | - | |
| Current Assets Turnover | - | |
| Net Working Capital Turnover | | |
| Inventory Turnover | - | |
| (Other Operating Ratios) |
| Total Assets-to-Sales | - | |
| Debtors-to-Sales | - | % |
| Debt Collection Period | - | Tage |
|
FTSE 100 Daily Leveraged... Dividends
|
|
FTSE 100 Daily Leveraged... Fundamentals |
|
|
FTSE 100 Daily Leveraged... Balance Sheet
|
FTSE 100 Daily Leveraged... Cash Flow Statement
| FTSE 100 Daily Leveraged... Brokers| Broker infomation is not available for this class of stock. |
| | | | | | | | |
|
|
|
