Cardano Price Bounces From Key Support Level, But There’s Still A Risk To Crash To $0.85
22 Januar 2025 - 5:30PM
NEWSBTC
Positive price action in the past 24 hours has seen Cardano (ADA)
rebounding upwards alongside the rest of the crypto market. The
entire market is up by 4.3% in the past 24 hours, a trend that has
seen the Cardano price also breaking above the $1 mark again.
Interestingly, Cardano’s recent break above $1 comes just hours
after it bounced on a support zone around $0.92-$0.95. Despite this
break, technical analysis shows that there remains a risk of a
Cardano price crash in the short term. Key Support Zone Interaction
Near $0.92-$0.95 A technical analysis of Cardano’s 4-hour
candlestick chart, shared by crypto analyst melikatrader94 on
TradingView, highlights a compelling confluence as Cardano attempts
to regain upward momentum. The analysis identifies a support zone
near $0.92-$0.95, which coincides with an upward-sloping trendline
that has served as support for many weeks. Related Reading: Cardano
Price Eyes Breakout To $6 After Bouncing From 43% Drawdown
Cardano’s towards the support trendline is a notable decline after
its price reached a peak around $1.16 on January 17. Furthermore,
this reversal comes after the cryptocurrency experienced another
upswing that began when it rebounded from the same upward-sloping
trendline near $0.89 on January 13. These repeated interactions
with the trendline and the support zone show the volatility
surrounding Cardano’s price over the past days and the ongoing
battle between bullish and bearish market participants. Since the
analysis, Cardano has rebounded again just before reaching the
upward-sloping trendline and is now on an upward move. As noted by
the analyst, this move might push Cardano’s price back toward its
recent highs near $1.10. If this upward momentum is sustained, ADA
may also continue upwards until it reaches a key resistance zone
between $1.10 and $1.15. A successful breach of this level would
further reinforce the bullish outlook and the continuation of a
broader uptrend. Risk Of Breakdown Toward $0.85 Or Lower For
Cardano For the bullish scenario to play out, ADA needs to hold
firmly above the support zone and along the ascending trendline.
This alignment suggests a continuation of the upward trend that
Cardano has been following since late 2024. Secondly, Cardano bulls
would need to break above the resistance level highlighted between
$1.10 and $1.15 in order to flip the level into support on the
long-term. Related Reading: Possible Deep Correction Could Push
Cardano Price To $0.43, Here’s How However, the intense volatility
witnessed in the past few days opens up the possibility of a
failure to hold above these levels. With this, the analyst warned
that a decisive breakdown below the $0.92 level and the ascending
trendline would invalidate the bullish outlook. Such a move could
pave the way for a deeper correction and cause the Cardano price to
drop toward $0.85 or even lower. At the time of writing,
Cardano is trading at $1.02 and is up by 2% in the past 24 hours.
Featured image from Adobe Stock, chart from Tradingview.com
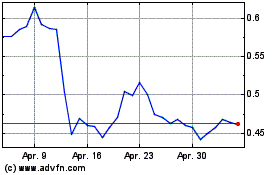
Cardano (COIN:ADAUSD)
Historical Stock Chart
Von Dez 2024 bis Jan 2025

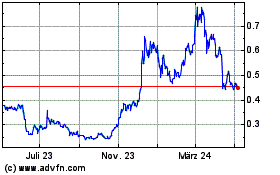
Cardano (COIN:ADAUSD)
Historical Stock Chart
Von Jan 2024 bis Jan 2025
