SECURITIES AND EXCHANGE COMMISSION
Washington, D.C. 20549
FORM 6-K
REPORT OF FOREIGN PRIVATE ISSUER PURSUANT
TO RULE 13A-16
OR 15D-16 OF THE SECURITIES EXCHANGE ACT OF 1934
For the month of February, 2024
(Commission File No. 1-14862 )
BRASKEM S.A.
(Exact Name as Specified in its Charter)
N/A
(Translation of registrant's name into English)
Rua Eteno, 1561, Polo Petroquimico de Camacari
Camacari, Bahia - CEP 42810-000 Brazil
(Address of principal executive offices)
Indicate by check mark whether the registrant
files or will file annual reports under cover Form 20-F or Form 40-F.
Form 20-F ___X___ Form 40-F ______
Indicate by check mark if the registrant is
submitting the Form 6-K
in paper as permitted by Regulation S-T Rule 101(b)(1). _____
Indicate by check mark if the registrant is
submitting the Form 6-K
in paper as permitted by Regulation S-T Rule 101(b)(7). _____
Indicate by check mark whether the
registrant by furnishing the information contained in this Form is also thereby furnishing the information to the Commission pursuant
to Rule 12g3-2(b) under the Securities Exchange Act of 1934.
Yes ______ No ___X___
If "Yes" is marked, indicate below
the file number assigned to the registrant in connection with Rule 12g3-2(b): 82- _____.

BRASKEM S.A.
Corporate Taxpayer ID (CNPJ):
42.150.391/0001-70
Company Registry: 29.300.006.939
Publicly Held Company
MATERIAL FACT
PRODUCTION & SALES
REPORT
FOURTH QUARTER 2023 AND
2023
São Paulo, February
19, 2024 – Braskem S.A. (“Braskem” or “Company”) reports to its shareholders and the market its Production
& Sales Report for the fourth quarter and fiscal year of 2023. Note that the information herein is based on preliminary data and
that figures were not revised by the Company's independent auditor.
For more information, contact
Braskem’s Investor Relations Department by calling +55 (11) 3576-9531 or emailing braskem-ri@braskem.com.br.
Contents
| 1. OPERATIONAL OVERVIEW 4T23 |
2 |
| 2. PERFORMANCE BY SEGMENT |
2 |
| 2.1 BRAZIL/SOUTH AMERICA |
2 |
| 2.2 UNITED STATES & EUROPE |
5 |
| 2.3 MEXICO |
6 |
| 3. PETROCHEMICAL SPREADS |
8 |
| 1. | OPERATIONAL OVERVIEW 4T23 |
During 4Q23, most petrochemical
spreads in the international market increased compared to the previous quarter, albeit at historically low levels due to the industry's
cycle moment. The main positive highlights are: (i) the PE-ethane spread, which increased by 10% in the period due to the reduction in
the ethane price on the international market, impacting positively Mexico’s and partially Brazil's spreads; and (ii) the increase
in US propylene price, which benefited the profitability of producers with flexibility in purchasing propylene.
In relation to the operational
performance, the utilization rates of the Company's industrial units and the industry in general remained below the historical average
due to the imbalance between global supply and demand. Additionally, the utilization rate in Brazil was impacted by the scheduled maintenance
shutdown at the Bahia Petrochemical Complex. On the other hand, the recovery of production levels in Mexico was a positive highlight of
the quarter, which an unscheduled shutdown in the previous quarter had impacted.
In this scenario, the sales
volumes of the segments were impacted mainly by: (i) the effect of seasonality; (ii) the destocking process in the United States transformation
chain; and (iii) the inventory management in the US & Europe and Mexico segments.
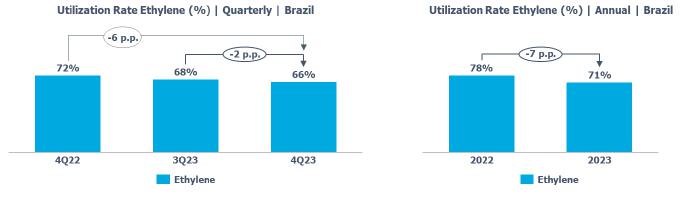
Average utilization
rate of petrochemical crackers: reduction in relation to 3Q23 (-2 p.p.) and 4Q22 (-6 p.p.) is explained by: (i) the scheduled maintenance
shutdown in the petrochemical complex in Bahia, which lasted around 50 days; (ii) lower feedstock availability at the São Paulo
petrochemical complex due scheduled maintenance shutdown of the domestic supplier; and (iii) the production adjustment face to lower global
demand.
Compared to 2022, the
average utilization rate of petrochemical crackers was lower (-7 p.p.) mainly due to: (i) the production adjustment during the year in
the face of global demand lower growth; and (ii) the scheduled maintenance shutdown in Bahia in 4Q23.
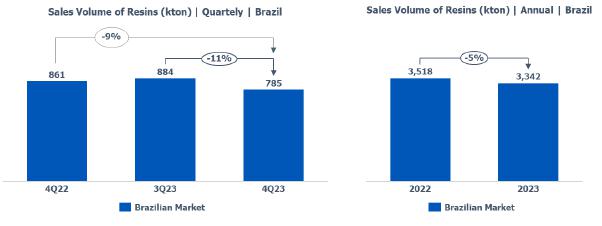
Resin sales volume:
in the Brazilian market, resin sales were lower in relation to 3Q23 (-11%), mainly explained by: (i) the prioritization of sales with
higher added value; and (ii) the seasonality of the period. In relation to 4Q22, resin sales volume in the Brazilian market decreased
(-9%) due to the higher PE sales volume in the last quarter of 2022 due to higher demand in that period.
In the annual comparison,
resin sales volume in the Brazilian market was lower (-5%), mainly given the higher supply of products in the international market combined
with the prioritization of sales with higher added value.
The resin exports in
4Q23 were higher when compared to 3Q23 (+2%) and 4Q23 (+8%), mainly due to the PE and PP opportunities in South America.
In relation to 2022,
resin exports were lower (-3%) due to higher inventories in the global chain, impacting the product demand in the period.

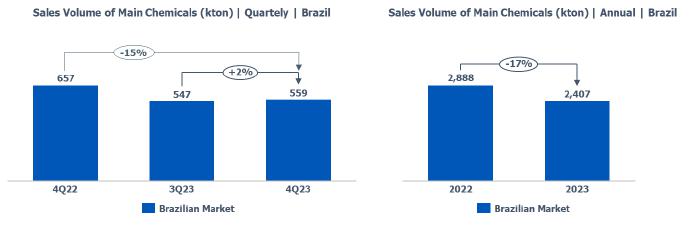
Main
chemicals sales volume [1]:
in the Brazilian market, main chemicals sales were higher than in 3Q23 (+2%) due to normalization in the production of some customers
who conducted their scheduled shutdowns over the last few months. In relation to 4Q22, the reduction (-15%) is mainly explained by: (i)
the scheduled shutdowns of customers in 4Q23, especially by paraxylene customers; (ii) lower styrene demand; and (iii) lower gasoline
sales volume in the Brazilian market.
In the year 2023, the
main chemicals sales in the Brazilian market were inferior to 2022 (-17%) mainly due to: (i) the lower spreads for main chemicals in the
international market due to the imbalance between supply and global demand; and (ii) lower gasoline sales volume due lower product availability
for sale.
The exports decreased
(-9%) compared to 3Q23 due to the lower availability of products for sale caused by the scheduled maintenance shutdown in the petrochemical
complex in Bahia. In relation to 4Q22, the increase (+10%) is explained by higher gasoline sales volume in the international market due
to better opportunities in the international fuels market.
In the annual comparison,
main chemicals exports were higher (+7%) due to the increase in gasoline, benzene, and toluene sales volume due to better opportunities
in the international market.

[1] Main chemicals
refer to: ethylene, propylene, butadiene, cumene, gasoline, benzene, toluene and paraxylene due to the representation of these products
in the segment’s net revenue.
Average
utilization rate of green ethylene [2]: decrease in relation to 3Q23 (-46 p.p.) and
4Q22 (-34 p.p.) mainly due to ethanol supply restrictions in December caused by climate conditions in the region.
Compared to 2022, the
utilization rate of green ethylene decreased (-26 p.p.) due to the scheduled shutdown and the conclusion of the operations ramp-up process
of the expansion project by 30% of the production capacity of the green ethylene unit in Rio Grande do Sul complex.

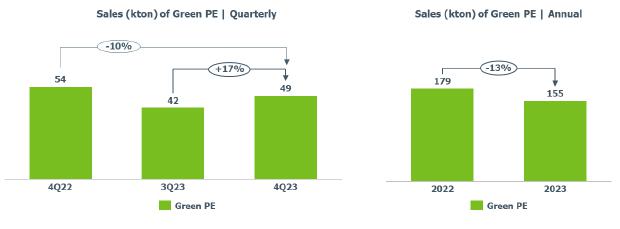
Green PE
sales volume: increase compared to 3Q23 (+17%) mainly explained by: (i) the higher availability
of product for sale due to the Green PE inventory replenishment process, after completion of the green ethylene production capacity expansion
project; and (ii) the increase in demand in the period, related to the seasonality of some customers.
In relation to 4Q22 and the
year 2022, the sales volume of Green PE decreased (-10% and -13%), given the lower availability of product for sale due to the scheduled
maintenance shutdown and the conclusion of the ramp-up process of the 30% expansion project of the current production capacity of the
green ethylene unit in the Rio Grande do Sul complex.
[2] Due to the conclusion
of the project to expand in 30% green ethylene capacity at the Rio Grande do Sul unit, the calculation of the utilization rate for 4Q22
considers the production capacity of 200 kt/year, and for 3Q23 and 4Q23 considers the production capacity of 260 kt/year.
| 2.2 | UNITED STATES & EUROPE |
Average utilization
rate of PP plants: remained in line with 3Q23. Increased (+7 p.p.) when compared to 4Q22 mainly explained by: (i) lower utilization
rate in 4Q22 due to the adjustments of production volume to inventory levels and demand in the United States converters chain; and (ii)
PP inventory build-up during the quarter considering the scheduled maintenance shutdown at Oyster Creek in the United States expected
for 1Q24.
In the annual comparison,
the utilization rate remained in line with 2022.

PP sales volume: lower
when compared to 3Q23 (-6%) due to lower demand in the regions, mainly explained by: (i) the seasonality of the period; and (ii) the destocking
process in the converter chain in the United States. In relation to 4Q22, the PP sales volume remained in line.
Compared to 2022, PP sales volume
remained in line.

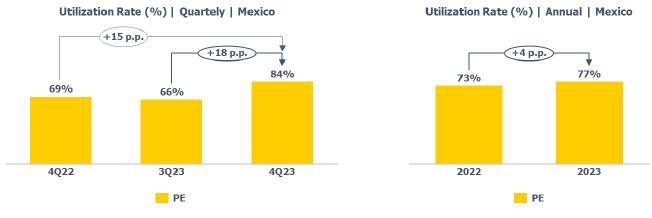
Average utilization
rate of PE plants: increased in relation to 3Q23 (+18 p.p.) mainly explained by the production resumption after the unscheduled shutdown
in 3Q23. In relation to 4Q22, the increase (+15 p.p.) is explained by the production normalization due to the higher availability of feedstock.
In 4Q23, the average ethane
supply by Pemex was around 35 thousand barrels per day, above the minimum volume established in the contract, and the average ethane import
through Fast Track was around 18 thousand barrels per day.
In 2023, the utilization
rate was higher (+4 p.p.) compared to 2022, explained mainly by higher ethane supply by Pemex during the year, representing an increase
of 16% (around 4,5 thousand barrels per day) compared to 2022.
PE sales volume: decreased
compared to 3Q23 (-17%) and remained in line with 4Q22, mainly due to inventory rebuilding and the seasonality of the period.
Compared to 2022, the increase
in sales volume (+5%) in 2023 is explained mainly by the higher availability of products for sale due to the higher utilization rate in
the period.


SIGNATURES
Pursuant
to the requirements of the Securities Exchange Act of 1934, the registrant has duly caused this report to be signed on its behalf
by the undersigned, thereunto duly authorized.
Date: February 19, 2024
| |
BRASKEM S.A. |
| |
|
|
|
| |
|
|
|
| |
By: |
/s/ Pedro van Langendonck Teixeira de Freitas |
| |
|
|
| |
|
Name: |
Pedro van Langendonck Teixeira de Freitas |
| |
|
Title: |
Chief Financial Officer |
DISCLAIMER ON FORWARD-LOOKING STATEMENTS
This Material Fact may contain forward-looking statements. These statements are not historical facts but rather are based on the current
view and estimates of the Company's management regarding future economic and other circumstances, industry conditions, financial performance,
and results, including any potential or projected impact regarding the geological event in Alagoas and related legal procedures on the
Company's business, financial condition, and operating results. The words “project,” “believe,” “estimate,”
“expect,” “plan,” “objective,” and other similar expressions, when referring to the Company, are used
to identify forward-looking statements. Statements related to the possible outcome of legal and administrative proceedings, implementation
of operational and financing strategies and investment plans, guidance on future operations, the objective of expanding its efforts to
achieve the sustainable macro-objectives disclosed by the Company, as well as factors or trends that affect the financial condition, liquidity
or operating results of the Company are examples of forward-looking statements. Such statements reflect the current views of the Company's
management and are subject to various risks and uncertainties, many of which are beyond the Company’s control. There is no guarantee
that the events, trends, or expected results will actually occur. The statements are based on various assumptions and factors, including,
but not limited to, general economic and market conditions, industry conditions and operating factors, availability, development, and
financial access to new technologies. Any change in these assumptions or factors, including the projected impact from the joint venture
and its development of technologies, from the geological event in Alagoas and related legal procedures, and the unprecedented impact on
businesses, employees, service providers, shareholders, investors, and other stakeholders of the Company could cause effective results
to differ significantly from current expectations. For a comprehensive description of the risks and other factors that could impact any
forward-looking statements in this document, especially the factors discussed in the sections, see the reports filed with the Brazilian
Securities and Exchange Commission (CVM). This Material Fact does not constitute any offer of securities for sale in Brazil. No securities
may be offered or sold in Brazil without being registered or exempted from registration, and any public offer of securities carried out
in Brazil must be made through a prospectus, which would be made available by Braskem and contain detailed information on Braskem and
its management, as well as its financial statements.
Braskem (NYSE:BAK)
Historical Stock Chart
Von Mär 2024 bis Apr 2024

Braskem (NYSE:BAK)
Historical Stock Chart
Von Apr 2023 bis Apr 2024
