BELOIT, Wis., Nov. 1 /PRNewswire-FirstCall/ -- Regal Beloit
Corporation (NYSE:RBC) today reported record financial results for
the third quarter ended September 29, 2007. The strength of the
power generation and industrial motor markets offset the impact of
a continued weak residential HVAC market and cost pressures from
raw material inflation. The successful execution of the Company's
strategic initiatives continues to have a significant positive
impact on performance. Specifically, globalization, acquisitions
and innovation drove sales growth, while Lean Six Sigma and
productivity projects contributed to operating margins. Net sales
increased 7.2% to $449.4 million from $419.3 million in the third
quarter of 2006. Net sales include $28.3 million resulting from the
acquisitions of the FASCO and Jakel businesses that were acquired
on August 31, 2007. Sales for the Electrical Segment, increased
7.7% as non-HVAC motor and generator sales increased 8.9% and 33.6%
respectively, offset by a 16.8% decline in residential HVAC
revenues. Segment sales included the sales attributed to the
acquisitions of Jakel and FASCO that are operated as a single
business unit within the Electrical Segment. Sales in the
Mechanical Segment increased 3.5% from the prior year period. The
gross profit margin for the third quarter of 2007 was 23.7% as
compared to 24.6% reported for the third quarter of 2006. The
reduction was a result of raw material inflation and the effect of
the acquired businesses. These factors were partially offset by
higher selling prices and productivity improvements. Income from
operations was $53.4 million or 11.9% of sales, an increase over
the $53.0 million or 12.7% of sales reported for the third quarter
of 2006. Operating expenses included a pre-tax charge of $1.8
million resulting from settlement of the Enron legal matter. The
acquired businesses contributed $0.9 million to income from
operations. Net income in the third quarter of 2007 was $31.2
million, a 5.0% increase from $29.7 million reported in the third
quarter of 2006. Diluted earnings per share increased 3.4% to $0.92
as compared to $0.89 for the third quarter of 2006. "We are very
pleased to be reporting yet another record quarter for the Company,
despite the challenging residential end market and significant raw
material inflation," commented Henry W. Knueppel, Chairman and CEO,
"Our performance reflects the solid execution of our strategic
initiatives. Although the sales environment is not as strong as
what we have experienced for the last two years, we are confident
about our ability to translate our strategy into outstanding
results." "We continue to believe that our Lean Six Sigma,
Digitization, Globalization, Innovation and Customer Centricity
initiatives will provide the foundation for continued profitable
growth and our ability to continue to provide high levels of
returns to shareholders" Knueppel added. "As we look at the fourth
quarter, we expect solid industrial and power generation end
markets and a seasonal decline on top of an already soft
residential end market. While we will continue to experience
commodity cost pressures we believe that continued productivity
improvements will help us offset a substantial portion of these
negative factors and as a result, we are providing fourth quarter
EPS guidance of $.67 to .74." Regal Beloit will be holding a
conference call to discuss second quarter financial results at 1:30
PM CT (2:30 PM EDT) today. Interested parties should call
888-428-4478. A replay of the call will be available through
November 14, 2007 at 800-475-6701, access code 862076. Regal Beloit
Corporation is a leading manufacturer of mechanical and electrical
motion control and power generation products serving markets
throughout the world. Regal Beloit is headquartered in Beloit,
Wisconsin, and has manufacturing, sales, and service facilities
throughout the United States, Canada, Mexico, Europe and Asia.
CAUTIONARY STATEMENT This news release contains "forward-looking
statements" as defined in the Private Securities Litigation Reform
Act of 1995. Forward-looking statements represent our management's
judgment regarding future events. In many cases, you can identify
forward-looking statements by terminology such as "may," "will,"
"plan," "expect," "anticipate," "estimate," "believe," or
"continue" or the negative of these terms or other similar words.
Actual results and events could differ materially and adversely
from those contained in the forward-looking statements due to a
number of factors, including: -- unanticipated fluctuations in
commodity prices and raw material costs; -- cyclical downturns
affecting the global market for capital goods; -- economic changes
in global markets where we do business, such as currency exchange
rates, inflation rates, interest rates, recession, foreign
government policies and other external factors that we cannot
control; -- unexpected issues and costs arising from the
integration of acquired companies and businesses; -- actions taken
by our competitors; -- unanticipated costs associated with
litigation matters; -- marketplace acceptance of new and existing
products including the loss of, or a decline in business from, any
significant customers; -- the impact of capital market transactions
that we may effect; -- difficulties in staffing and managing
foreign operations; -- the availability and effectiveness of our
information technology systems; -- other risks and uncertainties
including but not limited to those described in Item 1A-Risk
Factors of the Company's Annual Report on Form 10-K filed on
February 28, 2007 and from time to time in our reports filed with
U.S. Securities and Exchange Commission. All subsequent written and
oral forward-looking statements attributable to us or to persons
acting on our behalf are expressly qualified in their entirety by
the applicable cautionary statements. The forward-looking
statements included in this news release are made only as of their
respective dates, and we undertake no obligation to update these
statements to reflect subsequent events or circumstances. See also
Item 1A - Risk Factors in the Company's Annual Report on Form 10-K
filed on February 28, 2007. STATEMENTS OF INCOME In Thousands of
Dollars (Unaudited) Three Months Ended Nine Months Ended Sept. 29,
Sept. 30, Sept. 29, Sept. 30, 2007 2006 2007 2006 Net Sales
$449,374 $419,301 $1,327,815 $1,252,896 Cost of Sales 342,660
316,231 1,019,998 952,521 Gross Profit 106,714 103,070 307,817
300,375 Operating Expenses 53,339 50,021 147,056 145,842 Income
From Operations 53,375 53,049 160,761 154,533 Interest Expense
5,116 5,038 14,607 15,287 Interest Income 365 170 695 430 Income
Before Taxes & Minority Interest 48,624 48,181 146,849 139,676
Provision For Income Taxes 16,638 17,623 50,301 50,812 Income
Before Minority Interest 31,986 30,558 96,548 88,864 Minority
Interest in Income, Net of Tax 747 818 2,243 2,027 Net Income
$31,239 $29,740 $94,305 $86,837 Earnings per Share of Common Stock:
Basic $1.00 $0.96 $3.02 $2.82 Assuming Dilution $0.92 $0.89 $2.78
$2.60 Cash Dividends Declared $0.15 $0.14 $0.44 $0.41 Weighted
Average Number of Shares Outstanding: Basic 31,320,838 30,888,136
31,227,373 30,802,048 Assuming Dilution 34,104,123 33,440,015
33,943,057 33,347,817 CONDENSED BALANCE SHEETS In Thousands of
Dollars (From Audited (Unaudited) Statements) ASSETS Sept. 29, 2007
Dec. 30, 2006 Current Assets: Cash and Cash Equivalents $55,564
$36,520 Receivables and Other Current Assets 355,256 263,470
Inventories 285,839 275,138 Total Current Assets 696,659 575,128
Net Property, Plant and Equipment 326,637 268,880 Goodwill 636,077
546,152 Intangible Assets, net of Amortization 102,989 43,257 Other
Noncurrent Assets 14,458 10,102 Total Assets $1,776,820 $1,443,519
LIABILITIES AND SHAREHOLDERS' INVESTMENT Current Liabilities
$310,954 $258,541 Long-Term Debt 497,262 323,946 Deferred Income
Taxes 75,071 65,937 Other Noncurrent Liabilities 10,967 12,302
Minority Interest in Consolidated Subsidiaries 12,171 9,634 Pension
and Other Postretirement Benefits 24,276 23,184 Total Current
Liabilities 930,701 693,544 Shareholders' Investment 846,119
749,975 Total Liabilities and Shareholders' Investment $1,776,820
$1,443,519 SEGMENT INFORMATION In Thousands of Dollars (Unaudited)
Mechanical Segment Third Quarter Ending Nine Months Ending Sept.
29, Sept. 30, Sept. 29, Sept. 30, 2007 2006 2007 2006 Net Sales
$50,620 $48,931 $156,602 $154,934 Income from Operations 7,205
5,458 22,485 16,299 % of Net Sales 14.2% 11.2% 14.4% 10.5% Goodwill
at end of period $530 $530 $530 $530 (Unaudited) Electrical Segment
Third Quarter Ending Nine Months Ending Sept. 29, Sept. 30, Sept.
29, Sept. 30, 2007 2006 2007 2006 Net Sales $398,754 $370,370
$1,171,213 $1,097,962 Income from Operations 46,170 47,591 138,276
138,234 % of Net Sales 11.6% 12.8% 11.8% 12.6% Goodwill at end of
period $635,547 $546,842 $635,547 $546,842 CONDENSED CASH FLOW
STATEMENT In Thousands of Dollars (Unaudited) Nine Months Ended
Sept. 29, 2007 Sept. 30, 2006 CASH FLOWS FROM OPERATING ACTIVITIES:
Net income $94,305 $ 86,837 Adjustments to reconcile net income to
net cash provided by operating activities; net of effect of
acquisitions Depreciation and amortization 30,345 25,835 Minority
interest 2,243 2,027 Excess tax benefit from stock-based
compensation (6,681) (1,960) Gain on sale of assets, net (34)
(1,881) Stock-based compensation expense 2,802 2,665 Change in
assets and liabilities, net 45,337 (60,713) Net cash provided by
operating activities 168,317 52,810 CASH FLOWS FROM INVESTING
ACTIVITIES: Additions to property, plant and equipment (23,818)
(37,689) Purchases of short-term investments, net - (5,853)
Business acquisitions, net of cash acquired (253,241) (10,962) Sale
of property, plant and equipment 160 15,555 Net cash used in
investing activities (276,899) (38,949) CASH FLOWS FROM FINANCING
ACTIVITIES: Net proceeds from short-term borrowing 8,200 -
Long-term debt proceeds 250,000 - Payments of long-term debt (333)
(333) Net repayments under revolving credit facility (76,200)
(23,600) Net (repayments) proceeds from commercial paper borrowings
(49,000) 22,737 Dividends paid to shareholders (13,394) (12,301)
Proceeds from the exercise of stock options 1,684 5,132 Excess tax
benefits from stock-based compensation 6,681 1,960 Distributions to
minority partners (106) - Financing fees paid (1,397) - Net cash
provided by (used in) financing activities 126,135 (6,405) EFFECT
OF EXCHANGE RATES ON CASH 1,491 (17) Net increase in cash and cash
equivalents 19,044 7,439 Cash and cash equivalents at beginning of
period 36,520 32,747 Cash and cash equivalents at end of period
$55,564 $ 40,186 DATASOURCE: Regal Beloit Corporation CONTACT:
David A. Barta, Vice President, Chief Financial Officer of Regal
Beloit Corporation, +1-608-361-7405 Web site:
http://www.regal-beloit.com/
Copyright
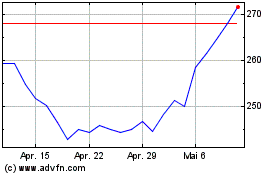
RBC Bearings (NYSE:RBC)
Historical Stock Chart
Von Jun 2024 bis Jul 2024

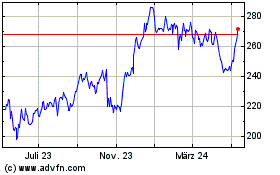
RBC Bearings (NYSE:RBC)
Historical Stock Chart
Von Jul 2023 bis Jul 2024
