Putnam Closed End Funds Release Updated Portfolio Information
13 Februar 2006 - 10:15PM
Business Wire
Putnam Investments today released call schedule information on
certain of its closed-end fixed income funds. This call schedule
reflects the percentage of assets in each portfolio, as of December
31, 2005, representing bonds with call (redemption) dates in each
specified year. Putnam and the funds make no representations
regarding whether or not any bond will be called or whether or not
a fund will hold any bond until the next call date. Each fund's
holdings are subject to change. -0- *T Call Data - Tax Exempt Funds
Fund Name 2006 2007 2008 2009 2010 2011 Putnam Investment Grade
Municipal Trust (NYSE:PGM) 8.1% 12.6% 4.7% 4.3% 8.8% 4.7% Putnam
Municipal Bond Fund (NYSE:PMG) 8.1% 8.5% 1.9% 5.7% 9.2% 8.0% Putnam
Managed Municipal Income Trust (NYSE:PMM) 9.9% 8.3% 6.5% 7.7% 8.9%
5.3% Putnam Municipal Opportunities Trust (NYSE:PMO) 9.1% 7.1% 2.0%
4.3% 3.4% 6.5% Putnam High Yield Municipal Trust (NYSE:PYM) 8.1%
5.4% 6.2%10.0% 7.7% 8.6% Putnam Tax-Free Health Care Fund
(NYSE:PMH) 1.3% 1.7% 7.8%10.4% 7.2% 9.4% Putnam California
Investment Grade Municipal Trust (AMEX:PCA) 1.2% 2.9% 5.6% 8.0%
2.3% 1.4% Putnam New York Investment Grade Municipal Trust (AMEX:
PMN) 6.2% 0.6% 5.5% 0.0% 3.2% 8.5% Data represent percentages of
gross assets. Cash is included in 2006 Call Data - Taxable Funds
Fund Name 2006 2007 2008 2009 2010 2011 Putnam Premier Income Trust
(NYSE:PPT) 1.81% 2.55% 4.73% 3.40% 1.27% 0.88% Putnam Master
Intermediate Income Trust (NYSE:PIM) 1.81% 2.83% 4.84% 3.18% 1.31%
0.87% Putnam Managed High Yield Trust (NYSE:PTM) 7.79% 12.28%
21.45% 17.81% 9.11% 3.30% -------------------------------------
Data represent percentages of gross assets, excluding cash. Notes
1. Percentages are of each fund's total assets other than cash as
of 12/31/2005, and reflect rounding. 2. Table excludes callable
bonds currently in default. For each bond, the table reflects the
next call date and does not account for extraordinary call
features. 3. Currently callable bonds are included in 2006 figures.
*T To access this and other information on Putnam's closed-end
funds, please visit www.putnaminvestments.com and select "Mutual
funds" from the "Investment Choices" tab on the Individual Investor
site home page. Within the mutual fund section, scroll down to find
Putnam closed-end funds. This link provides fund details, daily
pricing and yield information, semiannual and annual reports, and
other information about Putnam closed-end funds. About Putnam
Investments: Founded in 1937, Putnam Investments is one of the
nation's oldest and largest money management firms. As of January
31, 2006, Putnam managed $192 billion in assets, of which mutual
fund assets were $128 billion and institutional assets were $64
billion. Putnam has offices in Boston, London and Tokyo. For more
information, go to www.putnaminvestments.com.
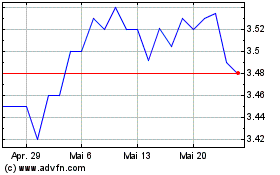
Putnam Premier Income (NYSE:PPT)
Historical Stock Chart
Von Jun 2024 bis Jul 2024

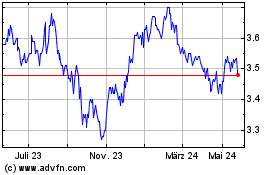
Putnam Premier Income (NYSE:PPT)
Historical Stock Chart
Von Jul 2023 bis Jul 2024
