UNITED STATES
SECURITIES AND EXCHANGE COMMISSION
Washington, D.C. 20549
FORM
N-CSR
CERTIFIED SHAREHOLDER REPORT OF REGISTERED
MANAGEMENT INVESTMENT COMPANIES
|
|
|
| Investment Company Act file number |
|
811-22970 |
Nuveen Dow 30SM Dynamic Overwrite Fund
(Exact name of registrant as
specified in charter)
Nuveen Investments
333 West Wacker Drive
Chicago, IL
60606
(Address of principal
executive offices) (Zip code)
Mark L. Winget
Nuveen Investments
333 West Wacker
Drive
Chicago, IL 60606
(Name and address of agent for service)
Registrant’s telephone number, including area
code: (312) 917-7700
Date of fiscal year end: December
31
Date of reporting period: December 31,
2023
Form N-CSR is to be used by
management investment companies to file reports with the Commission not later than 10 days after the transmission to stockholders of any report that is required to be transmitted to stockholders under Rule 30e-1 under the Investment Company Act of
1940 (17 CFR 270.30e-1). The Commission may use the information provided on Form N-CSR in its regulatory, disclosure review, inspection, and policymaking roles.
A registrant is required to disclose the information specified by Form N-CSR, and the Commission will make this information public. A registrant is not
required to respond to the collection of information contained in Form N-CSR unless the Form displays a currently valid Office of Management and Budget (“OMB”) control number. Please direct comments concerning the accuracy of the
information collection burden estimate and any suggestions for reducing the burden to Secretary, Securities and Exchange Commission, 450 Fifth Street, NW, Washington, DC 20549-0609. The OMB has reviewed this collection of information under the
clearance requirements of 44 U.S.C. ss. 3507.
ITEM 1. REPORTS TO STOCKHOLDERS.
|
|
|
|
|
|
|
|
|
|

|
|
|
|
Closed-End Funds |
|
|
|
December 31,
2023 |
Nuveen
Closed-End Funds
|
|
|
| |
|
|
| Nuveen S&P 500 Buy-Write Income
Fund |
|
BXMX |
| |
|
|
| Nuveen Dow 30SM Dynamic Overwrite Fund |
|
DIAX |
| |
|
|
| Nuveen S&P 500 Dynamic Overwrite Fund |
|
SPXX |
| |
|
|
| Nuveen Nasdaq 100 Dynamic Overwrite Fund |
|
QQQX |
| |
|
|
| Nuveen Core Equity Alpha Fund |
|
JCE |
| |
Annual
Report
IMPORTANT DISTRIBUTION NOTICE
FOR
SHAREHOLDERS OF THE NUVEEN S&P 500 BUY-WRITE INCOME FUND (BXMX)
NUVEEN DOW 30SM DYNAMIC OVERWRITE
FUND (DIAX)
NUVEEN S&P 500 DYNAMIC OVERWRITE FUND (SPXX)
NUVEEN NASDAQ 100 DYNAMIC OVERWRITE FUND (QQQX)
NUVEEN CORE EQUITY ALPHA FUND (JCE)
SEMI-ANNUAL SHAREHOLDER REPORT FOR THE PERIOD ENDING DECEMBER 31, 2023
The Nuveen S&P 500 Buy-Write Income Fund (BXMX), Nuveen Dow 30SM Dynamic Overwrite Fund (DIAX), Nuveen S&P 500 Dynamic
Overwrite Fund (SPXX), Nuveen Nasdaq 100 Dynamic Overwrite Fund (QQQX) and Nuveen Core Equity Alpha Fund (JCE) seek to offer attractive cash flow to their shareholders, by converting the expected long-term total return potential of the Funds’
portfolio of investments into regular quarterly distributions. Following is a discussion of the Managed Distribution Policy the Funds use to achieve this.
Each
Fund pays quarterly common share distributions that seek to convert the Fund’s expected long-term total return potential into regular cash flow. As a result, the Funds’ regular common share distributions (presently $0.2365, $0.2867,
$0.2940, $0.4200, $0.3200 per share, respectively) may be derived from a variety of sources, including:
· Net investment income consisting of regular interest and dividends
· Realized capital gains or,
· Possibly, returns of capital representing in certain cases unrealized capital appreciation.
Such distributions are sometimes referred to as “managed distributions.” Each Fund seeks to establish a distribution rate that roughly corresponds to the
Adviser’s projections of the total return that could reasonably be expected to be generated by each Fund over an extended period of time. The Adviser may consider many factors when making such projections, including, but not limited to,
long-term historical returns for the asset classes in which each Fund invests. As portfolio and market conditions change, the distribution amount and distribution rate on the Common Shares under the Funds’ Managed Distribution Policy could
change.
When it pays a distribution, each Fund provides holders of its Common Shares a notice of the estimated sources of the Fund’s distributions (i.e., what
percentage of the distributions is estimated to constitute ordinary income, short-term capital gains, long-term capital gains, and/or a non-taxable return of capital) on a year-to-date basis. It does this by posting the notice on its website (www.nuveen.com/cef), and by sending it in written form.
You should not draw any conclusions about the Funds’ investment performance from the amount of this distribution or from the terms of the Funds’ Managed
Distribution Policy. The Funds’ actual financial performance will likely vary from month-to-month and from year-to-year, and there may be extended periods when the distribution rate will exceed the Funds’ actual total returns. The Managed Distribution Policy provides that the Board may amend or terminate the
Policy at any time without prior notice to Fund shareholders. There are presently no reasonably foreseeable circumstances that might cause each Fund to terminate its Managed Distribution Policy.
2
3
|
|
|

|
|
Dear Shareholders, |
| |
Financial markets spent the past year focused on the direction of inflation and
whether policy makers would be able to deliver a soft landing in their economies. After more than a year and a half of interest rate increases by the U.S. Federal Reserve (Fed) and other central banks, financial conditions have tightened and
inflation rates have cooled considerably. The Fed increased the target fed funds rate from near zero in March 2022 to a range of 5.25% to 5.50% at its latest increase in July 2023, then left the rate unchanged through January 2024. At its December
2023 policy meeting, the Fed acknowledged the fed funds rate may have reached its peak, and then in January 2024 removed the suggestion that another hike was possible. But current inflation rates remain above central banks’ targets, and the
trajectory from here is difficult to predict given that monetary policy acts on the economy with long and variable lags. |
| |
Surprisingly, economies were relatively resilient for much of 2023. The
“most predicted recession” did not materialize in the U.S. during 2023, while U.K. and European economic growth had begun to show signs of stagnation or decline in the second half of the year. U.S. gross domestic product rose 3.3% in the
fourth quarter of 2023, slower than 4.9% in the third quarter but still ahead of 2.1% in the second quarter and 2.0% in the first quarter. For 2023 overall, GDP grew 2.5% (from the 2022 annual level to the 2023 annual level), compared to 1.9% in
2022. Much of the growth was driven by a relatively strong jobs market, which kept consumer sentiment and spending elevated despite long-term interest rates nearing multi-year highs, a series of U.S. regional bank failures and shocks from flaring
geopolitical tensions. |
|
|
|
|
While central banks are likely nearing the end of this interest rate hiking cycle, there are still upside risks to inflation and downside risks to the economy. Some labor market and consumer indicators are softening. Government
funding and deficits remain a concern, especially as the U.S. election year gets underway. The markets will continue to try to anticipate monetary policy shifts as the Fed evaluates incoming data and adjusts its rate setting activity on a meeting-by-meeting basis. Geopolitical risks – from relations with China, to wars in Europe and the Middle East – also expand the range of outcomes from economies
and markets around the world. All these uncertainties, and others, will remain sources of short-term market volatility. In this environment, Nuveen remains committed to filtering the market noise for investable opportunities that ultimately serve
long-term investment objectives. Maintaining a long-term perspective is also important for investors, and we encourage you to review your time horizon, risk tolerance and investment goals with your financial professional. |
|
|
|
|
On behalf of the other members of the Nuveen Fund Board, we look forward to continuing to earn your trust in the months and years ahead. |
|
|
|
|

|
|
|
|
|
Terence J. Toth |
|
|
|
|
Co-Chair of the Board |
|
|
|
|
February 22, 2024 |
4
Portfolio Manager Update for BXMX
Effective June 30, 2023, Mitchell Trotta was added as a portfolio manager of the Fund. There were no other changes to the portfolio management of the Fund during the
reporting period.
5
|
|
|
| Portfolio Managers’
Comments |
|
|
Nuveen S&P 500 Buy-Write Income Fund (BXMX)
Nuveen Dow 30SM Dynamic Overwrite Fund (DIAX)
Nuveen S&P 500 Dynamic Overwrite Fund (SPXX)
Nuveen Nasdaq 100 Dynamic
Overwrite Fund (QQQX)
Nuveen Core Equity Alpha Fund (JCE)
The
Nuveen S&P 500 Buy-Write Income Fund (BXMX) features portfolio management by Gateway Investment Advisers, LLC (Gateway). The Fund’s portfolio managers are Kenneth Toft, CFA, Michael Buckius, CFA,
Daniel Ashcraft, CFA, and Mitchell Trotta, CFA. The Nuveen Dow 30SM Dynamic Overwrite Fund (DIAX), Nuveen S&P 500 Dynamic Overwrite Fund (SPXX) and Nuveen Nasdaq 100 Dynamic Overwrite Fund
(QQQX) feature portfolio management by Nuveen Asset Management, LLC (NAM), an affiliate of Nuveen Fund Advisors, LLC, the Funds’ investment adviser. The Funds’ portfolio managers are David Friar, James (Jim) Campagna, CFA, Lei Liao, CFA
and Darren Tran, CFA. The Nuveen Core Equity Fund (JCE) features portfolio management by Nuveen Asset Management, LLC (NAM), an affiliate of Nuveen Fund Advisors, LLC, the Fund’s investment adviser. The Fund’s portfolio managers are David
Friar, Maxim Kozlov, CFA, and Pei Chen.
Effective June 30, 2023, Mitchell Trotta was added as a portfolio manager of the Nuveen S&P 500 Buy-Write Income Fund. Michael Buckius, Kenneth Toft and Daniel Ashcraft continue to serve as portfolio managers of the Fund.
Here the Funds’ portfolio management teams review U.S. economic and financial market conditions, key investment strategies and the performance of the Funds for
the twelve-month reporting period ended December 31, 2023. For more information on the Funds’ investment objectives and policies, please refer to the Shareholder Update section at the end of the report.
What factors affected the U.S. economy and financial markets during the twelve-month reporting period ended December 31, 2023?
The U.S. economy performed better than expected despite persistent inflationary pressure and rising interest rates during the twelve-month period ended December 31,
2023. Gross domestic product rose at an annualized rate of 3.3% in the fourth quarter of 2023, after sharply accelerating to 5.2% (annualized) in third quarter of 2023, according to the U.S. Bureau of Economic Analysis initial estimate. For the year
as a whole, GDP was up 2.5% (from the 2022 annual level to the 2023 annual level), compared with an increase of 1.9% in 2022. During the reporting period, price pressures eased in comparison to 2022 given normalization in supply chains, falling
energy prices and aggressive measures by the U.S. Federal Reserve (Fed) and other global central banks to tighten financial conditions and slow demand in their economies. Nevertheless, during the reporting period inflation levels remained higher
than central banks’ target levels.
The Fed raised its target fed funds rate four times during the reporting period, bringing it to a range of 5.25% to 5.50% as
of July 2023 and voting to hold it at that level at its remaining meetings in 2023. During the beginning of the reporting period, the Fed’s activity led to significant volatility in bond and stock markets, given the uncertainty of how rising
interest rates would affect the economy. One of the most highly visible impacts occurred in the U.S. regional banking sector in March 2023, when Silicon Valley Bank, Signature Bank, First Republic Bank and Silvergate Bank failed. In the same month,
Swiss bank UBS agreed to buy Credit Suisse, which was considered vulnerable in the current environment. The Fed’s monetary tightening policy also contributed to an increase in the U.S. dollar’s value relative to major world currencies,
which acts as a headwind to the profits of international companies and U.S. domestic companies with overseas earnings.
During the reporting period, elevated
inflation and higher borrowing costs weighed on some segments of the economy, including the real estate market. Consumer spending, however, has remained more resilient than expected, in part because of a still-strong labor market, another key gauge
of the economy’s health. As of December 2023, the unemployment rate was 3.7%, near its pre-pandemic low, with monthly job growth continuing to moderate. The strong labor market and wage gains helped the
U.S. economy during the reporting period, even as the Fed sought to soften job growth to help curb inflation pressures.
During the reporting period, investors also
continued to monitor government funding and deficits. The U.S. government avoided a default scenario after approving an increase to the debt ceiling limit in June 2023. At the same time, the potential for a government shutdown loomed but was
ultimately avoided with funding resolutions passed in September and November 2023. Notably, in August 2023, ratings agency Fitch downgraded U.S. debt from AAA to AA+ based on concerns about the U.S.’s growing fiscal debt and reduced confidence
in fiscal management.
6
Nuveen S&P 500 Buy-Write Income Fund (BXMX)
What key strategies were used to manage the Fund during the twelve-month reporting period ended December 31, 2023?
BXMX seeks attractive total return with less volatility than the S&P 500® Index by investing in an equity
portfolio that seeks to substantially replicate the price movements of the S&P 500® Index and by selling index call options covering approximately 100% of the Fund’s equity portfolio
value with a goal of enhancing the portfolio’s risk-adjusted returns.
The writing of index call options on a broad equity index, while investing in a portfolio
of equities, has the potential to enhance BXMX’s risk-adjusted returns while exposing the Fund to less risk than unhedged equity investments. Hedging the equity portfolio with index call options may limit the Fund’s participation in market
advances in exchange for the cash premium received for the written index call options. Conversely, market declines are typically buffered by the amount of the cash premium received by the Fund. In flat or declining markets, BXMX’s call option
premium can potentially enhance total return relative to the S&P 500® Index. However, in rising markets, the call options may reduce the Fund’s total return relative to the S&P
500® Index.
During the reporting period, the portfolio management team focused on opportunities in the
written index call option portfolio. The portfolio management team took advantage of elevated implied volatility levels that drove the availability of above-average premiums. These premiums helped to offset a material portion of losses during equity
market declines and offered a high level of market participation during periods of strength.
How did the Fund perform during the twelve-month reporting period
ended December 31, 2023?
For the twelve-month reporting period ended December 31, 2023, BXMX significantly outperformed the Chicago Board Options
Exchange (Cboe) S&P 500® BuyWrite Index (BXMSM). For purposes of this Performance Commentary, references to relative performance are in
comparison to the BXMSM.
The Fund’s options portfolio outperformed the options component of the BXMSM during the reporting period. The portfolio management team’s active adjustments to the Fund’s index call option portfolio were particularly beneficial during periods when the equity market
outperformed the BXMSM. Specifically, the Fund’s options portfolio significantly outperformed the BXMSM during the equity market’s
rapid market advance from mid-March to the end of July 2023 and outperformed the BXMSM to a lesser extent during the equity market advance from the end of
October through December 2023. Additionally, the Fund’s options portfolio outperformed the BXMSM during one of the period’s equity market declines from the end of July through the end of
October 2023. However, the options portfolio underperformed the BXMSM during the other market decline from early February through mid-March 2023. The risk
level of the Fund, as measured by its standard deviation of daily return, was much lower than that of the U.S. equity market and slightly above the BXMSM over the reporting period.
The Fund’s equity portfolio also outperformed the equity component of the BXMSM during the reporting
period. Key drivers of the equity portfolio’s outperformance included stock selection in the information technology, consumer staples and communication services sectors. However, the role of the equity portfolio is to support the option
strategy by closely tracking the S&P 500® Index, so enhancing its return through fundamental stock selection or sector allocation is not a management objective. Relative
performance of the equity portfolio may fluctuate during the short term but is expected to be in line with the S&P 500® Index over longer timeframes.
Nuveen Dow 30SM Dynamic Overwrite Fund (DIAX)
What key strategies were used to manage the Fund during the twelve-month reporting period ended December 31, 2023?
DIAX seeks attractive total return with less volatility than the Dow Jones Industrial Average Index (DJIA) by investing in an equity portfolio that seeks to
substantially replicate the price movements of the DJIA, as well as selling call options on 35% to 75% of the notional value of the Fund’s equity portfolio, with a long-term target of 55% overwrite in an effort to enhance the Fund’s
risk-adjusted returns. The portfolio management team uses its proprietary view of the market’s return and volatility profile to dynamically adjust the option overwrite percentage and other factors.
Generally, if the portfolio management team expects the equity market to appreciate, the option overwrite percentage will be reduced to offer more potential upside
capture. Likewise, if the portfolio management team expects equity markets to be flat or to decline, the option overwrite percentage may be increased, thus managing the Fund to potentially receive additional cash flow from higher sales of call
options. This dynamic option overwrite approach offers the potential for greater equity market upside capture
7
|
|
|
| Portfolio Managers’ Comments
(continued) |
|
|
than the full option overwrite approach, while still offering a measure of downside risk management. The Fund currently
expects to carry out its principal investment strategy by emphasizing options on broad-based indexes, individual stocks in the DJIA, and options on custom baskets of stocks, in addition to exchange-traded funds (ETFs). The Fund also has the
opportunity to utilize call spread strategies and sell put options on a portion of the underlying equity portfolio.
During the reporting period, the portfolio
management team varied the core option overwrite level between 39% and 67%. The average option overwrite level during the reporting period, which consisted primarily of calls written on the S&P
500® Index, was in line with its long-term target.
How did the Fund perform during the twelve-month
reporting period ended December 31, 2023?
For the twelve-month reporting period ended December 31, 2023, DIAX underperformed the DIAX Blended
Benchmark, which is a blended return consisting of 1) 55% Chicago Board Options Exchange (Cboe) DJIA BuyWrite Index (BXDSM) and 2) 45% Dow Jones Industrial Average Index (DJIA). For purposes of
this Performance Commentary, references to relative performance are in comparison to the DIAX Blended Benchmark.
The primary detractor from the Fund’s relative
performance was call options sold on the S&P 500® Index. The BXDSM, which is a component of the DIAX Blended Benchmark, sells index
call options on the DJIA. Because of its investment policies, the Fund is precluded from selling index call options on the DJIA and instead primarily sold call options on the S&P 500®
Index. This combination detracted from the Fund’s relative performance because the S&P 500® Index significantly outperformed the DJIA for the reporting period.
Partially offsetting the Fund’s underperformance was the timing of overwrite levels in the Fund’s options portfolio. During the market’s strong advances
in January, June and November 2023, the portfolio management team opportunistically lowered the Fund’s level of call selling, which benefited performance. However, this positive contribution was slightly offset by not adding enough options
during the September 2023 market pullback.
The portfolio management team was able to generate additional income from selling put options on the S&P 500® Index, taking advantage of the index’s generally upward trajectory over the year. In addition, the portfolio management team sold calls and bought puts on the Russell 2000 Index, bought and
sold single name call options, bought puts and calls on the Chicago Board Options Exchange (Cboe) Volatility Index (the VIX®), and bought and sold calls and puts on several ETFs, which had a
negligible impact on relative performance in 2023.
Nuveen S&P 500 Dynamic Overwrite Fund (SPXX)
What key strategies were used to manage the Fund during the twelve-month reporting period ended December 31, 2023?
SPXX seeks attractive total return with less volatility than the S&P 500® Index by investing in an equity
portfolio that seeks to substantially replicate the price movements of the S&P 500® Index, as well as selling call options on 35% to 75% of the notional value of the Fund’s equity
portfolio, with a long-run target of 55% overwrite in an effort to enhance the Fund’s risk-adjusted returns. The portfolio management team uses its proprietary view of the market’s return and
volatility profile to dynamically adjust the option overwrite percentage and other factors. The strategy will consider the Fund’s tax position and employ techniques to improve after-tax shareholder
outcomes.
Generally, if the portfolio management team expects the equity market to appreciate, the option overwrite percentage will be reduced to offer more
potential upside capture. Likewise, if the portfolio management team expects equity markets to be flat or to decline, the option overwrite percentage may be increased, thus managing the Fund to potentially receive additional cash flow from higher
sales of call options. This dynamic option overwrite approach offers the potential for greater equity market upside capture than the full option overwrite approach, while still offering a measure of downside risk management. The Fund currently
expects to emphasize index call options on the S&P 500® Index and can also employ an expanded range of options including index options on other broad-based indexes and options on custom
baskets of stocks, in addition to single name options. The Fund also has the opportunity to utilize call spread strategies and sell put options on a portion of the underlying equity portfolio.
During the reporting period, the portfolio management team varied the core option overwrite level between 39% and 54%. The average option overwrite level during the
reporting period, which consisted primarily of calls written on the S&P 500® Index, was in line with its long-term target.
8
How did the Fund perform during the twelve-month reporting period ended December 31, 2023?
For the twelve-month reporting period ended December 31, 2023, SPXX performed in line with the SPXX Blended Benchmark, which is a blended return consisting of 1)
55% Chicago Board Options Exchange (Cboe) S&P 500® BuyWrite Index (BXMSM) and 2) 45% S&P 500® Index. For the purposes of this Performance Commentary, references to relative performance are in comparison to the SPXX Blended Benchmark.
The Fund’s equity portfolio outperformed the equity component of the SPXX Blended Benchmark over the reporting period. Key drivers of outperformance were stock
selection in the financials, consumer staples and communication services sectors. The timing of overwrite levels in the Fund’s options portfolio also contributed to relative results. During the market’s strong advances in January, June and
November 2023, the portfolio management team opportunistically lowered the Fund’s level of call selling, which benefited performance. However, this positive contribution was offset by not adding enough options during the September 2023 market
pullback. In addition, the portfolio management team sold calls and bought puts on the Russell 2000 Index, sold call and put options on the S&P 500® Index, bought and sold single name call
options, bought puts and calls on the Chicago Board Options Exchange (Cboe) Volatility Index (the VIX®), and bought and sold calls and puts on several ETFs, however the impact of these
positions on relative performance was minimal.
Nuveen Nasdaq 100 Dynamic Overwrite Fund (QQQX)
What key strategies were used to manage the Fund during the twelve-month reporting period ended December 31, 2023?
QQQX seeks attractive total return with less volatility than the Nasdaq 100® Index by investing in an equity
portfolio that seeks to substantially replicate the price movements of the Nasdaq 100® Index, as well as selling call options on 35% to 75% of the notional value of the Fund’s equity
portfolio, with a long-run target of 55% in an effort to enhance the Fund’s risk-adjusted returns. The portfolio management team uses its proprietary view of the market’s return and volatility
profile to dynamically adjust the option overwrite percentage and other factors. The strategy will consider the Fund’s tax position and employ techniques to improve after-tax shareholder outcomes.
Generally, if the portfolio management team expects the equity market to appreciate, the overwrite percentage will be reduced to offer more potential upside capture.
Likewise, if the portfolio management team expects equity markets to be flat or to decline, the overwrite percentage may be increased, thus managing the Fund to potentially receive additional cash flow from higher sales of call options. This dynamic
option overwrite approach offers potential for greater equity market upside capture than the full overwrite approach, while still offering a measure of downside risk management. The Fund, in carrying out its principal options strategy, expects to
primarily write index call options on the Nasdaq 100® Index and other broad-based indexes and can also write call options on a variety of other equity market indexes and options on custom
baskets of stocks, in addition to single name options. The Fund also has the opportunity to utilize call spread strategies and sell put options on a portion of the underlying equity portfolio.
During the reporting period, the portfolio management team varied the core option overwrite level between 38% and 66%. The average option overwrite during the reporting
period, which consisted primarily of calls written on the Nasdaq 100® Index, was in line with its long-term target.
How did the Fund perform during the twelve-month reporting period ended December 31, 2023?
For the twelve-month reporting period ended December 31, 2023, QQQX underperformed the QQQX Blended Benchmark, which is a blended return consisting of 1) 55%
Chicago Board Options Exchange (Cboe) Nasdaq 100 BuyWrite Index (BXNSM) and 2) 45% Nasdaq 100® Index. For the purposes of this Performance
Commentary, references to relative performance are in comparison to the QQQX Blended Benchmark.
The primary detractor from the Fund’s relative performance was
the equity portfolio’s return, driven by unfavorable stock selection in the information technology sector. The information technology sector was not only the strongest performing sector in the Nasdaq 100® Index, but its performance was narrowly led by a small group of mega-cap and artificial intelligence related stocks during the reporting period. Therefore,
underweight positions in NVIDIA Corp, Broadcom Inc., and CrowdStrike Holdings Inc., and lack of exposure to Adobe Incorporated detracted from relative performance.
The Fund’s underperformance was partially offset by the timing of overwrite levels in the Fund’s options portfolio. During the market’s strong advances in
January, June and November 2023, the portfolio management team opportunistically lowered the
9
|
|
|
| Portfolio Managers’ Comments
(continued) |
|
|
Fund’s level of call selling, which benefited performance. However, this positive contribution was slightly offset
by not adding enough options during the September 2023 market pullback.
In addition to selling calls on the Nasdaq
100® Index, the portfolio management team also sold calls and bought puts on the Russell 2000 Index, sold call and put options on the S&P
500® Index, bought and sold single name call options, bought puts and calls on the Chicago Board Options Exchange (Cboe) Volatility Index (the
VIX®), and bought and sold calls and puts on several ETFs; however, the impact of these positions on relative performance was minimal.
Nuveen Core Equity Alpha Fund (JCE)
What key strategies were used to
manage the Fund during the twelve-month reporting period ended December 31, 2023?
JCE seeks to provide an attractive level of total return, primarily
through long-term capital appreciation and secondarily through income and gains. The Fund invests in large capitalization common stocks, using a proprietary quantitative process designed to provide the potential for long-term outperformance. The
Fund also sells call options with a notional value of up to 50% of the Fund’s equity portfolio in seeking to enhance risk-adjusted performance relative to an all-equity portfolio. The portfolio management
team uses its proprietary view of the market’s return and volatility profile to dynamically adjust the option overwrite percentage and other factors.
How
did the Fund perform during the twelve-month reporting period ended December 31, 2023?
For the twelve-month reporting period ended December 31, 2023,
JCE outperformed the JCE Blended Benchmark, which is a blend of returns consisting of 1) 50% S&P 500® Index and 2) 50% Chicago Board Options Exchange (Cboe) S&P 500® BuyWrite Index (BXMSM). For purposes of this Performance Commentary, references to relative performance are in comparison to the JCE Blended
Benchmark.
The primary contributor to relative performance was the timing of overwrite levels in the Fund’s options portfolio. During the market’s strong
advances in January, June and November 2023, the portfolio management team opportunistically lowered the Fund’s level of call selling, which benefited performance. However, this positive contribution was slightly offset by not adding enough
options during the September 2023 market pullback. Also, the portfolio management team was able to generate additional income from selling put options on the S&P 500® Index, taking
advantage of the index’s generally upward trajectory. In addition, the portfolio management team bought and sold single name options, which added modestly to performance in 2023.
The Fund’s outperformance was partially offset by the equity portfolio’s return, which underperformed the S&P 500® Index, primarily due to security selection in the health care and information technology and consumer discretionary sectors. Detractors included overweight positions in Pfizer Inc. and
Mettler-Toledo International Inc. and underweight positions in NVIDIA Corp, Broadcom Inc., Advanced Micro Devices Inc. and Tesla Inc. As part of the model-driven security selection process, which is designed to select constituents from the S&P
500® Index and the Russell 1000® Index, the portfolio management team seeks to minimize tracking error while adhering to tax and
concentration rules.
In addition to selling call and put options on the S&P 500® Index and on single
names, the portfolio management team sold calls on the Russell 2000® Index, bought puts and calls on the Chicago Board Options Exchange (Cboe) Volatility Index (the VIX®) and sold calls on several ETFs; however, the impact of these positions on relative performance was minimal.
This material is not intended to be a recommendation or
investment advice, does not constitute a solicitation to buy, sell or hold a security or an investment strategy and is not provided in a fiduciary capacity. The information provided does not take into account the specific objectives or circumstances
of any particular investor, or suggest any specific course of action. Investment decisions should be made based on an investor’s objectives and circumstances and in consultation with his or her advisors.
Certain statements in this report are forward-looking statements. Discussions of specific investments are for illustration only and are not intended as
recommendations of individual investments. The forward-looking statements and other views expressed herein are those of the portfolio managers as of the date of this report. Actual future results or occurrences may differ significantly from those
anticipated in any forward-looking statements and the views expressed herein are subject to change at any time, due to numerous market and other factors. The Funds disclaim any obligation to update publicly or revise any forward-looking statements
or views expressed herein.
Refer to the Glossary of Terms Used in this Report for further definition of the terms used within this section.
10
DISTRIBUTION INFORMATION
The
following 19(a) Notice presents the Funds’ most current distribution information as of November 30, 2023 as required by certain exempted regulatory relief the Funds have received.
Because the ultimate tax character of your distributions depends on the Funds’ performance for its entire fiscal year (which is the calendar year for the Funds) as
well as certain fiscal year-end (FYE) tax adjustments, estimated distribution source information you receive with each distribution may differ from the tax information reported to you on your Funds’ IRS
Form 1099 statement.
Each Fund makes regular cash distributions to shareholders of stated dollar amount per share. Subject to approval and oversight by the Board of
Trustees, the Fund seeks to maintain a stable distribution level designed to deliver the long-term return potential of each Fund’s investment strategy through regular distributions (a “Managed Distribution Program”). The practice of
maintaining a stable distribution level had no material effect on each Fund’s investment strategy during the most recent fiscal period and is not expected to have such an effect in future periods, however, distributions in excess of Fund
returns will cause its NAV per share to erode. For additional information, refer to the distribution information section below and in the Notes to Financial Statements herein.
COMMON SHARE DISTRIBUTION INFORMATION – AS OF NOVEMBER 30, 2023
This
notice provides shareholders with information regarding fund distributions, as required by current securities laws. You should not draw any conclusions about the Funds’ investment performance from the amount of this distribution or from the
terms of the Funds’ Managed Distribution Policy.
The following table provides estimates of the Funds’ distribution sources, reflecting year-to-date cumulative experience through the month-end prior to the latest distribution. The Funds attribute these estimates equally
to each regular distribution throughout the year. Consequently, the estimated information as of the specified month-end shown below is for the current distribution, and also represents an updated estimate for
all prior months in the year. For all Funds, it is estimated that the Funds have distributed more than their income and net realized capital gains; therefore, a portion of the distributions may be (and is shown below as being estimated to be) a
return of capital. A return of capital may occur, for example, when some or all of the money that you invested in the Fund is paid back to you. A return of capital distribution does not necessarily reflect the Fund’s investment performance and
should not be confused with “yield” or “income.”
The amounts and sources of distributions set forth below are only estimates and are not being
provided for tax reporting purposes. The actual amounts and sources of the amounts for tax reporting purposes will depend upon the Funds’ investment experience during the remainder of its fiscal year and may be subject to changes based on tax
regulations. Each Fund will send you a Form 1099-DIV for the calendar year that will tell you how to report these distributions for federal income tax purposes. More details about the Funds’ distributions
and the basis for these estimates are available on www.nuveen.com/cef.
Data as of November 30, 2023
|
|
|
|
|
|
|
|
|
|
|
|
|
|
|
|
|
|
|
|
|
|
|
|
|
|
|
|
|
|
|
|
|
|
|
|
|
| |
|
|
|
|
Per Share Estimated Sources of Distribution1 |
|
|
Estimated Percentage of Distributions1 |
|
|
|
|
|
|
|
|
|
|
|
|
|
|
| Fund |
|
Per Share
Distribution |
|
|
Net
Investment Income |
|
|
Long-
Term Gains |
|
|
Short-
Term Gains |
|
|
Return of
Capital |
|
|
Net
Investment Income |
|
|
Long-
Term Gains |
|
|
Short-
Term Gains |
|
|
Return of
Capital |
|
| |
|
| BXMX (FYE 12/31) |
|
|
|
|
|
|
|
|
|
|
|
|
|
|
|
|
|
|
|
|
|
|
|
|
|
|
|
|
|
|
|
|
|
|
|
|
| Current Quarter |
|
|
$0.2365 |
|
|
|
$0.0285 |
|
|
|
$0.1414 |
|
|
|
$0.0441 |
|
|
|
$0.0225 |
|
|
|
12.0% |
|
|
|
59.8% |
|
|
|
18.6% |
|
|
|
9.5% |
|
| Fiscal YTD |
|
|
$0.9460 |
|
|
|
$0.1138 |
|
|
|
$0.5656 |
|
|
|
$0.1764 |
|
|
|
$0.0902 |
|
|
|
12.0% |
|
|
|
59.8% |
|
|
|
18.6% |
|
|
|
9.5% |
|
| |
|
| DIAX (FYE 12/31) |
|
|
|
|
|
|
|
|
|
|
|
|
|
|
|
|
|
|
|
|
|
|
|
|
|
|
|
|
|
|
|
|
|
|
|
|
| Current Quarter |
|
|
$0.2867 |
|
|
|
$0.0530 |
|
|
|
$0.0577 |
|
|
|
$0.0000 |
|
|
|
$0.1760 |
|
|
|
18.5% |
|
|
|
20.1% |
|
|
|
0.0% |
|
|
|
61.4% |
|
| Fiscal YTD |
|
|
$1.1468 |
|
|
|
$0.2120 |
|
|
|
$0.2308 |
|
|
|
$0.0000 |
|
|
|
$0.7040 |
|
|
|
18.5% |
|
|
|
20.1% |
|
|
|
0.0% |
|
|
|
61.4% |
|
| |
|
| SPXX (FYE 12/31) |
|
|
|
|
|
|
|
|
|
|
|
|
|
|
|
|
|
|
|
|
|
|
|
|
|
|
|
|
|
|
|
|
|
|
|
|
| Current Quarter |
|
|
$0.2940 |
|
|
|
$0.0285 |
|
|
|
$0.0701 |
|
|
|
$0.0000 |
|
|
|
$0.1954 |
|
|
|
9.7% |
|
|
|
23.8% |
|
|
|
0.0% |
|
|
|
66.4% |
|
| Fiscal YTD |
|
|
$1.1760 |
|
|
|
$0.1142 |
|
|
|
$0.2804 |
|
|
|
$0.0000 |
|
|
|
$0.7814 |
|
|
|
9.7% |
|
|
|
23.8% |
|
|
|
0.0% |
|
|
|
66.4% |
|
| |
|
| QQQX (FYE 12/31) |
|
|
|
|
|
|
|
|
|
|
|
|
|
|
|
|
|
|
|
|
|
|
|
|
|
|
|
|
|
|
|
|
|
|
|
|
| Current Quarter |
|
|
$0.4200 |
|
|
|
$0.0000 |
|
|
|
$0.1097 |
|
|
|
$0.0258 |
|
|
|
$0.2845 |
|
|
|
0.0% |
|
|
|
26.1% |
|
|
|
6.1% |
|
|
|
67.7% |
|
| Fiscal YTD |
|
|
$1.6800 |
|
|
|
$0.0000 |
|
|
|
$0.4387 |
|
|
|
$0.1032 |
|
|
|
$1.1381 |
|
|
|
0.0% |
|
|
|
26.1% |
|
|
|
6.1% |
|
|
|
67.7% |
|
| |
|
| JCE (FYE 12/31) |
|
|
|
|
|
|
|
|
|
|
|
|
|
|
|
|
|
|
|
|
|
|
|
|
|
|
|
|
|
|
|
|
|
|
|
|
| Current Quarter |
|
|
$0.3200 |
|
|
|
$0.0154 |
|
|
|
$0.0068 |
|
|
|
$0.0000 |
|
|
|
$0.2978 |
|
|
|
4.8% |
|
|
|
2.1% |
|
|
|
0.0% |
|
|
|
93.1% |
|
| Fiscal YTD |
|
|
$1.2800 |
|
|
|
$0.0614 |
|
|
|
$0.0273 |
|
|
|
$0.0000 |
|
|
|
$1.1913 |
|
|
|
4.8% |
|
|
|
2.1% |
|
|
|
0.0% |
|
|
|
93.1% |
|
| |
|
1 Net investment income (NII) is a projection through the end of the current
calendar quarter using actual data through the stated month-end date above. Capital gain amounts are as of the stated date above. The estimated per share sources above include an allocation of the NII based on
prior year attributions which can be expected to differ from the actual final attributions for the current year.
11
|
|
|
| Common Share Information
(continued) |
|
|
The following table provides information regarding the Funds’ distributions and total return performance over
various time periods. This information is intended to help you better understand whether returns for the specified time periods were sufficient to meet its distributions.
Data as of November 30, 2023
|
|
|
|
|
|
|
|
|
|
|
|
|
|
|
|
|
|
|
|
|
|
|
|
|
|
|
|
|
|
|
|
|
| |
|
|
|
|
|
|
|
|
|
|
|
|
|
Annualized |
|
|
Cumulative |
|
|
|
|
|
|
|
|
|
|
|
|
|
|
|
|
|
|
|
|
|
|
| Fund |
|
Inception
Date |
|
|
Quarterly
Distribution |
|
|
Fiscal YTD
Distribution |
|
|
Net Asset
Value (NAV) |
|
|
5-Year
Return on NAV |
|
|
Fiscal YTD
Dist Rate on
NAV1 |
|
|
Fiscal YTD
Return on NAV |
|
|
Fiscal YTD
Dist Rate
on NAV1 |
|
| |
|
| BXMX |
|
|
Oct-2004 |
|
|
|
$0.2365 |
|
|
|
$0.9460 |
|
|
|
$13.89 |
|
|
|
7.40% |
|
|
|
6.81% |
|
|
|
16.44% |
|
|
|
6.81% |
|
| DIAX |
|
|
Apr-2005 |
|
|
|
$0.2867 |
|
|
|
$1.1468 |
|
|
|
$15.96 |
|
|
|
3.80% |
|
|
|
7.19% |
|
|
|
4.11% |
|
|
|
7.19% |
|
| SPXX |
|
|
Nov-2005 |
|
|
|
$0.2940 |
|
|
|
$1.1760 |
|
|
|
$16.11 |
|
|
|
7.17% |
|
|
|
7.30% |
|
|
|
15.06% |
|
|
|
7.30% |
|
| QQQX |
|
|
Jan-2007 |
|
|
|
$0.4200 |
|
|
|
$1.6800 |
|
|
|
$24.18 |
|
|
|
8.99% |
|
|
|
6.95% |
|
|
|
30.08% |
|
|
|
6.95% |
|
| JCE |
|
|
Mar-2007 |
|
|
|
$0.3200 |
|
|
|
$1.2800 |
|
|
|
$13.20 |
|
|
|
9.33% |
|
|
|
9.70% |
|
|
|
18.10% |
|
|
|
9.70% |
|
| |
|
1 As a percentage of 11/30/2023 NAV.
DISTRIBUTION INFORMATION – AS OF DECEMBER 31, 2023
The following tables
provides information regarding the Funds’ common share distributions and total return performance for the fiscal year ended December 31, 2023. This information is intended to help you better understand whether the Funds’ returns for
the specified time period were sufficient to meet its distributions.
Data as of December 31, 2023
|
|
|
|
|
|
|
|
|
|
|
|
|
|
|
|
|
|
|
|
|
|
|
|
|
|
|
|
|
|
|
|
|
|
|
|
|
| |
|
|
|
|
Per Share Sources of Distribution |
|
|
Percentage of the Distribution |
|
|
|
|
|
|
|
|
|
|
| Fund |
|
Per Share
Distribution |
|
|
Net
Investment Income |
|
|
Long-Term
Gains |
|
|
Short-Term
Gains |
|
|
Return of
Capital |
|
|
Net
Investment Income |
|
|
Long-Term
Gains |
|
|
Short-Term
Gains |
|
|
Return of
Capital |
|
| |
|
| BXMX |
|
|
|
|
|
|
|
|
|
|
|
|
|
|
|
|
|
|
|
|
|
|
|
|
|
|
|
|
|
|
|
|
|
|
|
|
| (FYE 12/31) |
|
|
$0.9460 |
|
|
|
$0.1129 |
|
|
|
$0.3980 |
|
|
|
$0.1763 |
|
|
|
$0.2588 |
|
|
|
11.93% |
|
|
|
42.07% |
|
|
|
18.64% |
|
|
|
27.36% |
|
| |
|
| DIAX |
|
|
|
|
|
|
|
|
|
|
|
|
|
|
|
|
|
|
|
|
|
|
|
|
|
|
|
|
|
|
|
|
|
|
|
|
| (FYE 12/31) |
|
|
$1.1469 |
|
|
|
$0.1981 |
|
|
|
$0.0952 |
|
|
|
$0.0000 |
|
|
|
$0.8536 |
|
|
|
17.27% |
|
|
|
8.30% |
|
|
|
0.00% |
|
|
|
74.43% |
|
| |
|
| SPXX |
|
|
|
|
|
|
|
|
|
|
|
|
|
|
|
|
|
|
|
|
|
|
|
|
|
|
|
|
|
|
|
|
|
|
|
|
| (FYE 12/31) |
|
|
$1.1760 |
|
|
|
$0.1135 |
|
|
|
$0.6283 |
|
|
|
$0.0000 |
|
|
|
$0.4342 |
|
|
|
9.65% |
|
|
|
53.43% |
|
|
|
0.00% |
|
|
|
36.92% |
|
| |
|
| QQQX |
|
|
|
|
|
|
|
|
|
|
|
|
|
|
|
|
|
|
|
|
|
|
|
|
|
|
|
|
|
|
|
|
|
|
|
|
| (FYE 12/31) |
|
|
$1.6800 |
|
|
|
$0.0000 |
|
|
|
$1.1145 |
|
|
|
$0.1032 |
|
|
|
$0.4623 |
|
|
|
0.00% |
|
|
|
66.34% |
|
|
|
6.14% |
|
|
|
27.52% |
|
| |
|
| JCE |
|
|
|
|
|
|
|
|
|
|
|
|
|
|
|
|
|
|
|
|
|
|
|
|
|
|
|
|
|
|
|
|
|
|
|
|
| (FYE 12/31) |
|
|
$1.2800 |
|
|
|
$0.0631 |
|
|
|
$0.0174 |
|
|
|
$0.0000 |
|
|
|
$1.1995 |
|
|
|
4.93% |
|
|
|
1.36% |
|
|
|
0.00% |
|
|
|
93.71% |
|
| |
|
Data as of December 31, 2023
|
|
|
|
|
|
|
|
|
|
|
|
|
|
|
|
|
|
|
|
|
| |
|
|
|
|
|
|
|
Annualized |
|
|
|
|
|
|
|
|
|
|
|
|
|
|
| Fund |
|
Inception
Date |
|
|
Net Asset
Value (NAV) |
|
|
1-Year
Return on NAV |
|
|
5-Year
Return on NAV |
|
|
Fiscal YTD
Dist Rate on NAV |
|
| |
|
| BXMX |
|
|
Oct-2004 |
|
|
|
$13.94 |
|
|
|
18.84% |
|
|
|
9.17% |
|
|
|
6.79% |
|
| DIAX |
|
|
Apr-2005 |
|
|
|
$16.22 |
|
|
|
7.67% |
|
|
|
6.22% |
|
|
|
7.07% |
|
| SPXX |
|
|
Nov-2005 |
|
|
|
$16.29 |
|
|
|
18.45% |
|
|
|
9.67% |
|
|
|
7.22% |
|
| QQQX |
|
|
Jan-2007 |
|
|
|
$24.68 |
|
|
|
35.03% |
|
|
|
11.69% |
|
|
|
6.81% |
|
| JCE |
|
|
Mar-2007 |
|
|
|
$13.28 |
|
|
|
21.68% |
|
|
|
11.94% |
|
|
|
9.64% |
|
| |
|
NUVEEN CLOSED-END FUND DISTRIBUTION AMOUNTS
The Nuveen Closed-End Funds’ monthly and quarterly periodic distributions to shareholders are posted on www.nuveen.com and
can be found on Nuveen’s enhanced closed-end fund resource page, which is at
https://www.nuveen.com/resource-center-closed-end-funds, along with other Nuveen closed-end fund product updates. To ensure
timely access to the latest information, shareholders may use a subscribe function, which can be activated at this web page (https://www.nuveen.com/subscriptions).
COMMON SHARE EQUITY SHELF PROGRAMS
During the current reporting period, SPXX
and QQQX were authorized by the Securities and Exchange Commission to issue additional common shares through an equity shelf program (Shelf Offering). Under these programs, the Funds, subject to market conditions, may raise additional capital from
time to time in varying amounts and offering methods at a net price at or above each Fund’s NAV per common share. The maximum aggregate offering under these Shelf Offerings are as shown in the accompanying table.
|
|
|
|
|
|
|
|
|
| |
|
SPXX |
|
|
QQQX |
|
| |
|
| Maximum aggregate offering |
|
|
4,993,317 |
|
|
|
Unlimited |
|
| |
|
12
During the current reporting period, QQQX sold common shares through its Shelf Offering at a weighted average premium to
their NAV per common share as shown in the accompanying table.
|
|
|
|
|
| |
|
QQQX |
|
| |
|
| Common shares sold through shelf offering |
|
|
297,524 |
|
| Weighted average premium to NAV per common share sold |
|
|
3.84% |
|
| |
|
Refer to Notes to Financial Statements, for further details of Shelf Offerings and each Fund’s transactions.
COMMON SHARE REPURCHASES
The Funds’ Board of Trustees reauthorized an
open-market share repurchase program, allowing each Fund to repurchase and retire an aggregate of up to approximately 10% of its outstanding common shares.
During
the current reporting period, the Funds did not repurchase any of their outstanding common shares. As of December 31, 2023, (and since the inception of the Funds’ repurchase programs), each Fund has cumulatively repurchased and retired its
outstanding common shares as shown in the accompanying table.
|
|
|
|
|
|
|
|
|
|
|
|
|
|
|
|
|
|
|
|
|
| |
|
BXMX |
|
|
DIAX |
|
|
SPXX |
|
|
QQQX |
|
|
JCE |
|
| |
|
| Common shares repurchased and retired |
|
|
460,238 |
|
|
|
0 |
|
|
|
383,763 |
|
|
|
0 |
|
|
|
449,800 |
|
| Common shares authorized for repurchase |
|
|
10,415,000 |
|
|
|
3,635,000 |
|
|
|
1,795,000 |
|
|
|
4,845,000 |
|
|
|
1,605,000 |
|
| |
|
OTHER COMMON SHARE INFORMATION
As of
December 31, 2023, the Funds’ common share prices were trading at a premium/(discount) to their common share NAVs and trading at an average premium/(discount) to NAV during the current reporting period, as follows:
|
|
|
|
|
|
|
|
|
|
|
|
|
|
|
|
|
|
|
|
|
| |
|
BXMX |
|
|
DIAX |
|
|
SPXX |
|
|
QQQX |
|
|
JCE |
|
| |
|
| Common share NAV |
|
|
$13.94 |
|
|
|
$16.22 |
|
|
|
$16.29 |
|
|
|
$24.68 |
|
|
|
$13.28 |
|
| Common share price |
|
|
$12.83 |
|
|
|
$14.00 |
|
|
|
$15.04 |
|
|
|
$23.15 |
|
|
|
$13.55 |
|
| Premium/(Discount) to NAV |
|
|
(7.96)% |
|
|
|
(13.69)% |
|
|
|
(7.67)% |
|
|
|
(6.20)% |
|
|
|
2.03% |
|
| Average premium/(discount) to NAV |
|
|
(3.40)% |
|
|
|
(9.51)% |
|
|
|
(3.29)% |
|
|
|
0.72% |
|
|
|
(1.25)% |
|
| |
|
13
|
|
|
| About the Funds’ Benchmarks |
|
|
Chicago Board Options Exchange (Cboe) Dow Jones Industrial Average
(DJIA) BuyWrite Index (BXDSM): An index designed to measure the performance of a hypothetical
buy-write strategy on the Dow Jones Industrial Average. Index returns assume reinvestment of distributions, but do not reflect any applicable sales charges or management fees.
Chicago Board Options Exchange (Cboe) Nasdaq 100 BuyWrite Index
(BXNSM): An index designed to measure the performance of a hypothetical buy-write strategy on the
Nasdaq 100® Index. Index returns assume reinvestment of distributions, but do not reflect any applicable sales charges or management fees.
Chicago Board Options Exchange (Cboe) S&P 500® BuyWrite
Index (BXMSM): An index designed to measure the performance of a hypothetical buy-write strategy
on the S&P 500® Index. Index returns assume reinvestment of distributions, but do not reflect any applicable sales charges or management fees.
DIAX Blended Benchmark: Consists of: 1) 55% Chicago Board
Options Exchange (Cboe) DJIA BuyWrite Index (BXDSM) (defined herein), and 2) 45% Dow Jones Industrial Average Index (DJIA) (defined herein). Index returns assume reinvestment of distributions, but do not reflect any applicable sales charges or
management fees.
Dow Jones Industrial Average Index (DJIA): An index designed to measure the performance of 30 actively traded U.S. large cap stocks. Index returns assume reinvestment of distributions, but do not reflect any applicable sales charges or management
fees.
JCE Blended Benchmark: Consists of: 1) 50%
S&P 500® Index (defined herein), and 2) 50% Chicago Board Options Exchange (Cboe) S&P 500® BuyWrite Index (BXMSM) (defined
herein). Index returns assume reinvestment of distributions, but do not reflect any applicable sales charges or management fees.
Nasdaq 100® Index: An index that includes 100 of the largest domestic and international non-financial equity securities listed on the Nasdaq Stock Market based on market capitalization. Index returns assume reinvestment of distributions, but do not reflect any applicable sales charges or management
fees.
QQQX Blended Benchmark: Consists of: 1) 55%
Chicago Board Options Exchange (Cboe) Nasdaq 100 BuyWrite Index (BXNSM) (defined herein), and 2) 45% Nasdaq 100® Index (defined herein). Index returns assume reinvestment of distributions, but
do not reflect any applicable sales charges or management fees.
S&P 500® Index: An index generally considered representative of the U.S. equity
market. The index includes 500 leading companies and covers approximately 80% of available market capitalization. Index returns assume reinvestment of distributions, but do not reflect any applicable sales charges or management fees.
SPXX Blended Benchmark: Consists of: 1) 55% Chicago Board
Options Exchange (Cboe) S&P 500® BuyWrite Index (BXMSM) (defined herein), and 2) 45% S&P 500® Index (defined herein). Index
returns assume reinvestment of distributions, but do not reflect any applicable sales charges or management fees.
14
[This page intentionally left blank.]
15
|
|
|
| BXMX |
|
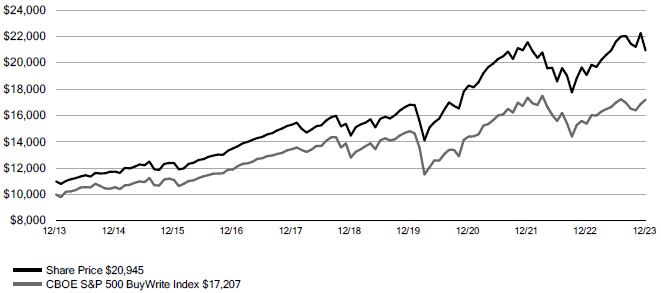
Nuveen S&P 500 Buy-Write Income
Fund Performance Overview and Holding Summaries December 31, 2023 |
Refer to the Glossary of Terms Used in this Report for further definition of the terms used within this section.
Fund Performance*
|
|
|
|
|
|
|
|
|
| |
|
|
|
Total Returns as of
December 31, 2023 |
| |
|
|
|
Average Annual |
| |
|
Inception
Date |
|
1-Year |
|
5-Year |
|
10-Year |
| |
| BXMX at Common Share NAV |
|
10/26/04 |
|
18.84% |
|
9.17% |
|
7.24% |
| |
| BXMX at Common Share Price |
|
10/26/04 |
|
9.05% |
|
8.60% |
|
7.67% |
| |
| Cboe S&P 500® BuyWrite Index (BXMSM) |
|
– |
|
11.82% |
|
6.08% |
|
5.58% |
| |
*For purposes of Fund performance, relative results are measured against the Cboe S&P 500® BuyWrite Index (BXMSM).
Performance data shown represents past performance and does not predict or guarantee
future results. Current performance may be higher or lower than the data shown. Returns do not reflect the deduction of taxes that shareholders may have to pay on Fund distributions or upon the sale of Fund shares. Returns at NAV are net of Fund
expenses, and assume reinvestment of distributions. Comparative index return information is provided for the Fund’s shares at NAV only. Indexes are not available for direct investment.
Daily Common Share NAV and Share Price
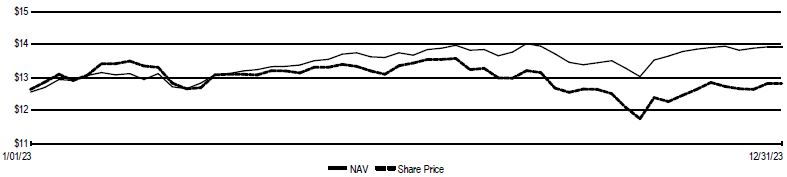
Growth of an Assumed $10,000 Investment as of December 31, 2023 - Common Share
Price
16
Holdings Summaries as of December 31, 2023
This data relates to the securities held in the Fund’s portfolio of investments as of the end of the reporting period. It should not be construed as a measure of
performance for the Fund itself. Holdings are subject to change.
|
|
|
| Fund Allocation
(% of net assets) |
| Common Stocks |
|
99.6% |
| Investments Purchased with
Collateral from Securities
Lending |
|
0.0% |
| Repurchase Agreements |
|
4.3% |
| Other Assets & Liabilities, Net |
|
(3.9)% |
| Net Assets |
|
100% |
|
|
|
| Portfolio Composition
(% of total investments) |
| Software & Services |
|
11.2% |
| Technology Hardware & Equipment |
|
8.4% |
| Semiconductors & Semiconductor Equipment |
|
7.8% |
| Financial Services |
|
7.8% |
| Media & Entertainment |
|
7.7% |
| Pharmaceuticals, Biotechnology & Life Sciences |
|
7.0% |
| Consumer Discretionary Distribution & Retail |
|
5.8% |
| Capital Goods |
|
5.4% |
| Health Care Equipment & Services |
|
5.2% |
| Energy |
|
3.6% |
| Banks |
|
3.3% |
| Food, Beverage & Tobacco |
|
2.5% |
| Materials |
|
2.5% |
| Utilities |
|
2.2% |
| Automobiles & Components |
|
2.0% |
| Equity Real Estate Investment Trusts (REITs) |
|
1.9% |
| Insurance |
|
1.9% |
| Consumer Services |
|
1.9% |
| Consumer Staples Distribution & Retail |
|
1.8% |
| Commercial & Professional Services |
|
1.5% |
| Transportation |
|
1.4% |
| Household & Personal Products |
|
1.4% |
| Consumer Durables & Apparel |
|
0.9% |
| Telecommunication Services |
|
0.7% |
| Investments Purchased with
Collateral from Securities
Lending |
|
0.0% |
| Repurchase Agreements |
|
4.2% |
| Total |
|
100% |
|
|
|
| Top Five Common Stock Holdings
(% of net assets) |
| Microsoft Corp |
|
7.2% |
| Apple Inc |
|
7.2% |
| Amazon.com Inc |
|
3.6% |
| NVIDIA Corp |
|
3.2% |
| Alphabet Inc, Class A |
|
2.2% |
17
|
|
|
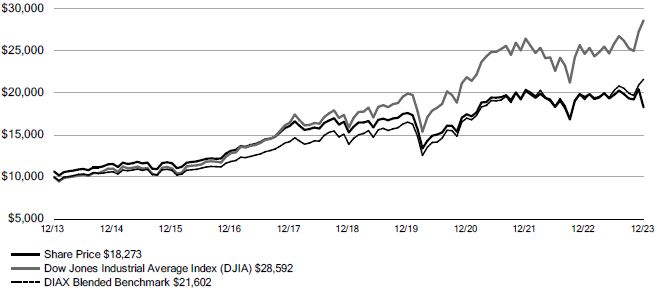
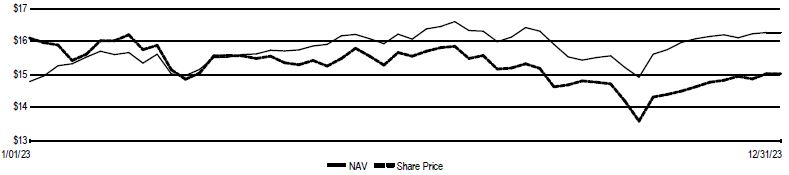
| DIAX |
|
Nuveen Dow 30SM Dynamic Overwrite Fund
Performance Overview and Holding Summaries December 31, 2023 |
Refer to the Glossary of Terms Used in this Report for further definition of the terms used within this section.
Fund Performance*
|
|
|
|
|
|
|
|
|
| |
|
|
|
Total Returns as of
December 31, 2023 |
| |
|
|
|
Average Annual |
| |
|
Inception
Date |
|
1-Year |
|
5-Year |
|
10-Year |
| |
| DIAX at Common Share NAV |
|
4/29/05 |
|
7.67% |
|
6.22% |
|
6.62% |
| |
| DIAX at Common Share Price |
|
4/29/05 |
|
(2.18)% |
|
4.60% |
|
6.21% |
| |
| Dow Jones Industrial Average Index (DJIA) |
|
– |
|
16.18% |
|
12.47% |
|
11.08% |
| |
| DIAX Blended Benchmark |
|
– |
|
12.42% |
|
9.23% |
|
8.01% |
| |
* For purposes of Fund performance, relative results are measured against the DIAX Blended Benchmark. The Fund’s Blended
Benchmark consists of: 1) 55% Chicago Board Options Exchange (Cboe) DJIA BuyWrite Index (BXDSM) and 2) 45% Dow Jones Industrial Average Index (DJIA).
Performance data shown represents past performance and does not predict or guarantee future results. Current performance may be higher or lower than the data shown.
Returns do not reflect the deduction of taxes that shareholders may have to pay on Fund distributions or upon the sale of Fund shares. Returns at NAV are net of Fund expenses, and assume reinvestment of distributions. Comparative index return
information is provided for the Fund’s shares at NAV only. Indexes are not available for direct investment.
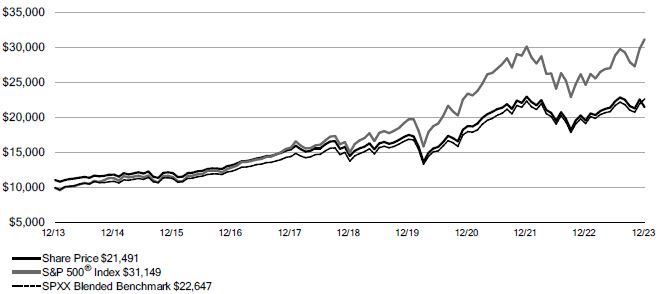
Daily Common Share NAV and Share Price
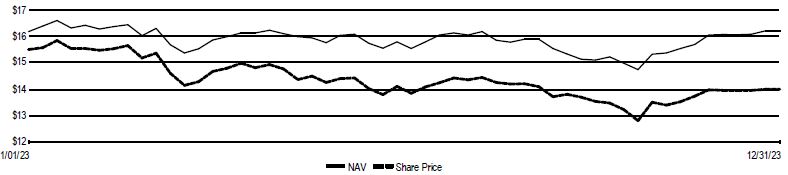
Growth of an Assumed $10,000 Investment as of December 31, 2023 - Common Share
Price
18
Holdings Summaries as of December 31, 2023
This data relates to the securities held in the Fund’s portfolio of investments as of the end of the reporting period. It should not be construed as a measure
of performance for the Fund itself. Holdings are subject to change.
|
|
|
| Fund Allocation
(% of net assets) |
| Common Stocks |
|
99.7% |
| Exchange-Traded Funds |
|
1.3% |
| Options Purchased |
|
0.0% |
| Investments Purchased with
Collateral from Securities
Lending |
|
0.1% |
| Repurchase Agreements |
|
0.2% |
| Other Assets & Liabilities, Net |
|
(1.3)% |
| Net Assets |
|
100% |
|
|
|
| Portfolio Composition1
(% of total investments) |
| Capital Goods |
|
15.1% |
| Financial Services |
|
14.3% |
| Software & Services |
|
13.8% |
| Pharmaceuticals, Biotechnology & Life Sciences |
|
9.5% |
| Health Care Equipment & Services |
|
9.1% |
| Consumer Discretionary Distribution & Retail |
|
6.0% |
| Consumer Services |
|
5.1% |
| Technology Hardware & Equipment |
|
4.2% |
| Insurance |
|
3.3% |
| Consumer Staples Distribution & Retail |
|
3.2% |
| Banks |
|
2.9% |
| Energy |
|
2.6% |
| Household & Personal Products |
|
2.5% |
| Consumer Durables & Apparel |
|
1.9% |
| Media & Entertainment |
|
1.5% |
| Other |
|
3.4% |
| Exchange-Traded Funds |
|
1.3% |
| Options Purchased |
|
0.0% |
| Investments Purchased with
Collateral from Securities
Lending |
|
0.1% |
| Repurchase Agreements |
|
0.2% |
| Total Investments |
|
100% |
|
|
|
| Top Five Common Stock Holdings
(% of net assets) |
| UnitedHealth Group Inc |
|
9.2% |
| Goldman Sachs Group Inc/The |
|
6.7% |
| Microsoft Corp |
|
6.6% |
| Home Depot Inc/The |
|
6.0% |
| McDonald’s Corp |
|
5.2% |
| 1 |
See the Portfolio of Investments for the remaining industries/sectors comprising “Other” and not listed in
the table above. |
19
|
|
|
| SPXX |
|
Nuveen S&P 500 Dynamic Overwrite Fund
Performance Overview and Holding Summaries as of December 31, 2023 |
Refer to the Glossary of Terms Used in this Report for further definition of the terms used within this section.
Fund Performance*
|
|
|
|
|
|
|
|
|
| |
|
|
|
Total Returns as of
December 31, 2023 |
| |
|
|
|
Average Annual |
| |
|
Inception
Date |
|
1-Year |
|
5-Year |
|
10-Year |
| |
| SPXX at Common Share NAV |
|
11/22/05 |
|
18.45% |
|
9.67% |
|
7.38% |
| |
| SPXX at Common Share Price |
|
11/22/05 |
|
0.75% |
|
8.71% |
|
7.95% |
| |
| S&P 500® Index |
|
– |
|
26.29% |
|
15.69% |
|
12.03% |
| |
| SPXX Blended Benchmark |
|
– |
|
18.24% |
|
10.42% |
|
8.52% |
| |
*For purposes of Fund performance, relative results are measured against the SPXX Blended Benchmark. The Fund’s Blended Benchmark
consists of: 1) 55% Chicago Board Options Exchange (Cboe) S&P 500® BuyWrite Index (BXMSM) and 2) 45% S&P 500® Index.
Performance data shown represents past performance and does not predict or guarantee future results.
Current performance may be higher or lower than the data shown. Returns do not reflect the deduction of taxes that shareholders may have to pay on Fund distributions or upon the sale of Fund shares. Returns at NAV are net of Fund expenses, and
assume reinvestment of distributions. Comparative index return information is provided for the Fund’s shares at NAV only. Indexes are not available for direct investment.
Daily Common Share NAV and Share Price
20
Growth of an Assumed $10,000 Investment as of December 31, 2023 -
Common Share Price
21
Performance Overview and Holdings Summaries December 31, 2023 (continued)
Holdings Summaries as of December 31, 2023
This data relates to the securities held in the Fund’s portfolio of investments as of the end of the reporting period. It should not be construed as a measure of
performance for the Fund itself. Holdings are subject to change.
|
|
|
| Fund Allocation
(% of net assets) |
|
|
| Common Stocks |
|
99.3% |
| Exchange-Traded Funds |
|
1.5% |
| Options Purchased |
|
0.0% |
| Investments Purchased with Collateral from Securities
Lending |
|
1.0% |
| Repurchase Agreements |
|
0.2% |
| Other Assets & Liabilities, Net |
|
(2.0)% |
| Net Assets |
|
100% |
|
|
|
| Portfolio Composition1
(% of total investments) |
|
|
| Software & Services |
|
10.4% |
| Technology Hardware & Equipment |
|
8.2% |
| Financial Services |
|
8.1% |
| Media & Entertainment |
|
7.8% |
| Semiconductors & Semiconductor Equipment |
|
7.6% |
| Pharmaceuticals, Biotechnology & Life Sciences |
|
7.3% |
| Health Care Equipment & Services |
|
5.6% |
| Capital Goods |
|
5.6% |
| Consumer Discretionary Distribution & Retail |
|
5.4% |
| Energy |
|
3.9% |
| Banks |
|
3.4% |
| Food, Beverage & Tobacco |
|
2.9% |
| Equity Real Estate Investment Trusts (REITs) |
|
2.7% |
| Utilities |
|
2.6% |
| Insurance |
|
2.3% |
| Consumer Services |
|
2.2% |
| Consumer Staples Distribution & Retail |
|
2.1% |
| Materials |
|
2.1% |
| Automobiles & Components |
|
2.1% |
| Transportation |
|
1.6% |
| Household & Personal Products |
|
1.1% |
| Consumer Durables & Apparel |
|
1.1% |
| Commercial & Professional Services |
|
0.6% |
| Other |
|
0.6% |
| Exchange-Traded Funds |
|
1.5% |
| Options Purchased |
|
0.0% |
| Investments Purchased with Collateral from Securities
Lending |
|
1.0% |
| Repurchase Agreements |
|
0.2% |
| Total |
|
100% |
|
|
|
| Top Five Common Stock Holdings
(% of net assets) |
|
|
| Apple Inc |
|
7.2% |
| Microsoft Corp |
|
7.1% |
| Amazon.com Inc |
|
3.5% |
| NVIDIA Corp |
|
3.1% |
| Alphabet Inc, Class A |
|
2.1% |
| 1 |
See the Portfolio of Investments for the remaining industries/sectors comprising “Other” and not listed in
the table above. |
22
|
|
|
| QQQX |
|
Nuveen Nasdaq 100 Dynamic Overwrite Fund |
|
|
Performance Overview and Holding Summaries as of December 31, 2023 |
Refer to the Glossary of Terms Used in this Report for further definition of the terms used within this section.
Fund Performance*
|
|
|
|
|
|
|
|
|
|
|
|
|
|
|
| |
|
|
|
|
Total Returns as of
December 31, 2023 |
| |
|
|
|
|
Average Annual |
| |
|
Inception
Date |
|
|
1-Year |
|
|
5-Year |
|
|
10-Year |
| QQQX at Common Share NAV |
|
|
1/30/07 |
|
|
|
35.03% |
|
|
|
11.69% |
|
|
10.46% |
| QQQX at Common Share Price |
|
|
1/30/07 |
|
|
|
21.78% |
|
|
|
10.62% |
|
|
10.32% |
| Nasdaq 100®
Index |
|
|
– |
|
|
|
55.13% |
|
|
|
22.66% |
|
|
17.91% |
| QQQX Blended Benchmark |
|
|
– |
|
|
|
37.22% |
|
|
|
14.11% |
|
|
11.86% |
* For purposes of Fund performance, relative results are measured against the QQQX Blended Benchmark. The Fund’s Blended Benchmark
consists of: 1) 55% Chicago Board Options Exchange (Cboe) Nasdaq 100 BuyWrite Index (BXNSM) and 2) 45% Nasdaq 100® Index.
Performance data shown represents past performance and does not predict or guarantee future results. Current performance may be higher or lower than the data shown.
Returns do not reflect the deduction of taxes that shareholders may have to pay on Fund distributions or upon the sale of Fund shares. Returns at NAV are net of Fund expenses, and assume reinvestment of distributions. Comparative index return
information is provided for the Fund’s shares at NAV only. Indexes are not available for direct investment.
Daily Common Share NAV and Share Price
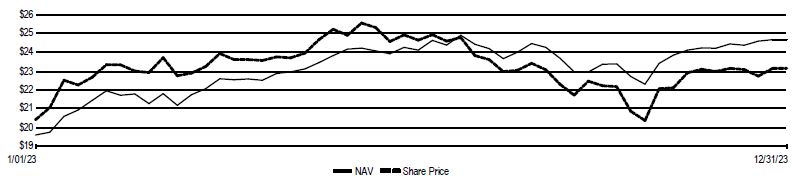
23
Growth of an Assumed $10,000 Investment as of December 31, 2023 - Common Share Price
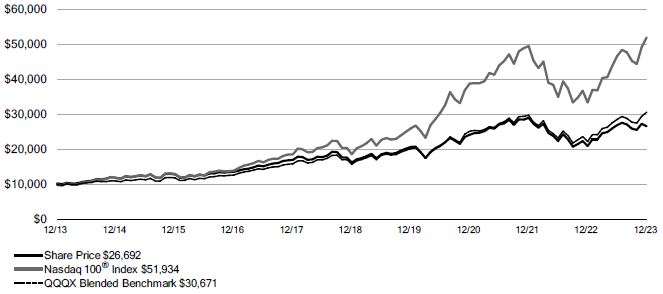
24
Holdings Summaries as of December 31, 2023
This data relates to the securities held in the Fund’s portfolio of investments as of the end of the reporting period. It should not be construed as a measure
of performance for the Fund itself. Holdings are subject to change.
|
|
|
| Fund Allocation
(% of net assets) |
|
|
| Common Stocks |
|
100.0% |
| Exchange-Traded Funds |
|
1.2% |
| Options Purchased |
|
0.0% |
| Investments Purchased with Collateral from Securities
Lending |
|
0.1% |
| Repurchase Agreements |
|
0.1% |
| Other Assets & Liabilities, Net |
|
(1.4)% |
| Net Assets |
|
100% |
|
|
|
| Portfolio Composition1
(% of total investments) |
|
|
| Semiconductors & Semiconductor Equipment |
|
19.2% |
| Media & Entertainment |
|
16.6% |
| Software & Services |
|
15.7% |
| Technology Hardware & Equipment |
|
13.9% |
| Consumer Discretionary Distribution & Retail |
|
6.8% |
| Pharmaceuticals, Biotechnology & Life Sciences |
|
4.9% |
| Automobiles & Components |
|
3.5% |
| Food, Beverage & Tobacco |
|
3.1% |
| Consumer Services |
|
3.1% |
| Financial Services |
|
2.3% |
| Consumer Staples Distribution & Retail |
|
2.1% |
| Health Care Equipment & Services |
|
1.8% |
| Capital Goods |
|
1.3% |
| Utilities |
|
1.2% |
| Transportation |
|
0.7% |
| Commercial & Professional Services |
|
0.6% |
| Telecommunication Services |
|
0.4% |
| Consumer Durables & Apparel |
|
0.4% |
| Energy |
|
0.3% |
| Materials |
|
0.3% |
| Household & Personal Products |
|
0.2% |
| Equity Real Estate Investment Trusts (REITs) |
|
0.2% |
| Other |
|
0.0% |
| Exchange-Traded Funds |
|
1.2% |
| Options Purchased |
|
0.0% |
| Investments Purchased with Collateral from Securities
Lending |
|
0.1% |
| Repurchase Agreements |
|
0.1% |
| Total |
|
100% |
|
|
|
| Top Five Common Stock Holdings
(% of net assets) |
|
|
| Apple Inc |
|
11.9% |
| Microsoft Corp |
|
11.4% |
| Alphabet Inc, Class A |
|
5.1% |
| Amazon.com Inc |
|
5.0% |
| Meta Platforms Inc |
|
4.7% |
| 1 |
See the Portfolio of Investments for the remaining industries/sectors comprising “Other” and not listed in
the table above. |
25
|
|
|
| JCE |
|
Nuveen Core Equity Alpha Fund |
|
|
Performance Overview and Holding Summaries as of December 31, 2023 |
Refer to the Glossary of Terms Used in this Report for further definition of the terms used within this section.
Fund Performance*
|
|
|
|
|
|
|
|
|
|
|
|
|
|
|
|
|
| |
|
|
|
|
Total Returns as of
December 31, 2023 |
|
| |
|
|
|
|
Average Annual |
|
| |
|
Inception
Date |
|
|
1-Year |
|
|
5-Year |
|
|
10-Year |
|
| JCE at Common Share NAV |
|
|
3/27/07 |
|
|
|
21.68% |
|
|
|
11.94% |
|
|
|
8.85% |
|
| JCE at Common Share Price |
|
|
3/27/07 |
|
|
|
10.60% |
|
|
|
13.60% |
|
|
|
9.93% |
|
| S&P 500®
Index |
|
|
– |
|
|
|
26.29% |
|
|
|
15.69% |
|
|
|
12.03% |
|
| JCE Blended Benchmark |
|
|
– |
|
|
|
18.96% |
|
|
|
10.90% |
|
|
|
8.84% |
|
*For purposes of Fund performance, relative results are measured against the JCE Blended Benchmark. The Fund’s Blended Benchmark
consists of: 1) 50% S&P 500® Index and 2) 50% Chicago Board Options Exchange (Cboe) S&P 500® BuyWrite Index (BXMSM).
Performance data shown represents past performance and does not predict or guarantee future results. Current
performance may be higher or lower than the data shown. Returns do not reflect the deduction of taxes that shareholders may have to pay on Fund distributions or upon the sale of Fund shares. Returns at NAV are net of Fund expenses, and assume
reinvestment of distributions. Comparative index return information is provided for the Fund’s shares at NAV only. Indexes are not available for direct investment.
Daily Common Share NAV and Share Price
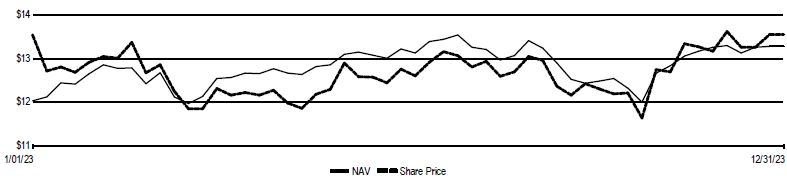
26
Growth of an Assumed $10,000 Investment as of December 31, 2023 - Common Share Price
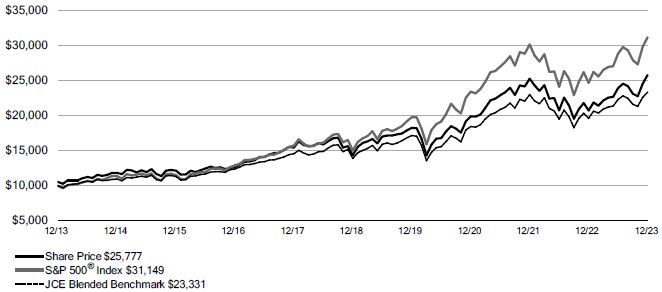
27
Performance Overview and Holdings Summaries December 31, 2023 (continued)
Holdings Summaries as of December 31, 2023
This data relates to the securities held in the Fund’s portfolio of investments as of the end of the reporting period. It should not be construed as a measure
of performance for the Fund itself. Holdings are subject to change.
|
|
|
| Fund Allocation
(% of net assets) |
|
|
| Common Stocks |
|
99.6% |
| Exchange-Traded Funds |
|
0.5% |
| Options Purchased |
|
0.0% |
| Repurchase Agreements |
|
0.2% |
| Other Assets & Liabilities, Net |
|
(0.3)% |
| Net Assets |
|
100% |
|
|
|
| Portfolio Composition1
(% of total investments) |
|
|
| Software & Services |
|
12.3% |
| Capital Goods |
|
10.1% |
| Technology Hardware & Equipment |
|
9.2% |
| Pharmaceuticals, Biotechnology & Life Sciences |
|
7.9% |
| Media & Entertainment |
|
7.5% |
| Financial Services |
|
7.3% |
| Consumer Discretionary Distribution & Retail |
|
7.2% |
| Semiconductors & Semiconductor Equipment |
|
5.9% |
| Health Care Equipment & Services |
|
5.6% |
| Energy |
|
3.8% |
| Food, Beverage & Tobacco |
|
3.2% |
| Consumer Staples Distribution & Retail |
|
2.2% |
| Commercial & Professional Services |
|
2.2% |
| Household & Personal Products |
|
1.9% |
| Banks |
|
1.9% |
| Materials |
|
1.8% |
| Insurance |
|
1.8% |
| Consumer Services |
|
1.7% |
| Utilities |
|
1.5% |
| Consumer Durables & Apparel |
|
1.5% |
| Equity Real Estate Investment Trusts (REITs) |
|
1.2% |
| Automobiles & Components |
|
1.1% |
| Real Estate Management & Development |
|
0.2% |
| Other |
|
0.3% |
| Exchange-Traded Funds |
|
0.5% |
| Options Purchased |
|
0.0% |
| Repurchase Agreements |
|
0.2% |
| Total |
|
100% |
|
|
|
| Top Five Common Stock Holdings
(% of net assets) |
|
|
| Apple Inc |
|
7.8% |
| Microsoft Corp |
|
7.8% |
| Amazon.com Inc |
|
4.1% |
| NVIDIA Corp |
|
3.8% |
| Alphabet Inc, Class C |
|
2.4% |
| 1 |
See the Portfolio of Investments for the remaining industries/sectors comprising “Other” and not listed in the
table above. |
28
Report of Independent Registered
Public Accounting Firm
To the Board of Trustees and Shareholders of Nuveen S&P 500 Buy-Write
Income Fund, Nuveen Dow 30SM Dynamic Overwrite Fund, Nuveen S&P 500 Dynamic Overwrite Fund, Nuveen Nasdaq 100 Dynamic Overwrite Fund and Nuveen Core Equity Alpha Fund
Opinions on the Financial Statements
We have audited the accompanying
statements of assets and liabilities, including the portfolios of investments, of Nuveen S&P 500 Buy-Write Income Fund, Nuveen Dow 30SM Dynamic Overwrite Fund, Nuveen S&P 500 Dynamic Overwrite Fund,
Nuveen Nasdaq 100 Dynamic Overwrite Fund and Nuveen Core Equity Alpha Fund (hereafter collectively referred to as the “Funds”) as of December 31, 2023, the related statements of operations for the year ended December 31, 2023,
the statements of changes in net assets for each of the two years in the period ended December 31, 2023, including the related notes, and the financial highlights for each of the five years in the period ended December 31, 2023
(collectively referred to as the “financial statements”). In our opinion, the financial statements present fairly, in all material respects, the financial position of each of the Funds as of December 31, 2023, the results of each of
their operations for the year then ended, the changes in each of their net assets for each of the two years in the period ended December 31, 2023 and each of the financial highlights for each of the five years in the period ended
December 31, 2023 in conformity with accounting principles generally accepted in the United States of America.
Basis for Opinions
These financial statements are the responsibility of the Funds’ management. Our responsibility is to express an opinion on the Funds’ financial statements
based on our audits. We are a public accounting firm registered with the Public Company Accounting Oversight Board (United States) (PCAOB) and are required to be independent with respect to the Funds in accordance with the U.S. federal securities
laws and the applicable rules and regulations of the Securities and Exchange Commission and the PCAOB.
We conducted our audits of these financial statements in
accordance with the standards of the PCAOB. Those standards require that we plan and perform the audit to obtain reasonable assurance about whether the financial statements are free of material misstatement, whether due to error or fraud.
Our audits included performing procedures to assess the risks of material misstatement of the financial statements, whether due to error or fraud, and performing
procedures that respond to those risks. Such procedures included examining, on a test basis, evidence regarding the amounts and disclosures in the financial statements. Our audits also included evaluating the accounting principles used and
significant estimates made by management, as well as evaluating the overall presentation of the financial statements. Our procedures included confirmation of securities owned as of December 31, 2023 by correspondence with the custodian and
brokers. We believe that our audits provide a reasonable basis for our opinions.
/s/ PricewaterhouseCoopers LLP
Chicago, Illinois
February 28, 2024
We have served as the auditor of one or more investment companies in Nuveen Funds since 2002.
29
|
|
|
| BXMX |
|
Nuveen S&P 500 Buy-Write Income Fund |
|
|
Portfolio of Investments December 31, 2023 |
|
|
|
|
|
|
|
|
|
| Shares |
|
|
|
Description (a) |
|
Value |
|
|
|
|
LONG-TERM INVESTMENTS - 99.6% |
|
|
|
|
|
|
|
|
COMMON STOCKS - 99.6% (b) |
|
|
|
|
|
|
|
|
|
|
|
|
Automobiles & Components - 2.1% |
|
|
|
|
| 277,036 |
|
|
|
Ford Motor Co |
|
$ |
3,377,069 |
|
| 50,606 |
|
|
|
Gentex Corp |
|
|
1,652,792 |
|
| 9,851 |
|
(c) |
|
Goodyear Tire & Rubber Co/The |
|
|
141,066 |
|
| 103,640 |
|
(c) |
|
Tesla Inc |
|
|
25,752,467 |
|
|
|
|
|
Total Automobiles & Components |
|
|
30,923,394 |
|
|
|
|
|
|
|
|
|
|
|
|
|
|
|
Banks - 3.4% |
|
|
|
|
| 319,502 |
|
|
|
Bank of America Corp |
|
|
10,757,632 |
|
| 90,578 |
|
|
|
Citigroup Inc |
|
|
4,659,332 |
|
| 26,341 |
|
|
|
Comerica Inc |
|
|
1,470,091 |
|
| 106,516 |
|
|
|
Fifth Third Bancorp |
|
|
3,673,737 |
|
| 51,859 |
|
|
|
First Horizon Corp |
|
|
734,324 |
|
| 128,335 |
|
|
|
JPMorgan Chase & Co |
|
|
21,829,784 |
|
| 148,632 |
|
|
|
KeyCorp |
|
|
2,140,301 |
|
| 18,266 |
|
|
|
M&T Bank Corp |
|
|
2,503,903 |
|
| 31,763 |
|
|
|
Zions Bancorp NA |
|
|
1,393,443 |
|
|
|
|
|
Total Banks |
|
|
49,162,547 |
|
|
|
|
|
|
|
|
|
|
|
|
|
|
|
Capital Goods - 5.6% |
|
|
|
|
| 17,715 |
|
|
|
Allegion plc |
|
|
2,244,313 |
|
| 31,219 |
|
(c) |
|
Boeing Co/The |
|
|
8,137,545 |
|
| 29,025 |
|
|
|
Caterpillar Inc |
|
|
8,581,822 |
|
| 64,570 |
|
|
|
CNH Industrial NV |
|
|
786,463 |
|
| 46,441 |
|
|
|
Emerson Electric Co |
|
|
4,520,102 |
|
| 8,843 |
|
|
|
Ferguson PLC |
|
|
1,707,318 |
|
| 5,450 |
|
|
|
Fortune Brands Innovations Inc |
|
|
414,963 |
|
| 44,459 |
|
|
|
General Electric Co |
|
|
5,674,302 |
|
| 31,851 |
|
|
|
Graco Inc |
|
|
2,763,393 |
|
| 9,566 |
|
|
|
HEICO Corp |
|
|
1,711,070 |
|
| 44,930 |
|
|
|
Honeywell International Inc |
|
|
9,422,270 |
|
| 8,860 |
|
|
|
Hubbell Inc |
|
|
2,914,320 |
|
| 43,726 |
|
|
|
Masco Corp |
|
|
2,928,767 |
|
| 9,120 |
|
|
|
Northrop Grumman Corp |
|
|
4,269,437 |
|
| 51,863 |
|
|
|
Otis Worldwide Corp |
|
|
4,640,183 |
|
| 15,767 |
|
|
|
Parker-Hannifin Corp |
|
|
7,263,857 |
|
| 99,428 |
|
|
|
Raytheon Technologies Corp |
|
|
8,365,872 |
|
| 10,242 |
|
|
|
Rockwell Automation Inc |
|
|
3,179,936 |
|
| 10,383 |
|
|
|
Timken Co/The |
|
|
832,197 |
|
| 4,597 |
|
|
|
Woodward Inc |
|
|
625,790 |
|
|
|
|
|
Total Capital Goods |
|
|
80,983,920 |
|
|
|
|
|
|
|
|
|
|
|
|
|
|
|
Commercial & Professional Services - 1.5% |
|
|
|
|
| 28,578 |
|
|
|
Automatic Data Processing Inc |
|
|
6,657,817 |
|
| 9,115 |
|
|
|
Booz Allen Hamilton Holding Corp |
|
|
1,165,900 |
|
| 29,484 |
|
(c) |
|
CoStar Group Inc |
|
|
2,576,607 |
|
| 9,803 |
|
|
|
ManpowerGroup Inc |
|
|
779,044 |
|
| 15,652 |
|
|
|
SS&C Technologies Holdings Inc |
|
|
956,494 |
|
| 11,679 |
|
|
|
TransUnion |
|
|
802,464 |
|
| 14,343 |
|
|
|
Waste Connections Inc |
|
|
2,140,979 |
|
| 37,983 |
|
|
|
Waste Management Inc |
|
|
6,802,755 |
|
|
|
|
|
Total Commercial & Professional Services |
|
|
21,882,060 |
|
|
|
|
|
|
|
30
|
|
|
|
|
|
|
|
|
| Shares |
|
|
|
Description (a) |
|
Value |
|
|
|
|
|
|
|
|
Consumer Discretionary Distribution & Retail - 6.0% |
|
|
|
|
| 345,650 |
|
(c) |
|
Amazon.com Inc |
|
$ |
52,518,061 |
|
| 8,358 |
|
|
|
American Eagle Outfitters Inc |
|
|
176,855 |
|
| 37,972 |
|
|
|
Best Buy Co Inc |
|
|
2,972,448 |
|
| 2,461 |
|
(c) |
|
Burlington Stores Inc |
|
|
478,615 |
|
| 4,252 |
|
|
|
Dick’s Sporting Goods Inc |
|
|
624,832 |
|
| 4,736 |
|
(c) |
|
Five Below Inc |
|
|
1,009,526 |
|
| 50,051 |
|
|
|
Home Depot Inc/The |
|
|
17,345,174 |
|
| 15,200 |
|
|
|
JD.com Inc, ADR |
|
|
439,128 |
|
| 41,932 |
|
|
|
LKQ Corp |
|
|
2,003,930 |
|
| 29,953 |
|
|
|
Lowe’s Cos Inc |
|
|
6,666,040 |
|
| 12,760 |
|
|
|
Macy’s Inc |
|
|
256,731 |
|
| 173 |
|
(c) |
|
MercadoLibre Inc |
|
|
271,877 |
|
| 16,563 |
|
|
|
Nordstrom Inc |
|
|
305,587 |
|
| 4,728 |
|
(c) |
|
Ulta Beauty Inc |
|
|
2,316,673 |
|
|
|
|
|
Total Consumer Discretionary Distribution & Retail |
|
|
87,385,477 |
|
|
|
|
|
|
|
|
|
|
|
|
|
|
|
Consumer Durables & Apparel - 1.0% |
|
|
|
|
| 32,919 |
|
|
|
KB Home |
|
|
2,056,121 |
|
| 6,689 |
|
|
|
Kontoor Brands Inc |
|
|
417,527 |
|
| 5,984 |
|
(c) |
|
Lululemon Athletica Inc |
|
|
3,059,559 |
|
| 25,861 |
|
(c) |
|
Mattel Inc |
|
|
488,256 |
|
| 46,591 |
|
|
|
NIKE Inc, Class B |
|
|
5,058,385 |
|
| 6,048 |
|
|
|
Polaris Inc |
|
|
573,169 |
|
| 6,575 |
|
(c) |
|
TopBuild Corp |
|
|
2,460,759 |
|
|
|
|
|
Total Consumer Durables & Apparel |
|
|
14,113,776 |
|
|
|
|
|
|
|
|
|
|
|
|
|
|
|
Consumer Services - 2.0% |
|
|
|
|
| 2,100 |
|
(c) |
|
Booking Holdings Inc |
|
|
7,449,162 |
|
| 29,264 |
|
|
|
Marriott International Inc/MD, Class A |
|
|
6,599,325 |
|
| 28,877 |
|
|
|
McDonald’s Corp |
|
|
8,562,319 |
|
| 16,077 |
|
|
|
Restaurant Brands International Inc |
|
|
1,256,096 |
|
| 51,807 |
|
|
|
Starbucks Corp |
|
|
4,973,990 |
|
| 7,792 |
|
|
|
Yum China Holdings Inc |
|
|
330,615 |
|
|
|
|
|
Total Consumer Services |
|
|
29,171,507 |
|
|
|
|
|
|
|
|
|
|
|
|
|
|
|
Consumer Staples Distribution & Retail - 1.9% |
|
|
|
|
| 4,507 |
|
|
|
Casey’s General Stores Inc |
|
|
1,238,253 |
|
| 22,194 |
|
|
|
Costco Wholesale Corp |
|
|
14,649,816 |
|
| 33,364 |
|
|
|
Target Corp |
|
|
4,751,701 |
|
| 15,913 |
|
(c) |
|
US Foods Holding Corp |
|
|
722,609 |
|
| 34,973 |
|
|
|
Walmart Inc |
|
|
5,513,493 |
|
|
|
|
|
Total Consumer Staples Distribution & Retail |
|
|
26,875,872 |
|
|
|
|
|
|
|
|
|
|
|
|
|
|
|
Energy - 3.8% |
|
|
|
|
| 44,283 |
|
|
|
Cenovus Energy Inc |
|
|
737,312 |
|
| 8,394 |
|
|
|
Cheniere Energy Inc |
|
|
1,432,940 |
|
| 77,267 |
|
|
|
Chevron Corp |
|
|
11,525,146 |
|
| 9,675 |
|
(c) |
|
CNX Resources Corp |
|
|
193,500 |
|
| 64,103 |
|
|
|
ConocoPhillips |
|
|
7,440,435 |
|
| 3,176 |
|
|
|
Enbridge Inc |
|
|
114,399 |
|
| 166,691 |
|
|
|
Exxon Mobil Corp |
|
|
16,665,766 |
|
| 82,234 |
|
|
|
Halliburton Co |
|
|
2,972,759 |
|
| 25,709 |
|
|
|
Hess Corp |
|
|
3,706,209 |
|
| 30,656 |
|
|
|
Marathon Petroleum Corp |
|
|
4,548,124 |
|
| 21,104 |
|
|
|
Ovintiv Inc |
|
|
926,888 |
|
| 77,600 |
|
|
|
Schlumberger NV |
|
|
4,038,304 |
|
| 19,719 |
|
|
|
TC Energy Corp |
|
|
770,816 |
|
|
|
|
|
Total Energy |
|
|
55,072,598 |
|
|
|
|
|
|
|
31
|
|
|
| BXMX |
|
Nuveen S&P 500 Buy-Write Income Fund (continued) |
|
|
Portfolio of Investments December 31, 2023 |
|
|
|
|
|
|
|
|
|
| Shares |
|
|
|
Description (a) |
|
Value |
|
|
|
|
|
|
|
|
Equity Real Estate Investment Trusts (REITs) - 2.0% |
|
|
|
|
| 123,237 |
|
|
|
American Homes 4 Rent, Class A |
|
$ |
4,431,603 |
|
| 29,177 |
|
|
|
American Tower Corp |
|
|
6,298,731 |
|
| 17,121 |
|
|
|
Apartment Income REIT Corp |
|
|
594,612 |
|
| 23,114 |
|
(c) |
|
Apartment Investment and Management Co, Class A |
|
|
180,983 |
|
| 55,269 |
|
|
|
CubeSmart |
|
|
2,561,718 |
|
| 41,595 |
|
|
|
Equity Commonwealth |
|
|
798,624 |
|
| 76,284 |
|
|
|
Gaming and Leisure Properties Inc |
|
|
3,764,615 |
|
| 115,870 |
|
|
|
Invitation Homes Inc |
|
|
3,952,326 |
|
| 19,823 |
|
|
|
LXP Industrial Trust |
|
|
196,644 |
|
| 8,339 |
|
|
|
Sabra Health Care REIT Inc |
|
|
118,998 |
|
| 11,688 |
|
|
|
Sun Communities Inc |
|
|
1,562,101 |
|
| 142,164 |
|
|
|
Weyerhaeuser Co |
|
|
4,943,042 |
|
|
|
|
|
Total Equity Real Estate Investment Trusts (REITs) |
|
|
29,403,997 |
|
|
|
|
|
|
|
|
|
|
|
|
|
|
|
Financial Services - 8.1% |
|
|
|
|
| 26,095 |
|
|
|
Annaly Capital Management Inc |
|
|
505,460 |
|
| 81,706 |
|
(c) |
|
Berkshire Hathaway Inc, Class B |
|
|
29,141,262 |
|
| 20,528 |
|
(c) |
|
Block Inc |
|
|
1,587,841 |
|
| 53,704 |
|
|
|
Brookfield Corp |
|
|
2,154,604 |
|
| 71,247 |
|
|
|
Charles Schwab Corp/The |
|
|
4,901,794 |
|
| 23,102 |
|
|
|
CME Group Inc |
|
|
4,865,281 |
|
| 42,085 |
|
|
|
Discover Financial Services |
|
|
4,730,354 |
|
| 44,488 |
|
|
|
Intercontinental Exchange Inc |
|
|
5,713,594 |
|
| 53,398 |
|
|
|
Jefferies Financial Group Inc |
|
|
2,157,813 |
|
| 27,800 |
|
|
|
KKR & Co Inc |
|
|
2,303,230 |
|
| 4,247 |
|
|
|
LPL Financial Holdings Inc |
|
|
966,702 |
|
| 27,428 |
|
|
|
Mastercard Inc, Class A |
|
|
11,698,316 |
|
| 48,313 |
|
|
|
MGIC Investment Corp |
|
|
931,958 |
|
| 63,058 |
|
|
|
Morgan Stanley |
|
|
5,880,159 |
|
| 2,104 |
|
|
|
Morningstar Inc |
|
|
602,249 |
|
| 8,344 |
|
|
|
MSCI Inc |
|
|
4,719,784 |
|
| 72,467 |
|
(c) |
|
PayPal Holdings Inc |
|
|
4,450,198 |
|
| 19,659 |
|
|
|
S&P Global Inc |
|
|
8,660,183 |
|
| 89,957 |
|
|
|
SLM Corp |
|
|
1,719,978 |
|
| 75,786 |
|
|
|
Visa Inc, Class A |
|
|
19,730,885 |
|
|
|
|
|
Total Financial Services |
|
|
117,421,645 |
|
|
|
|
|
|
|
|
|
|
|
|
|
|
|
Food, Beverage & Tobacco - 2.6% |
|
|
|
|
| 107,234 |
|
|
|
Altria Group Inc |
|
|
4,325,819 |
|
| 13,365 |
|
|
|
British American Tobacco PLC, Sponsored ADR |
|
|
391,461 |
|
| 229,003 |
|
|
|
Coca-Cola Co/The |
|
|
13,495,147 |
|
| 33,408 |
|
|
|
Coca-Cola Europacific Partners PLC |
|
|
2,229,650 |
|
| 21,845 |
|
|
|
Hormel Foods Corp |
|
|
701,443 |
|
| 51,527 |
|
|
|
Keurig Dr Pepper Inc |
|
|
1,716,880 |
|
| 132,012 |
|
|
|
Mondelez International Inc, Class A |
|
|
9,561,629 |
|
| 80,074 |
|
(c) |
|
Monster Beverage Corp |
|
|
4,613,063 |
|
| 12,100 |
|
(c) |
|
Post Holdings Inc |
|
|
1,065,526 |
|
|
|
|
|
Total Food, Beverage & Tobacco |
|
|
38,100,618 |
|
|
|
|
|
|
|
|
|
|
|
|
|
|
|
Health Care Equipment & Services - 5.4% |
|
|
|
|
| 96,418 |
|
|
|
Abbott Laboratories |
|
|
10,612,729 |
|
| 30,067 |
|
|
|
Alcon Inc |
|
|
2,348,834 |
|
| 116,361 |
|
(c) |
|
Boston Scientific Corp |
|
|
6,726,829 |
|
| 18,081 |
|
|
|
Cigna Group/The |
|
|
5,414,355 |
|
| 54,401 |
|
|
|
CVS Health Corp |
|
|
4,295,503 |
|
| 14,592 |
|
|
|
Elevance Health Inc |
|
|
6,881,004 |
|
| 34,740 |
|
|
|
GE HealthCare Technologies Inc |
|
|
2,686,097 |
|
| 16,250 |
|
|
|
HCA Healthcare Inc |
|
|
4,398,550 |
|
32
|
|
|
|
|
|
|
|
|
| Shares |
|
|
|
Description (a) |
|
Value |
|
|
|
|
|
|
|
|
Health Care Equipment & Services (continued) |
|
|
|
|
| 8,853 |
|
(c) |
|
IDEXX Laboratories Inc |
|
$ |
4,913,858 |
|
| 99,846 |
|
|
|
Medtronic PLC |
|
|
8,225,313 |
|
| 40,367 |
|
|
|
UnitedHealth Group Inc |
|
|
21,252,015 |
|
| 638 |
|
(c) |
|
Veeva Systems Inc, Class A |
|
|
122,828 |
|
|
|
|
|
Total Health Care Equipment & Services |
|
|
77,877,915 |
|
|
|
|
|
|
|
|
|
|
|
|
|
|
|
Household & Personal Products - 1.4% |
|
|
|
|
| 15,340 |
|
(c) |
|
BellRing Brands Inc |
|
|
850,296 |
|
| 131,517 |
|
|
|
Procter & Gamble Co/The |
|
|
19,272,501 |
|
| 6,327 |
|
|
|
Spectrum Brands Holdings Inc |
|
|
504,705 |
|
|
|
|
|
Total Household & Personal Products |
|
|
20,627,502 |
|
|
|
|
|
|
|
|
|
|
|
|
|
|
|
Insurance - 2.0% |
|
|
|
|
| 28,004 |
|
|
|
Allstate Corp/The |
|
|
3,920,000 |
|
| 34,937 |
|
|
|
Arthur J Gallagher & Co |
|
|
7,856,633 |
|
| 37,130 |
|
|
|
CNO Financial Group Inc |
|
|
1,035,927 |
|
| 23,577 |
|
|
|
Fidelity National Financial Inc |
|
|
1,202,898 |
|
| 38,545 |
|
|
|
Hartford Financial Services Group Inc/The |
|
|
3,098,247 |
|
| 9,393 |
|
|
|
Lincoln National Corp |
|
|
253,329 |
|
| 3,360 |
|
|
|
RenaissanceRe Holdings Ltd |
|
|
658,560 |
|
| 32,951 |
|
|
|
Travelers Cos Inc/The |
|
|
6,276,836 |
|
| 71,665 |
|
|
|
W R Berkley Corp |
|
|
5,068,149 |
|
|
|
|
|
Total Insurance |
|
|
29,370,579 |
|
|
|
|
|
|
|
|
|
|
|
|
|
|
|
Materials - 2.6% |
|
|
|
|
| 9,313 |
|
|
|
Avery Dennison Corp |
|
|
1,882,716 |
|
| 74,375 |
|
|
|
Barrick Gold Corp |
|
|
1,345,444 |
|
| 16,669 |
|
|
|
Chemours Co/The |
|
|
525,740 |
|
| 52,881 |
|
|
|
Corteva Inc |
|
|
2,534,057 |
|
| 7,888 |
|
|
|
Crown Holdings Inc |
|
|
726,406 |
|
| 93,269 |
|
|
|
Dow Inc |
|
|
5,114,872 |
|
| 23,362 |
|
|
|
Eastman Chemical Co |
|
|
2,098,375 |
|
| 23,857 |
|
|
|
Linde PLC |
|
|
9,798,308 |
|
| 8,265 |
|
|
|
Martin Marietta Materials Inc |
|
|
4,123,491 |
|
| 20,588 |
|
|
|
Nucor Corp |
|
|
3,583,136 |
|
| 14,196 |
|
|
|
Nutrien Ltd |
|
|
799,661 |
|
| 10,656 |
|
|
|
Olin Corp |
|
|
574,891 |
|
| 8,167 |
|
|
|
Rio Tinto PLC, Sponsored ADR |
|
|
608,115 |
|
| 14,399 |
|
|
|
RPM International Inc |
|
|
1,607,360 |
|
| 18,945 |
|
|
|
Sonoco Products Co |
|
|
1,058,457 |
|
| 87,016 |
|
|
|
Vale SA, Sponsored ADR |
|
|
1,380,074 |
|
|
|
|
|
Total Materials |
|
|
37,761,103 |
|
|
|
|
|
|
|
|
|
|
|
|
|
|
|
Media & Entertainment - 8.0% |
|
|
|
|
| 230,317 |
|
(c) |
|
Alphabet Inc, Class A |
|
|
32,172,982 |
|
| 186,111 |
|
(c) |
|
Alphabet Inc, Class C |
|
|
26,228,623 |
|
| 1,834 |
|
(c) |
|
Baidu Inc, Sponsored ADR |
|
|
218,411 |
|
| 190,443 |
|
|
|
Comcast Corp, Class A |
|
|
8,350,925 |
|
| 84,081 |
|
(c) |
|
Meta Platforms Inc |
|
|
29,761,311 |
|
| 19,486 |
|
(c) |
|
Netflix Inc |
|
|
9,487,344 |
|
| 17,899 |
|
|
|
New York Times Co/The, Class A |
|
|
876,872 |
|
| 78,489 |
|
|
|
News Corp, Class A |
|
|
1,926,905 |
|
| 1,091 |
|
(c) |
|
Roku Inc |
|
|
100,001 |
|
| 100,097 |
|
(d) |
|
Sirius XM Holdings Inc |
|
|
547,531 |
|
| 71,398 |
|
|
|
Walt Disney Co/The |
|
|
6,446,525 |
|
|
|
|
|
Total Media & Entertainment |
|
|
116,117,430 |
|
|
|
|
|
|
|
33
|
|
|
| BXMX |
|
Nuveen S&P 500 Buy-Write Income Fund (continued) |
|
|
Portfolio of Investments December 31, 2023 |
|
|
|
|
|
|
|
|
|
| Shares |
|
|
|
Description (a) |
|
Value |
|
|
|
|
|
|
|
|
Pharmaceuticals, Biotechnology & Life Sciences - 7.2% |
|
|
|
|
| 78,698 |
|
|
|
AbbVie Inc |
|
$ |
12,195,829 |
|
| 8,436 |
|
(c) |
|
Alnylam Pharmaceuticals Inc |
|
|
1,614,735 |
|
| 25,823 |
|
|
|
Amgen Inc |
|
|
7,437,540 |
|
| 56,490 |
|
(c) |
|
Avantor Inc |
|
|
1,289,667 |
|
| 9,243 |
|
(c) |
|
BioMarin Pharmaceutical Inc |
|
|
891,210 |
|
| 97,561 |
|
|
|
Bristol-Myers Squibb Co |
|
|
5,005,855 |
|
| 33,021 |
|
|
|
Eli Lilly & Co |
|
|
19,248,601 |
|
| 2,000 |
|
(c) |
|
Exact Sciences Corp |
|
|
147,960 |
|
| 67,257 |
|
|
|
Gilead Sciences Inc |
|
|
5,448,490 |
|
| 7,173 |
|
(c) |
|
ICON PLC |
|
|
2,030,461 |
|
| 109,458 |
|
|
|
Johnson & Johnson |
|
|
17,156,447 |
|
| 112,570 |
|
|
|
Merck & Co Inc |
|
|
12,272,381 |
|
| 241,787 |
|
|
|
Pfizer Inc |
|
|
6,961,048 |
|
| 28,283 |
|
(c) |
|
Teva Pharmaceutical Industries Ltd, |
|
|
295,275 |
|
|
|
|
|
Sponsored ADR |
|
|
|
|
| 24,976 |
|
|
|
Thermo Fisher Scientific Inc |
|
|
13,257,011 |
|
|
|
|
|
Total Pharmaceuticals, Biotechnology & Life Sciences |
|
|
105,252,510 |
|
|
|
|
|
|
|
|
|
|
|
|
|
|
|
Semiconductors & Semiconductor Equipment - 8.1% |
|
|
|
|
| 69,056 |
|
(c) |
|
Advanced Micro Devices Inc |
|
|
10,179,545 |
|
| 56,923 |
|
|
|
Applied Materials Inc |
|
|
9,225,511 |
|
| 1,597 |
|
|
|
ASML Holding NV |
|
|
1,208,801 |
|
| 17,958 |
|
|
|
Broadcom Inc |
|
|
20,045,617 |
|
| 13,344 |
|
|
|
Entegris Inc |
|
|
1,598,878 |
|
| 9,062 |
|
|
|
Lam Research Corp |
|
|
7,097,902 |
|
| 32,109 |
|
|
|
Marvell Technology Inc |
|
|
1,936,494 |
|
| 62,434 |
|
|
|
Micron Technology Inc |
|
|
5,328,118 |
|
| 92,957 |
|
|
|
NVIDIA Corp |
|
|
46,034,166 |
|
| 22,437 |
|
|
|
NXP Semiconductors NV |
|
|
5,153,330 |
|
| 36,779 |
|
(c) |
|
ON Semiconductor Corp |
|
|
3,072,150 |
|
| 50,975 |
|
|
|
QUALCOMM Inc |
|
|
7,372,514 |
|
|
|
|
|
Total Semiconductors & Semiconductor Equipment |
|
|
118,253,026 |
|
|
|
|
|
|
|
|
|
|
|
|
|
|
|
Software & Services - 11.7% |
|
|
|
|
| 23,674 |
|
|
|
Accenture PLC, Class A |
|
|
8,307,443 |
|
| 21,139 |
|
(c) |
|
Adobe Inc |
|
|
12,611,527 |
|
| 20,604 |
|
(c) |
|
Akamai Technologies Inc |
|
|
2,438,483 |
|
| 18,415 |
|
(c) |
|
Autodesk Inc |
|
|
4,483,684 |
|
| 10,744 |
|
(c) |
|
Check Point Software Technologies Ltd |
|
|
1,641,576 |
|
| 278,614 |
|
|
|
Microsoft Corp |
|
|
104,770,009 |
|
| 81,715 |
|
|
|
Oracle Corp |
|
|
8,615,213 |
|
| 46,556 |
|
(c) |
|
Salesforce Inc |
|
|
12,250,746 |
|
| 10,782 |
|
(c) |
|
ServiceNow Inc |
|
|
7,617,375 |
|
| 6,661 |
|
(c) |
|
Shopify Inc, Class A |
|
|
518,892 |
|
| 14,844 |
|
(c) |
|
VeriSign Inc |
|
|
3,057,270 |
|
| 5,378 |
|
(c) |
|
Workday Inc, Class A |
|
|
1,484,651 |
|
| 25,308 |
|
(c) |
|
Zoom Video Communications Inc, Class A |
|
|
1,819,899 |
|
|
|
|
|
Total Software & Services |
|
|
169,616,768 |
|
|
|
|
|
|
|
|
|
|
|
|
|
|
|
Technology Hardware & Equipment - 8.7% |
|
|
|
|
| 539,902 |
|
|
|
Apple Inc |
|
|
103,947,332 |
|
| 20,728 |
|
|
|
CDW Corp/DE |
|
|
4,711,889 |
|
| 19,049 |
|
(c) |
|
Ciena Corp |
|
|
857,395 |
|
| 220,344 |
|
|
|
Cisco Systems Inc |
|
|
11,131,779 |
|
| 123,423 |
|
|
|
Corning Inc |
|
|
3,758,230 |
|
| 6,851 |
|
|
|
Dell Technologies Inc, Class C |
|
|
524,102 |
|
| 34,963 |
|
(c) |
|
Flex Ltd |
|
|
1,064,973 |
|
| 5,140 |
|
(c) |
|
Lumentum Holdings Inc |
|
|
269,439 |
|
|
|
|
|
Total Technology Hardware & Equipment |
|
|
126,265,139 |
|
|
|
|
|
|
|
34
|
|
|
|
|
|
|
|
|
|
|
|
|
|
|
|
|
| Shares |
|
|
|
Description (a) |
|
|
|
|
|
|
|
Value |
| |
|
|
|
|
|
|
|
|
|
|
|
Telecommunication Services - 0.7% |
|
|
|
|
|
|
|
|
|
|
|
|
| 262,068 |
|
|
|
Verizon Communications Inc |
|
|
|
|
|
|
|
|
|
$ |
9,879,964 |
|
| |
|
|
|
|
|
Total Telecommunication Services |
|
|
|
|
|
|
|
|
|
|
9,879,964 |
|
|
|
|
|
|
|
|
|
|
|
|
|
|
|
|
|
Transportation - 1.5% |
|
|
|
|
|
|
|
|
|
|
|
|
| 68,557 |
|
(c) |
|
American Airlines Group Inc |
|
|
|
|
|
|
|
|
|
|
941,973 |
|
| 12,697 |
|
|
|
Canadian National Railway Co |
|
|
|
|
|
|
|
|
|
|
1,595,124 |
|
| 23,404 |
|
|
|
Canadian Pacific Railway Ltd |
|
|
|
|
|
|
|
|
|
|
1,850,320 |
|
| 4,425 |
|
(c) |
|
Lyft Inc, Class A |
|
|
|
|
|
|
|
|
|
|
66,331 |
|
| 21,947 |
|
|
|
Norfolk Southern Corp |
|
|
|
|
|
|
|
|
|
|
5,187,832 |
|
| 15,588 |
|
(c) |
|
Uber Technologies Inc |
|
|
|
|
|
|
|
|
|
|
959,753 |
|
| 36,282 |
|
(c) |
|
United Airlines Holdings Inc |
|
|
|
|
|
|
|
|
|
|
1,496,995 |
|
| 57,728 |
|
|
|
United Parcel Service Inc, Class B |
|
|
|
|
|
|
|
|
|
|
9,076,574 |
|
| |
|
|
|
|
|
Total Transportation |
|
|
|
|
|
|
|
|
|
|
21,174,902 |
|
|
|
|
|
|
|
|
|
|
|
|
|
|
|
|
|
Utilities - 2.3% |
|
|
|
|
|
|
|
|
|
|
|
|
| 64,656 |
|
|
|
Ameren Corp |
|
|
|
|
|
|
|
|
|
|
4,677,215 |
|
| 33,294 |
|
|
|
Atmos Energy Corp |
|
|
|
|
|
|
|
|
|
|
3,858,774 |
|
| 114,508 |
|
|
|
Evergy Inc |
|
|
|
|
|
|
|
|
|
|
5,977,317 |
|
| 2,933 |
|
|
|
National Fuel Gas Co |
|
|
|
|
|
|
|
|
|
|
147,149 |
|
| 67,111 |
|
|
|
NextEra Energy Inc |
|
|
|
|
|
|
|
|
|
|
4,076,322 |
|
| 17,519 |
|
|
|
Northwestern Energy Group Inc |
|
|
|
|
|
|
|
|
|
|
891,542 |
|
| 74,176 |
|
|
|
OGE Energy Corp |
|
|
|
|
|
|
|
|
|
|
2,590,968 |
|
| 29,198 |
|
|
|
Pinnacle West Capital Corp |
|
|
|
|
|
|
|
|
|
|
2,097,584 |
|
| 103,939 |
|
|
|
WEC Energy Group Inc |
|
|
|
|
|
|
|
|
|
|
8,748,546 |
|
| |
|
|
|
|
|
Total Utilities |
|
|
|
|
|
|
|
|
|
|
33,065,417 |
|
|
|
|
|
|
|
|
|
|
|
Total Common Stocks
(cost $472,674,465) |
|
|
|
|
|
|
|
|
|
|
1,445,759,666 |
|
|
|
|
|
|
|
|
|
|
|
Total Long-Term Investments
(cost $472,674,465) |
|
|
|
|
|
|
|
|
|
|
1,445,759,666 |
|
|
|
|
|
|
|
|
|
|
|
|
|
| Shares |
|
|
|
Description (a) |
|
|
Coupon |
|
|
|
|
|
|
|
Value |
|
| |
|
|
|
|
|
INVESTMENTS PURCHASED WITH COLLATERAL FROM SECURITIES LENDING - 0.0% |
|
| 571,823 |
|
(e) |
|
State Street Navigator Securities Lending Government Money Market Portfolio |
|
|
5.360%(f) |
|
|
|
|
|
|
$ |
571,823 |
|
| |
|
|
|
|
|
Total Investments Purchased with Collateral from Securities Lending
(cost $571,823) |
|
|
|
|
|
|
|
571,823 |
|
|
|
|
|
|
|
|
|
|
|
|
|
| Principal
Amount (000) |
|
|
|
Description (a) |
|
|
Coupon |
|
|
|
Maturity |
|
|
|
Value |
|
| |
|
|
|
|
|
SHORT-TERM INVESTMENTS - 4.3% |
|
|
|
|
|
|
|
|
|
|
|
|
|
|
|
|
REPURCHASE AGREEMENTS - 4.3% |
|
|
|
|
|
|
|
|
|
|
|
|
| $ 62,475 |
|
(g) |
|
Fixed Income Clearing Corp (FICC) |
|
|
5.310% |
|
|
|
1/02/24 |
|
|
$ |
62,475,000 |
|
| |
|
|
|
|
|
Total Repurchase Agreements (cost $62,475,000) |
|
|
|
|
|
|
|
|
|
|
62,475,000 |
|
|
|
|
|
|
|
|
|
|
|
Total Short-Term Investments
(cost $62,475,000) |
|
|
|
|
|
|
|
|
|
|
62,475,000 |
|
|
|
|
|
|
|
|
|
|
|
Total Investments (cost $535,721,288) - 103.9% |
|
|
|
|
|
|
|
|
|
|
1,508,806,489 |
|
|
|
|
|
|
|
|
|
|
|
Other Assets & Liabilities, Net - (3.9)% |
|
|
|
|
|
|
|
|
|
|
(56,415,888) |
|
|
|
|
|
|
|
|
|
|
|
Net Assets Applicable to Common Shares - 100% |
|
|
|
|
|
|
|
|
|
$ |
1,452,390,601 |
|
|
|
|
|
|
|
35
|
|
|
| BXMX |
|
Nuveen S&P 500 Buy-Write Income Fund (continued) |
|
|
Portfolio of Investments December 31, 2023 |
Investments in Derivatives
Options Written
|
|
|
|
|
|
|
|
|
|
|
|
|
|
|
|
|
|
|
|
|
| Type |
|
Description(h) |
|
Number of
Contracts |
|
|
Notional
Amount (i) |
|
|
Exercise
Price |
|
|
Expiration Date |
|
|
Value |
| Call |
|
S&P 500 Index |
|
|
(333 |
) |
|
|
$(154,845,000 |
) |
|
|
$4,650 |
|
|
|
1/31/24 |
|
|
$(5,341,320) |
| Call |
|
S&P 500 Index |
|
|
(333 |
) |
|
|
(156,510,000 |
) |
|
|
4,700 |
|
|
|
1/31/24 |
|
|
(4,009,320) |
| Call |
|
S&P 500 Index |
|
|
(333 |
) |
|
|
(154,845,000 |
) |
|
|
4,650 |
|
|
|
2/16/24 |
|
|
(6,078,915) |
| Call |
|
S&P 500 Index |
|
|
(334 |
) |
|
|
(160,320,000 |
) |
|
|
4,800 |
|
|
|
2/16/24 |
|
|
(2,571,800) |
| Call |
|
S&P 500 Index |
|
|
(334 |
) |
|
|
(160,320,000 |
) |
|
|
4,800 |
|
|
|
3/15/24 |
|
|
(3,672,330) |
| Call |
|
S&P 500 Index |
|
|
(334 |
) |
|
|
(161,990,000 |
) |
|
|
4,850 |
|
|
|
3/15/24 |
|
|
(2,743,810) |
| Call |
|
S&P 500 Index |
|
|
(334 |
) |
|
|
(163,660,000 |
) |
|
|
4,900 |
|
|
|
3/15/24 |
|
|
(1,975,610) |
| Call |
|
S&P 500 Index |
|
|
(333 |
) |
|
|
(164,835,000 |
) |
|
|
4,950 |
|
|
|
3/28/24 |
|
|
(1,751,580) |
| Call |
|
S&P 500 Index |
|
|
(334 |
) |
|
|
(167,000,000 |
) |
|
|
5,000 |
|
|
|
3/28/24 |
|
|
(1,227,450) |
| Total Options Written (premiums
received $18,134,727) |
|
|
(3,002 |
) |
|
|
$(1,444,325,000 |
) |
|
|
|
|
|
|
|
|
|
$(29,372,135) |
For Fund portfolio compliance purposes, the Fund’s industry classifications refer to any one or more of the industry sub-classifications used by one or more widely recognized market indexes or ratings group indexes, and/or as defined by Fund management. This definition may not apply for purposes of this report, which may combine
industry sub-classifications into sectors for reporting ease.
| (a) |
All percentages shown in the Portfolio of Investments are based on net assets applicable to common shares unless otherwise
noted. |
| (b) |
The Fund may designate up to 100% of its common stock investments to cover outstanding options written.
|
| (c) |
Non-income producing; issuer has not declared an
ex-dividend date within the past twelve months. |
| (d) |
Investment, or a portion of investment, is out on loan for securities lending. The total value of the securities out on
loan as of the end of the reporting period was $542,055. |
| (e) |
The Fund may loan securities representing up to one third of the value of its total assets (which includes collateral for
securities on loan) to broker dealers, banks, and other institutions. The collateral maintained by the Fund shall have a value, at the inception of each loan, equal to not less than 100% of the value of the loaned securities. The cash collateral
received by the Fund is invested in this money market fund. |
| (f) |
The rate shown is the one-day yield as of the end of the reporting period.
|
| (g) |
Agreement with Fixed Income Clearing Corporation, 5.310% dated 12/29/23 to be repurchased at $62,511,860 on 1/2/24,
collateralized by Government Agency Securities, with coupon rate 2.375% and maturity date 2/15/42, valued at $63,724,519. |
| (h) |
Exchange-traded, unless otherwise noted. |
| (i) |
For disclosure purposes, Notional Amount is calculated by multiplying the Number of Contracts by the Exercise Price by
100. |
| ADR |
American Depositary Receipt |
| REIT |
Real Estate Investment Trust |
See Notes to Financial Statements
36
|
|
|
| DIAX |
|
Nuveen Dow 30SM Dynamic Overwrite Fund |
|
|
Portfolio of Investments December 31, 2023 |
|
|
|
|
|
|
|
|
|
| Shares |
|
|
|
Description (a) |
|
Value |
|
|
|
|
|
LONG-TERM INVESTMENTS - 101.0% |
|
|
|
|
|
|
|
|
COMMON STOCKS - 99.7% |
|
|
|
|
|
|
|
|
|
|
|
|
Banks - 3.0% |
|
|
|
|
| 102,812 |
|
|
|
JPMorgan Chase & Co |
|
$ |
17,488,321 |
|
|
|
|
|
Total Banks |
|
|
17,488,321 |
|
|
|
|
|
|
|
|
|
|
|
|
|
|
|
Capital Goods - 15.3% |
|
|
|
|
| 102,812 |
|
|
|
3M Co |
|
|
11,239,408 |
|
| 102,812 |
|
(b) |
|
Boeing Co/The |
|
|
26,798,976 |
|
| 102,812 |
|
|
|
Caterpillar Inc |
|
|
30,398,424 |
|
| 102,812 |
|
|
|
Honeywell International Inc |
|
|
21,560,704 |
|
|
|
|
|
Total Capital Goods |
|
|
89,997,512 |
|
|
|
|
|
|
|
|
|
|
|
|
|
|
|
Consumer Discretionary Distribution & Retail - 6.0% |
|
|
|
|
| 102,812 |
|
|
|
Home Depot Inc/The |
|
|
35,629,499 |
|
|
|
|
|
Total Consumer Discretionary Distribution & Retail |
|
|
35,629,499 |
|
|
|
|
|
|
|
|
|
|
|
|
|
|
|
Consumer Durables & Apparel - 1.9% |
|
|
|
|
| 102,812 |
|
|
|
NIKE Inc, Class B |
|
|
11,162,299 |
|
|
|
|
|
Total Consumer Durables & Apparel |
|
|
11,162,299 |
|
|
|
|
|
|
|
|
|
|
|
|
|
|
|
Consumer Services - 5.2% |
|
|
|
|
| 102,812 |
|
|
|
McDonald’s Corp |
|
|
30,484,786 |
|
|
|
|
|
Total Consumer Services |
|
|
30,484,786 |
|
|
|
|
|
|
|
|
|
|
|
|
|
|
|
Consumer Staples Distribution & Retail - 3.2% |
|
|
|
|
| 102,812 |
|
|
|
Walgreens Boots Alliance Inc |
|
|
2,684,421 |
|
| 102,812 |
|
|
|
Walmart Inc |
|
|
16,208,312 |
|
|
|
|
|
Total Consumer Staples Distribution & Retail |
|
|
18,892,733 |
|
|
|
|
|
|
|
|
|
|
|
|
|
|
|
Energy - 2.6% |
|
|
|
|
| 102,812 |
|
|
|
Chevron Corp |
|
|
15,335,438 |
|
|
|
|
|
Total Energy |
|
|
15,335,438 |
|
|
|
|
|
|
|
|
|
|
|
|
|
|
|
Financial Services - 14.5% |
|
|
|
|
| 102,812 |
|
(c) |
|
American Express Co |
|
|
19,260,800 |
|
| 102,812 |
|
(c) |
|
Goldman Sachs Group Inc/The |
|
|
39,661,786 |
|
| 102,812 |
|
|
|
Visa Inc, Class A |
|
|
26,767,104 |
|
|
|
|
|
Total Financial Services |
|
|
85,689,690 |
|
|
|
|
|
|
|
|
|
|
|
|
|
|
|
Food, Beverage & Tobacco - 1.0% |
|
|
|
|
| 102,812 |
|
|
|
Coca-Cola Co/The |
|
|
6,058,711 |
|
|
|
|
|
Total Food, Beverage & Tobacco |
|
|
6,058,711 |
|
|
|
|
|
|
|
|
|
|
|
|
|
|
|
Health Care Equipment & Services - 9.2% |
|
|
|
|
| 102,812 |
|
|
|
UnitedHealth Group Inc |
|
|
54,127,434 |
|
|
|
|
|
Total Health Care Equipment & Services |
|
|
54,127,434 |
|
|
|
|
|
|
|
|
|
|
|
|
|
|
|
Household & Personal Products - 2.5% |
|
|
|
|
| 102,812 |
|
|
|
Procter & Gamble Co/The |
|
|
15,066,070 |
|
|
|
|
|
Total Household & Personal Products |
|
|
15,066,070 |
|
|
|
|
|
|
|
|
|
|
|
|
|
|
|
Insurance - 3.3% |
|
|
|
|
| 102,812 |
|
|
|
Travelers Cos Inc/The |
|
|
19,584,658 |
|
|
|
|
|
Total Insurance |
|
|
19,584,658 |
|
|
|
|
|
|
|
37
|
|
|
| DIAX |
|
Nuveen Dow 30SM Dynamic Overwrite Fund (continued) |
|
|
Portfolio of Investments December 31, 2023 |
|
|
|
|
|
|
|
|
|
|
|
|
|
| Shares |
|
|
|
Description (a) |
|
|
|
|
Value |
|
|
|
|
|
|
|
|
|
|
Materials - 1.0% |
|
|
|
|
|
|
|
|
| 102,812 |
|
|
|
Dow Inc |
|
|
|
|
|
$ |
5,638,210 |
|
|
|
|
|
Total Materials |
|
|
|
|
|
|
5,638,210 |
|
|
|
|
|
|
|
|
|
|
|
|
|
|
|
|
Media & Entertainment - 1.6% |
|
|
|
|
|
|
|
|
| 102,812 |
|
|
|
Walt Disney Co/The |
|
|
|
|
|
|
9,282,895 |
|
|
|
|
|
Total Media & Entertainment |
|
|
|
|
|
|
9,282,895 |
|
|
|
|
|
|
|
|
|
|
|
|
|
|
Pharmaceuticals, Biotechnology & Life Sciences - 9.6% |
|
| 102,812 |
|
(c) |
|
Amgen Inc |
|
|
|
|
|
|
29,611,912 |
|
| 102,812 |
|
|
|
Johnson & Johnson |
|
|
|
|
|
|
16,114,753 |
|
| 102,812 |
|
|
|
Merck & Co Inc |
|
|
|
|
|
|
11,208,564 |
|
|
|
|
|
Total Pharmaceuticals, Biotechnology & Life Sciences |
|
|
|
56,935,229 |
|
|
|
|
|
|
|
|
|
|
|
|
|
|
Semiconductors & Semiconductor Equipment - 0.9% |
|
| 102,812 |
|
|
|
Intel Corp |
|
|
|
|
|
|
5,166,303 |
|
|
|
|
|
Total Semiconductors & Semiconductor Equipment |
|
|
|
5,166,303 |
|
|
|
|
|
|
|
|
|
|
|
|
|
|
|
|
Software & Services - 14.0% |
|
|
|
|
|
|
|
|
| 102,812 |
|
|
|
International Business Machines Corp |
|
|
|
16,814,903 |
|
| 102,812 |
|
|
|
Microsoft Corp |
|
|
|
|
|
|
38,661,424 |
|
| 102,812 |
|
(b) |
|
Salesforce Inc |
|
|
|
|
|
|
27,053,950 |
|
|
|
|
|
Total Software & Services |
|
|
|
|
|
|
82,530,277 |
|
|
|
|
|
|
|
|
|
|
|
|
|
|
|
Technology Hardware & Equipment - 4.2% |
|
|
|
|
|
| 102,812 |
|
(c) |
|
Apple Inc |
|
|
|
|
|
|
19,794,395 |
|
| 102,812 |
|
|
|
Cisco Systems Inc |
|
|
|
|
|
|
5,194,062 |
|
|
|
|
|
Total Technology Hardware & Equipment |
|
|
|
24,988,457 |
|
|
|
|
|
|
|
|
|
|
|
|
|
|
|
Telecommunication Services - 0.7% |
|
|
|
|
|
| 102,812 |
|
|
|
Verizon Communications Inc |
|
|
|
|
|
|
3,876,012 |
|
|
|
|
|
Total Telecommunication Services |
|
|
|
|
|
|
3,876,012 |
|
|
|
|
|
|
|
|
|
|
|
Total Common Stocks (cost $212,750,833) |
|
|
|
|
|
|
587,934,534 |
|
|
|
|
|
|
|
|
|
|
|
|
| Shares |
|
|
|
Description (a) |
|
|
|
|
Value |
|
|
|
|
|
EXCHANGE-TRADED FUNDS - 1.3b% |
|
|
|
|
|
| 2,450 |
|
|
|
SPDR Dow Jones Industrial Average ETF Trust |
|
|
$ |
923,331 |
|
| 27,500 |
|
(d) |
|
Vanguard Total Stock Market ETF |
|
|
|
|
|
|
6,523,550 |
|
|
|
|
|
Total Exchange-Traded Funds
(cost $7,048,149) |
|
|
|
|
|
|
7,446,881 |
|
|
|
|
|
|
|
|
|
|
|
|
|
|
|
|
|
|
|
|
|
|
|
|
|
|
|
|
|
|
|
|
|
|
|
|
|
|
|
|
| Type |
|
|
|
Description (e) |
|
Number of
Contracts |
|
|
Notional
Amount (f) |
|
|
Exercise
Price |
|
|
Expiration
Date |
|
|
Value |
|
|
|
|
|
OPTIONS PURCHASED - 0.0% |
|
|
|
|
|
|
|
|
|
|
|
|
|
|
|
|
|
|
|
|
| Put |
|
|
|
S&P 500 Index |
|
|
35 |
|
|
$ |
14,700,000 |
|
|
$ |
4200 |
|
|
|
1/19/24 |
|
|
$ |
4,463 |
|
|
|
|
|
Total Options Purchased (cost $13,733) |
|
|
35 |
|
|
$ |
14,700,000 |
|
|
|
|
|
|
|
|
|
|
|
4,463 |
|
|
|
|
|
|
|
|
|
|
|
Total Long-Term Investments (cost
$219,812,715) |
|
|
|
|
|
|
|
|
|
|
|
|
|
|
|
|
|
|
595,385,878 |
|
|
|
|
|
|
|
|
|
|
|
|
|
|
|
| Shares |
|
|
|
Description (a) |
|
|
|
|
|
|
|
Coupon |
|
|
|
|
|
Value |
|
|
|
|
|
INVESTMENTS PURCHASED WITH COLLATERAL FROM SECURITIES LENDING - 0.1% |
|
|
|
|
|
| 910,821 |
|
(g) |
|
State Street Navigator Securities Lending Government Money Market Portfolio |
|
|
|
|
|
|
|
5.360%(h) |
|
|
|
|
|
|
$ |
910,821 |
|
|
|
|
|
Total Investments Purchased with Collateral from Securities Lending
(cost $910,821) |
|
|
|
|
|
|
|
910,821 |
|
|
|
|
|
|
|
38
|
|
|
|
|
|
|
|
|
|
|
|
|
|
|
|
|
| Principal
Amount (000) |
|
|
|
Description (a) |
|
Coupon |
|
|
Maturity |
|
|
Value |
|
|
|
|
SHORT-TERM INVESTMENTS - 0.2% |
|
|
|
|
|
|
|
|
|
|
|
|
|
|
|
|
REPURCHASE AGREEMENTS - 0.2% |
|
|
|
|
|
|
|
|
|
|
|
|
|
$ 1,029 |
|
(i) |
|
Fixed Income Clearing Corp (FICC) |
|
|
1.600 |
% |
|
|
1/02/24 |
|
|
$ |
1,028,999 |
|
|
|
|
|
Total Repurchase Agreements (cost $1,028,999) |
|
|
|
|
|
|
|
|
|
|
1,028,999 |
|
|
|
|
|
|
|
|
|
|
|
Total Short-Term Investments (cost
$1,028,999) |
|
|
|
|
|
|
|
|
|
|
1,028,999 |
|
|
|
|
|
|
|
|
|
|
|
|
|
|
|
|
|
Total Investments (cost $221,752,535) - 101.3% |
|
|
|
|
|
|
|
|
|
|
597,325,698 |
|
|
|
|
|
|
|
|
|
|
|
Other Assets & Liabilities, Net - (1.3)% |
|
|
|
|
|
|
|
|
|
|
(7,628,282 |
) |
|
|
|
|
|
|
|
|
|
|
Net Assets Applicable to Common Shares - 100% |
|
|
|
|
|
|
|
|
|
$ |
589,697,416 |
|
|
|
|
|
|
|
Investments in Derivatives
Options Written
|
|
|
|
|
|
|
|
|
|
|
|
|
|
|
|
|
|
|
|
|
|
|
| Type |
|
Description(e) |
|
Number of
Contracts |
|
|
Notional
Amount (f) |
|
|
Exercise
Price |
|
|
Expiration Date |
|
|
Value |
|
| |
|
| Call |
|
S&P 500 Index |
|
|
(50 |
) |
|
|
$(23,000,000 |
) |
|
|
$4,600 |
|
|
|
1/05/24 |
|
|
|
$(874,250) |
|
| Call |
|
S&P 500 Index |
|
|
(100 |
) |
|
|
(46,000,000 |
) |
|
|
4,600 |
|
|
|
1/12/24 |
|
|
|
(1,821,500) |
|
| Call |
|
Russell 2000 Index |
|
|
(40 |
) |
|
|
(8,200,000 |
) |
|
|
2,050 |
|
|
|
1/19/24 |
|
|
|
(110,200) |
|
| Call |
|
S&P 500 Index |
|
|
(100 |
) |
|
|
(46,750,000 |
) |
|
|
4,675 |
|
|
|
1/19/24 |
|
|
|
(1,221,000) |
|
| Call |
|
S&P 500 Index |
|
|
(70 |
) |
|
|
(32,900,000 |
) |
|
|
4,700 |
|
|
|
1/19/24 |
|
|
|
(710,150) |
|
| Call |
|
S&P 500 Index |
|
|
(50 |
) |
|
|
(23,625,000 |
) |
|
|
4,725 |
|
|
|
1/19/24 |
|
|
|
(411,000) |
|
| Call |
|
S&P 500 Index |
|
|
(80 |
) |
|
|
(38,200,000 |
) |
|
|
4,775 |
|
|
|
1/19/24 |
|
|
|
(392,400) |
|
| Call |
|
S&P 500 Index |
|
|
(35 |
) |
|
|
(16,800,000 |
) |
|
|
4,800 |
|
|
|
1/19/24 |
|
|
|
(126,350) |
|
| Call |
|
S&P 500 Index |
|
|
(120 |
) |
|
|
(57,600,000 |
) |
|
|
4,800 |
|
|
|
1/31/24 |
|
|
|
(659,400) |
|
| |
|
| Total Options Written (premiums received $3,539,608) |
|
|
(645 |
) |
|
|
$(293,075,000 |
) |
|
|
|
|
|
|
|
|
|
|
$(6,326,250) |
|
| |
|
| |
For Fund portfolio compliance purposes, the Fund’s industry classifications refer to any one or more of the industry sub-classifications used by one or more widely recognized market indexes or ratings group indexes, and/or as defined by Fund management. This definition may not apply for purposes of this report, which may combine
industry sub-classifications into sectors for reporting ease. |
| (a) |
All percentages shown in the Portfolio of Investments are based on net assets applicable to common shares unless otherwise
noted. |
| (b) |
Non-income producing; issuer has not declared an
ex-dividend date within the past twelve months. |
| (c) |
Investment, or portion of investment, has been pledged to collateralize the net payment obligations for investments in
derivatives. |
| (d) |
Investment, or a portion of investment, is out on loan for securities lending. The total value of the securities out on
loan as of the end of the reporting period was $880,798. |
| (e) |
Exchange-traded, unless otherwise noted. |
| (f) |
For disclosure purposes, Notional Amount is calculated by multiplying the Number of Contracts by the Exercise Price by
100. |
| (g) |
The Fund may loan securities representing up to one third of the value of its total assets (which includes collateral for
securities on loan) to broker dealers, banks, and other institutions. The collateral maintained by the Fund shall have a value, at the inception of each loan, equal to not less than 100% of the value of the loaned securities. The cash collateral
received by the Fund is invested in this money market fund. |
| (h) |
The rate shown is the one-day yield as of the end of the reporting period.
|
| (i) |
Agreement with Fixed Income Clearing Corporation, 1.600% dated 12/29/23 to be repurchased at $1,029,182 on 1/2/24,
collateralized by Government Agency Securities, with coupon rate 2.875% and maturity date 5/15/32, valued at $1,049,636. |
| SPDR |
Standard & Poor’s Depositary Receipt |
See Notes to Financial Statements
39
|
|
|
| SPXX |
|
Nuveen S&P 500 Dynamic Overwrite Fund |
|
|
Portfolio of Investments December 31, 2023 |
|
|
|
|
|
|
|
|
|
| Shares |
|
|
|
Description (a) |
|
Value |
|
|
|
|
LONG-TERM INVESTMENTS - 100.8% |
|
|
|
|
|
|
|
|
COMMON STOCKS - 99.3% |
|
|
|
|
|
|
|
|
|
|
|
|
Automobiles & Components - 2.1% |
|
|
|
|
| 1,864 |
|
(b) |
|
Adient PLC |
|
$ |
67,775 |
|
| 5,520 |
|
(b),(c) |
|
Fisker Inc |
|
|
9,660 |
|
| 699 |
|
(b) |
|
Fox Factory Holding Corp |
|
|
47,169 |
|
| 5,866 |
|
|
|
Gentex Corp |
|
|
191,584 |
|
| 2,285 |
|
(b) |
|
Goodyear Tire & Rubber Co/The |
|
|
32,721 |
|
| 2,305 |
|
|
|
Harley-Davidson Inc |
|
|
84,916 |
|
| 2,628 |
|
|
|
Lear Corp |
|
|
371,099 |
|
| 1,133 |
|
(b) |
|
Rivian Automotive Inc, Class A |
|
|
26,580 |
|
| 20,298 |
|
(b) |
|
Tesla Inc |
|
|
5,043,648 |
|
| 1,213 |
|
|
|
Thor Industries Inc |
|
|
143,437 |
|
| 742 |
|
(b) |
|
Visteon Corp |
|
|
92,676 |
|
|
|
|
|
Total Automobiles & Components |
|
|
6,111,265 |
|
|
|
|
|
|
|
|
|
|
|
|
|
|
|
Banks - 3.5% |
|
|
|
|
| 58,413 |
|
|
|
Bank of America Corp |
|
|
1,966,766 |
|
| 22,776 |
|
|
|
Citigroup Inc |
|
|
1,171,597 |
|
| 5,317 |
|
|
|
Columbia Banking System Inc |
|
|
141,858 |
|
| 1,248 |
|
|
|
Cullen/Frost Bankers Inc |
|
|
135,396 |
|
| 85 |
|
|
|
First Citizens BancShares Inc/NC, Class A |
|
|
120,612 |
|
| 4,948 |
|
|
|
First Horizon Corp |
|
|
70,064 |
|
| 24,521 |
|
|
|
JPMorgan Chase & Co |
|
|
4,171,021 |
|
| 4,716 |
|
|
|
New York Community Bancorp Inc |
|
|
48,245 |
|
| 4,203 |
|
|
|
Synovus Financial Corp |
|
|
158,243 |
|
| 1,914 |
|
(b) |
|
Texas Capital Bancshares Inc |
|
|
123,702 |
|
| 3,622 |
|
|
|
Webster Financial Corp |
|
|
183,853 |
|
| 32,799 |
|
|
|
Wells Fargo & Co |
|
|
1,614,367 |
|
| 2,675 |
|
|
|
Wintrust Financial Corp |
|
|
248,106 |
|
|
|
|
|
Total Banks |
|
|
10,153,830 |
|
|
|
|
|
|
|
|
|
|
|
|
|
|
|
Capital Goods - 5.6% |
|
|
|
|
| 506 |
|
|
|
Acuity Brands Inc |
|
|
103,644 |
|
| 1,294 |
|
|
|
AGCO Corp |
|
|
157,105 |
|
| 4,907 |
|
(b) |
|
Boeing Co/The |
|
|
1,279,059 |
|
| 2,021 |
|
|
|
BWX Technologies Inc |
|
|
155,071 |
|
| 563 |
|
|
|
Carlisle Cos Inc |
|
|
175,898 |
|
| 4,996 |
|
|
|
Caterpillar Inc |
|
|
1,477,167 |
|
| 1,029 |
|
|
|
Curtiss-Wright Corp |
|
|
229,251 |
|
| 3,017 |
|
|
|
Deere & Co |
|
|
1,206,408 |
|
| 5,038 |
|
|
|
Eaton Corp PLC |
|
|
1,213,251 |
|
| 740 |
|
|
|
EMCOR Group Inc |
|
|
159,418 |
|
| 930 |
|
|
|
Esab Corp |
|
|
80,557 |
|
| 2,181 |
|
|
|
Fortune Brands Innovations Inc |
|
|
166,061 |
|
| 5,399 |
|
|
|
Graco Inc |
|
|
468,417 |
|
| 1,527 |
|
|
|
HEICO Corp |
|
|
273,134 |
|
| 8,713 |
|
|
|
Honeywell International Inc |
|
|
1,827,203 |
|
| 6,141 |
|
|
|
Illinois Tool Works Inc |
|
|
1,608,573 |
|
| 936 |
|
|
|
Lennox International Inc |
|
|
418,880 |
|
| 1,101 |
|
|
|
Lincoln Electric Holdings Inc |
|
|
239,423 |
|
| 2,947 |
|
|
|
Lockheed Martin Corp |
|
|
1,335,698 |
|
| 595 |
|
(b) |
|
MasTec Inc |
|
|
45,053 |
|
| 1,258 |
|
(b) |
|
Middleby Corp/The |
|
|
185,140 |
|
| 1,377 |
|
|
|
Oshkosh Corp |
|
|
149,281 |
|
| 2,476 |
|
|
|
Owens Corning |
|
|
367,017 |
|
| 4,993 |
|
(b),(c) |
|
Plug Power Inc |
|
|
22,469 |
|
| 16,125 |
|
|
|
Raytheon Technologies Corp |
|
|
1,356,758 |
|
40
|
|
|
|
|
|
|
|
|
| Shares |
|
|
|
Description (a) |
|
Value |
|
|
|
|
|
|
|
|
Capital Goods (continued) |
|
|
|
|
| 2,981 |
|
|
|
Sensata Technologies Holding PLC |
|
$ |
111,996 |
|
| 2,008 |
|
|
|
Timken Co/The |
|
|
160,941 |
|
| 1,360 |
|
|
|
Toro Co/The |
|
|
130,546 |
|
| 914 |
|
(b) |
|
Trex Co Inc |
|
|
75,670 |
|
| 511 |
|
|
|
Valmont Industries Inc |
|
|
119,324 |
|
| 637 |
|
|
|
Watsco Inc |
|
|
272,935 |
|
| 686 |
|
|
|
WESCO International Inc |
|
|
119,282 |
|
| 3,189 |
|
(b) |
|
WillScot Mobile Mini Holdings Corp |
|
|
141,911 |
|
| 927 |
|
|
|
WW Grainger Inc |
|
|
768,196 |
|
|
|
|
|
Total Capital Goods |
|
|
16,600,737 |
|
|
|
|
|
|
|
|
|
|
|
|
|
|
|
Commercial & Professional Services - 0.6% |
|
|
|
|
| 3,554 |
|
(b) |
|
ARAMARK Uniform Services |
|
|
75,132 |
|
| 3,007 |
|
|
|
Booz Allen Hamilton Holding Corp |
|
|
384,624 |
|
| 425 |
|
(b) |
|
CACI International Inc, Class A |
|
|
137,641 |
|
| 6,728 |
|
(b) |
|
Clarivate PLC |
|
|
62,301 |
|
| 786 |
|
(b) |
|
Clean Harbors Inc |
|
|
137,165 |
|
| 637 |
|
|
|
Concentrix Corp |
|
|
62,560 |
|
| 2,600 |
|
(b) |
|
ExlService Holdings Inc |
|
|
80,210 |
|
| 318 |
|
(b) |
|
FTI Consulting Inc |
|
|
63,330 |
|
| 2,741 |
|
(b) |
|
GEO Group Inc/The |
|
|
29,685 |
|
| 2,665 |
|
|
|
KBR Inc |
|
|
147,668 |
|
| 1,061 |
|
|
|
RB Global Inc |
|
|
70,970 |
|
| 1,108 |
|
|
|
Science Applications International Corp |
|
|
137,747 |
|
| 4,200 |
|
|
|
SS&C Technologies Holdings Inc |
|
|
256,661 |
|
| 998 |
|
|
|
TransUnion |
|
|
68,573 |
|
|
|
|
|
Total Commercial & Professional Services |
|
|
1,714,267 |
|
|
|
|
|
|
|
|
|
|
|
|
|
|
|
Consumer Discretionary Distribution & Retail - 5.4% |
|
|
|
|
| 67,878 |
|
(b),(d) |
|
Amazon.com Inc |
|
|
10,313,383 |
|
| 839 |
|
(b) |
|
AutoNation Inc |
|
|
126,001 |
|
| 1,137 |
|
|
|
Dick’s Sporting Goods Inc |
|
|
167,082 |
|
| 515 |
|
(b) |
|
Five Below Inc |
|
|
109,777 |
|
| 9,671 |
|
|
|
Home Depot Inc/The |
|
|
3,351,486 |
|
| 343 |
|
|
|
Lithia Motors Inc |
|
|
112,943 |
|
| 7,215 |
|
|
|
Lowe’s Cos Inc |
|
|
1,605,698 |
|
| 3,604 |
|
|
|
Macy’s Inc |
|
|
72,512 |
|
| 38 |
|
(b) |
|
MercadoLibre Inc |
|
|
59,719 |
|
| 303 |
|
|
|
Murphy USA Inc |
|
|
108,038 |
|
| 392 |
|
(b) |
|
PDD Holdings Inc ADR |
|
|
57,354 |
|
| 372 |
|
(b) |
|
RH |
|
|
108,431 |
|
| 753 |
|
(b) |
|
Wayfair Inc, Class A |
|
|
46,460 |
|
| 627 |
|
|
|
Williams-Sonoma Inc |
|
|
126,516 |
|
|
|
|
|
Total Consumer Discretionary Distribution & Retail |
|
|
16,365,400 |
|
|
|
|
|
|
|
|
|
|
|
|
|
|
|
Consumer Durables & Apparel - 1.1% |
|
|
|
|
| 1,316 |
|
(b) |
|
Capri Holdings Ltd |
|
|
66,116 |
|
| 233 |
|
(b) |
|
Deckers Outdoor Corp |
|
|
155,744 |
|
| 8,589 |
|
|
|
KB Home |
|
|
536,470 |
|
| 5,953 |
|
|
|
Leggett & Platt Inc |
|
|
155,790 |
|
| 3,702 |
|
(b) |
|
Mattel Inc |
|
|
69,894 |
|
| 1,396 |
|
|
|
Meritage Homes Corp |
|
|
243,183 |
|
| 12,271 |
|
|
|
NIKE Inc, Class B |
|
|
1,332,262 |
|
| 4,109 |
|
(b) |
|
Sonos Inc |
|
|
70,428 |
|
| 4,744 |
|
(b) |
|
Taylor Morrison Home Corp |
|
|
253,092 |
|
| 4,723 |
|
|
|
Tempur Sealy International Inc |
|
|
240,731 |
|
| 11,692 |
|
(b) |
|
Under Armour Inc, Class A |
|
|
102,773 |
|
|
|
|
|
Total Consumer Durables & Apparel |
|
|
3,226,483 |
|
|
|
|
|
|
|
41
|
|
|
| SPXX |
|
Nuveen S&P 500 Dynamic Overwrite Fund (continued) |
|
|
Portfolio of Investments December 31, 2023 |
|
|
|
|
|
|
|
|
|
| Shares |
|
|
|
Description (a) |
|
Value |
|
|
|
|
|
|
|
|
Consumer Services - 2.3% |
|
|
|
|
| 3,882 |
|
|
|
Aramark |
|
$ |
109,084 |
|
| 331 |
|
(b) |
|
Booking Holdings Inc |
|
|
1,174,130 |
|
| 2,995 |
|
|
|
Boyd Gaming Corp |
|
|
187,517 |
|
| 555 |
|
(b) |
|
Bright Horizons Family Solutions Inc |
|
|
52,303 |
|
| 979 |
|
(b) |
|
DoorDash Inc, Class A |
|
|
96,813 |
|
| 2,395 |
|
(b) |
|
DraftKings Inc, Class A |
|
|
84,424 |
|
| 2,846 |
|
|
|
Hyatt Hotels Corp |
|
|
371,147 |
|
| 1,038 |
|
|
|
Marriott Vacations Worldwide Corp |
|
|
88,116 |
|
| 8,883 |
|
|
|
McDonald’s Corp |
|
|
2,633,898 |
|
| 1,641 |
|
(b) |
|
Planet Fitness Inc |
|
|
119,793 |
|
| 1,485 |
|
|
|
Service Corp International/US |
|
|
101,648 |
|
| 2,073 |
|
(b) |
|
Six Flags Entertainment Corp |
|
|
51,991 |
|
| 12,028 |
|
|
|
Starbucks Corp |
|
|
1,154,808 |
|
| 3,429 |
|
|
|
Travel + Leisure Co |
|
|
134,040 |
|
| 7,284 |
|
|
|
Wendy’s Co/The |
|
|
141,892 |
|
|
|
|
|
Total Consumer Services |
|
|
6,501,604 |
|
|
|
|
|
|
|
|
|
|
|
|
|
|
|
Consumer Staples Distribution & Retail - 2.2% |
|
|
|
|
| 4,784 |
|
|
|
Albertsons Cos Inc, Class A |
|
|
110,032 |
|
| 2,512 |
|
(b) |
|
BJ’s Wholesale Club Holdings Inc |
|
|
167,450 |
|
| 410 |
|
|
|
Casey’s General Stores Inc |
|
|
112,643 |
|
| 3,962 |
|
|
|
Costco Wholesale Corp |
|
|
2,615,237 |
|
| 1,590 |
|
(b) |
|
Performance Food Group Co |
|
|
109,949 |
|
| 5,221 |
|
|
|
Target Corp |
|
|
743,575 |
|
| 2,961 |
|
(b) |
|
US Foods Holding Corp |
|
|
134,459 |
|
| 13,662 |
|
|
|
Walmart Inc |
|
|
2,153,814 |
|
|
|
|
|
Total Consumer Staples Distribution & Retail |
|
|
6,147,159 |
|
|
|
|
|
|
|
|
|
|
|
|
|
|
|
Energy - 4.0% |
|
|
|
|
| 4,259 |
|
(b) |
|
Antero Resources Corp |
|
|
96,594 |
|
| 3,476 |
|
|
|
ChampionX Corp |
|
|
101,534 |
|
| 1,457 |
|
|
|
Cheniere Energy Inc |
|
|
248,724 |
|
| 2,132 |
|
|
|
Chesapeake Energy Corp |
|
|
164,036 |
|
| 19,083 |
|
|
|
Chevron Corp |
|
|
2,846,420 |
|
| 838 |
|
|
|
Chord Energy Corp |
|
|
139,301 |
|
| 1,493 |
|
|
|
Civitas Resources Inc |
|
|
102,091 |
|
| 4,421 |
|
(b) |
|
CNX Resources Corp |
|
|
88,420 |
|
| 3,448 |
|
|
|
Comstock Resources Inc |
|
|
30,515 |
|
| 12,889 |
|
|
|
ConocoPhillips |
|
|
1,496,026 |
|
| 2,931 |
|
(b) |
|
Dril-Quip Inc |
|
|
68,204 |
|
| 4,475 |
|
|
|
Equitrans Midstream Corp |
|
|
45,556 |
|
| 34,642 |
|
|
|
Exxon Mobil Corp |
|
|
3,463,507 |
|
| 1,270 |
|
|
|
HF Sinclair Corp |
|
|
70,574 |
|
| 4,787 |
|
|
|
Liberty Energy Inc |
|
|
86,836 |
|
| 9,638 |
|
|
|
Magnolia Oil & Gas Corp, Class A |
|
|
205,193 |
|
| 6,358 |
|
|
|
Marathon Petroleum Corp |
|
|
943,273 |
|
| 4,582 |
|
|
|
Murphy Oil Corp |
|
|
195,468 |
|
| 11,967 |
|
|
|
NOV Inc |
|
|
242,692 |
|
| 5,586 |
|
|
|
Ovintiv Inc |
|
|
245,337 |
|
| 4,978 |
|
|
|
Permian Resources Corp |
|
|
67,701 |
|
| 4,093 |
|
|
|
Range Resources Corp |
|
|
124,591 |
|
| 3,108 |
|
|
|
SM Energy Co |
|
|
120,342 |
|
| 14,618 |
|
(b) |
|
Southwestern Energy Co |
|
|
95,748 |
|
| 8,230 |
|
|
|
TechnipFMC PLC |
|
|
165,752 |
|
| 52 |
|
|
|
Texas Pacific Land Corp |
|
|
81,767 |
|
| 16,647 |
|
(b) |
|
Transocean Ltd |
|
|
105,708 |
|
|
|
|
|
Total Energy |
|
|
11,641,910 |
|
|
|
|
|
|
|
42
|
|
|
|
|
|
|
|
|
| Shares |
|
|
|
Description (a) |
|
Value |
|
|
|
|
|
|
|
|
Equity Real Estate Investment Trusts (REITs) - 2.8% |
|
|
|
|
| 5,517 |
|
|
|
Agree Realty Corp |
|
$ |
347,295 |
|
| 6,767 |
|
|
|
American Homes 4 Rent, Class A |
|
|
243,341 |
|
| 5,198 |
|
|
|
Americold Realty Trust Inc |
|
|
157,343 |
|
| 17,428 |
|
|
|
Brandywine Realty Trust |
|
|
94,111 |
|
| 15,872 |
|
|
|
Brixmor Property Group Inc |
|
|
369,341 |
|
| 7,025 |
|
|
|
Cousins Properties Inc |
|
|
171,059 |
|
| 3,215 |
|
|
|
CubeSmart |
|
|
149,015 |
|
| 1,929 |
|
|
|
EastGroup Properties Inc |
|
|
354,049 |
|
| 6,011 |
|
|
|
Equity LifeStyle Properties Inc |
|
|
424,016 |
|
| 2,673 |
|
|
|
Extra Space Storage Inc |
|
|
428,562 |
|
| 10,582 |
|
|
|
First Industrial Realty Trust Inc |
|
|
557,354 |
|
| 5,928 |
|
|
|
Gaming and Leisure Properties Inc |
|
|
292,547 |
|
| 10,252 |
|
|
|
Healthcare Realty Trust Inc |
|
|
176,641 |
|
| 3,292 |
|
|
|
Hudson Pacific Properties Inc |
|
|
30,649 |
|
| 10,680 |
|
|
|
Independence Realty Trust Inc |
|
|
163,404 |
|
| 464 |
|
|
|
Innovative Industrial Properties Inc |
|
|
46,780 |
|
| 2,264 |
|
|
|
Lamar Advertising Co, Class A |
|
|
240,618 |
|
| 3,983 |
|
|
|
Macerich Co/The |
|
|
61,458 |
|
| 8,080 |
|
|
|
Medical Properties Trust Inc |
|
|
39,673 |
|
| 2,140 |
|
(b) |
|
NET Lease Office Properties |
|
|
39,547 |
|
| 8,772 |
|
|
|
NNN REIT Inc |
|
|
378,074 |
|
| 5,266 |
|
|
|
Omega Healthcare Investors Inc |
|
|
161,456 |
|
| 3,825 |
|
|
|
Outfront Media Inc |
|
|
53,397 |
|
| 5,255 |
|
|
|
Pebblebrook Hotel Trust |
|
|
83,975 |
|
| 7,163 |
|
|
|
Phillips Edison & Co Inc |
|
|
261,306 |
|
| 2,626 |
|
|
|
PotlatchDeltic Corp |
|
|
128,937 |
|
| 10,701 |
|
|
|
Prologis Inc |
|
|
1,426,444 |
|
| 3,334 |
|
|
|
Rexford Industrial Realty Inc |
|
|
187,037 |
|
| 9,345 |
|
|
|
RLJ Lodging Trust |
|
|
109,523 |
|
| 1,110 |
|
|
|
Ryman Hospitality Properties Inc |
|
|
122,167 |
|
| 4,775 |
|
|
|
Service Properties Trust |
|
|
40,779 |
|
| 13,021 |
|
|
|
SITE Centers Corp |
|
|
177,476 |
|
| 965 |
|
|
|
SL Green Realty Corp |
|
|
43,589 |
|
| 11,317 |
|
|
|
Summit Hotel Properties Inc |
|
|
76,050 |
|
| 1,074 |
|
|
|
Sun Communities Inc |
|
|
143,540 |
|
| 2,836 |
|
|
|
WP Carey Inc |
|
|
183,801 |
|
| 6,435 |
|
|
|
Xenia Hotels & Resorts Inc |
|
|
87,645 |
|
|
|
|
|
Total Equity Real Estate Investment Trusts (REITs) |
|
|
8,051,999 |
|
|
|
|
|
|
|
|
|
|
|
|
|
|
|
Financial Services - 8.2% |
|
|
|
|
| 890 |
|
(b) |
|
Affirm Holdings Inc |
|
|
43,735 |
|
| 2,624 |
|
|
|
Ally Financial Inc |
|
|
91,630 |
|
| 6,384 |
|
|
|
American Express Co |
|
|
1,195,978 |
|
| 6,647 |
|
|
|
Annaly Capital Management Inc |
|
|
128,752 |
|
| 15,838 |
|
(b),(d) |
|
Berkshire Hathaway Inc, Class B |
|
|
5,648,781 |
|
| 1,444 |
|
|
|
BlackRock Inc |
|
|
1,172,239 |
|
| 1,558 |
|
(b) |
|
Block Inc |
|
|
120,511 |
|
| 13,049 |
|
|
|
Charles Schwab Corp/The |
|
|
897,771 |
|
| 304 |
|
(b) |
|
Coinbase Global Inc, Class A |
|
|
52,872 |
|
| 4,161 |
|
|
|
Corebridge Financial Inc |
|
|
90,127 |
|
| 5,499 |
|
|
|
Equitable Holdings Inc |
|
|
183,117 |
|
| 3,860 |
|
|
|
Goldman Sachs Group Inc/The |
|
|
1,489,072 |
|
| 1,068 |
|
|
|
Interactive Brokers Group Inc, Class A |
|
|
88,537 |
|
| 8,753 |
|
|
|
Intercontinental Exchange Inc |
|
|
1,124,148 |
|
| 3,908 |
|
|
|
KKR & Co Inc |
|
|
323,778 |
|
| 508 |
|
|
|
LPL Financial Holdings Inc |
|
|
115,631 |
|
| 7,480 |
|
|
|
Mastercard Inc, Class A |
|
|
3,190,295 |
|
| 7,780 |
|
|
|
MGIC Investment Corp |
|
|
150,076 |
|
| 14,535 |
|
|
|
Morgan Stanley |
|
|
1,355,389 |
|
| 10,922 |
|
(b) |
|
PayPal Holdings Inc |
|
|
670,720 |
|
| 684 |
|
|
|
PennyMac Financial Services Inc |
|
|
60,445 |
|
43
|
|
|
| SPXX |
|
Nuveen S&P 500 Dynamic Overwrite Fund (continued) |
|
|
Portfolio of Investments December 31, 2023 |
|
|
|
|
|
|
|
|
|
| Shares |
|
|
|
Description (a) |
|
Value |
|
|
|
|
|
|
|
|
Financial Services (continued) |
|
|
|
|
| 4,239 |
|
|
|
Radian Group Inc |
|
$ |
121,023 |
|
| 3,649 |
|
(b) |
|
Robinhood Markets Inc, Class A |
|
|
46,488 |
|
| 4,781 |
|
(b) |
|
Rocket Cos Inc, Class A |
|
|
69,229 |
|
| 3,398 |
|
|
|
S&P Global Inc |
|
|
1,496,887 |
|
| 6,607 |
|
(b) |
|
SoFi Technologies Inc |
|
|
65,740 |
|
| 1,592 |
|
(b) |
|
Toast Inc, Class A |
|
|
29,070 |
|
| 1,119 |
|
|
|
Tradeweb Markets Inc, Class A |
|
|
101,695 |
|
| 14,045 |
|
|
|
Visa Inc, Class A |
|
|
3,656,616 |
|
| 5,055 |
|
|
|
Voya Financial Inc |
|
|
368,813 |
|
| 8,999 |
|
|
|
Western Union Co/The |
|
|
107,268 |
|
|
|
|
|
Total Financial Services |
|
|
24,256,433 |
|
|
|
|
|
|
|
|
|
|
|
|
|
|
|
Food, Beverage & Tobacco - 2.9% |
|
|
|
|
| 188 |
|
(b) |
|
Boston Beer Co Inc/The, Class A |
|
|
64,971 |
|
| 846 |
|
|
|
Cal-Maine Foods Inc |
|
|
48,552 |
|
| 46,630 |
|
|
|
Coca-Cola Co/The |
|
|
2,747,906 |
|
| 1,222 |
|
(b) |
|
Darling Ingredients Inc |
|
|
60,904 |
|
| 22,961 |
|
|
|
Flowers Foods Inc |
|
|
516,853 |
|
| 646 |
|
(b) |
|
Freshpet Inc |
|
|
56,047 |
|
| 2,959 |
|
|
|
Ingredion Inc |
|
|
321,140 |
|
| 485 |
|
|
|
Lancaster Colony Corp |
|
|
80,699 |
|
| 16,493 |
|
|
|
PepsiCo Inc |
|
|
2,801,171 |
|
| 13,855 |
|
|
|
Philip Morris International Inc |
|
|
1,303,478 |
|
| 5,129 |
|
(b) |
|
Pilgrim’s Pride Corp |
|
|
141,868 |
|
| 4,453 |
|
(b) |
|
Post Holdings Inc |
|
|
392,132 |
|
| 2,100 |
|
(b) |
|
Simply Good Foods Co/The |
|
|
83,160 |
|
| 1,601 |
|
(b) |
|
TreeHouse Foods Inc |
|
|
66,361 |
|
|
|
|
|
Total Food, Beverage & Tobacco |
|
|
8,685,242 |
|
|
|
|
|
|
|
|
|
|
|
|
|
|
|
Health Care Equipment & Services - 5.8% |
|
|
|
|
| 18,190 |
|
|
|
Abbott Laboratories |
|
|
2,002,173 |
|
| 1,223 |
|
(b) |
|
Acadia Healthcare Co Inc |
|
|
95,100 |
|
| 655 |
|
(b) |
|
Amedisys Inc |
|
|
62,264 |
|
| 23,584 |
|
(b) |
|
Boston Scientific Corp |
|
|
1,363,391 |
|
| 279 |
|
|
|
Chemed Corp |
|
|
163,145 |
|
| 1,373 |
|
|
|
CONMED Corp |
|
|
150,357 |
|
| 11,075 |
|
|
|
CVS Health Corp |
|
|
874,482 |
|
| 1,637 |
|
(b) |
|
Doximity Inc, Class A |
|
|
45,901 |
|
| 2,725 |
|
|
|
Elevance Health Inc |
|
|
1,285,002 |
|
| 2,253 |
|
|
|
Encompass Health Corp |
|
|
150,320 |
|
| 1,716 |
|
(b) |
|
Enhabit Inc |
|
|
17,761 |
|
| 2,404 |
|
(b) |
|
Enovis Corp |
|
|
134,672 |
|
| 5,911 |
|
(b) |
|
Envista Holdings Corp |
|
|
142,219 |
|
| 2,780 |
|
(b) |
|
Globus Medical Inc, Class A |
|
|
148,146 |
|
| 757 |
|
(b) |
|
Haemonetics Corp |
|
|
64,731 |
|
| 1,783 |
|
|
|
Humana Inc |
|
|
816,275 |
|
| 639 |
|
(b) |
|
ICU Medical Inc |
|
|
63,734 |
|
| 767 |
|
(b) |
|
Inari Medical Inc |
|
|
49,794 |
|
| 481 |
|
(b) |
|
Inspire Medical Systems Inc |
|
|
97,850 |
|
| 3,572 |
|
(b) |
|
Intuitive Surgical Inc |
|
|
1,205,050 |
|
| 697 |
|
(b) |
|
Lantheus Holdings Inc |
|
|
43,214 |
|
| 1,911 |
|
|
|
McKesson Corp |
|
|
884,755 |
|
| 15,485 |
|
|
|
Medtronic PLC |
|
|
1,275,654 |
|
| 1,383 |
|
(b) |
|
Merit Medical Systems Inc |
|
|
105,053 |
|
| 5,175 |
|
(b) |
|
Neogen Corp |
|
|
104,069 |
|
| 1,008 |
|
(b) |
|
Omnicell Inc |
|
|
37,931 |
|
| 2,090 |
|
(b) |
|
Option Care Health Inc |
|
|
70,412 |
|
| 433 |
|
(b) |
|
Penumbra Inc |
|
|
108,917 |
|
| 689 |
|
(b) |
|
QuidelOrtho Corp |
|
|
50,779 |
|
| 162 |
|
(b) |
|
Shockwave Medical Inc |
|
|
30,871 |
|
| 725 |
|
(b) |
|
STAAR Surgical Co |
|
|
22,627 |
|
44
|
|
|
|
|
|
|
|
|
| Shares |
|
|
|
Description (a) |
|
Value |
|
|
|
|
|
|
|
|
Health Care Equipment & Services (continued) |
|
|
|
|
| 1,122 |
|
(b) |
|
Tandem Diabetes Care Inc |
|
$ |
33,189 |
|
| 3,394 |
|
(b) |
|
Teladoc Health Inc |
|
|
73,141 |
|
| 1,806 |
|
(b) |
|
Tenet Healthcare Corp |
|
|
136,479 |
|
| 8,873 |
|
|
|
UnitedHealth Group Inc |
|
|
4,671,369 |
|
| 1,340 |
|
(b) |
|
Veeva Systems Inc, Class A |
|
|
257,977 |
|
|
|
|
|
Total Health Care Equipment & Services |
|
|
16,838,804 |
|
|
|
|
|
|
|
|
|
|
|
|
|
|
|
Household & Personal Products - 1.1% |
|
|
|
|
| 1,282 |
|
(b) |
|
BellRing Brands Inc |
|
|
71,061 |
|
| 22,455 |
|
|
|
Procter & Gamble Co/The |
|
|
3,290,556 |
|
|
|
|
|
Total Household & Personal Products |
|
|
3,361,617 |
|
|
|
|
|
|
|
|
|
|
|
|
|
|
|
Insurance - 2.4% |
|
|
|
|
| 2,124 |
|
|
|
American Equity Investment Life Holding Co |
|
|
118,519 |
|
| 1,883 |
|
|
|
American Financial Group Inc/OH |
|
|
223,870 |
|
| 5,688 |
|
|
|
Arthur J Gallagher & Co |
|
|
1,279,117 |
|
| 2,593 |
|
(b) |
|
Brighthouse Financial Inc |
|
|
137,222 |
|
| 4,942 |
|
|
|
Fidelity National Financial Inc |
|
|
252,141 |
|
| 1,586 |
|
|
|
Hanover Insurance Group Inc/The |
|
|
192,572 |
|
| 196 |
|
|
|
Kinsale Capital Group Inc |
|
|
65,642 |
|
| 177 |
|
(b) |
|
Markel Group Inc |
|
|
251,322 |
|
| 8,946 |
|
|
|
Marsh & McLennan Cos Inc |
|
|
1,694,998 |
|
| 9,595 |
|
|
|
Old Republic International Corp |
|
|
282,093 |
|
| 1,422 |
|
|
|
Primerica Inc |
|
|
292,591 |
|
| 1,161 |
|
|
|
Reinsurance Group of America Inc |
|
|
187,827 |
|
| 436 |
|
|
|
RenaissanceRe Holdings Ltd |
|
|
85,456 |
|
| 1,346 |
|
|
|
RLI Corp |
|
|
179,180 |
|
| 1,755 |
|
|
|
Selective Insurance Group Inc |
|
|
174,587 |
|
| 6,012 |
|
|
|
Travelers Cos Inc/The |
|
|
1,145,226 |
|
| 7,525 |
|
|
|
Unum Group |
|
|
340,281 |
|
|
|
|
|
Total Insurance |
|
|
6,902,644 |
|
|
|
|
|
|
|
|
|
|
|
|
|
|
|
Materials - 2.2% |
|
|
|
|
| 2,176 |
|
|
|
Alcoa Corp |
|
|
73,984 |
|
| 2,733 |
|
|
|
Ashland Inc |
|
|
230,419 |
|
| 7,632 |
|
(b) |
|
Axalta Coating Systems Ltd |
|
|
259,259 |
|
| 3,411 |
|
|
|
Berry Global Group Inc |
|
|
229,867 |
|
| 2,824 |
|
|
|
Cabot Corp |
|
|
235,804 |
|
| 4,941 |
|
|
|
Chemours Co/The |
|
|
155,839 |
|
| 4,597 |
|
(b) |
|
Cleveland-Cliffs Inc |
|
|
93,871 |
|
| 4,146 |
|
|
|
Crown Holdings Inc |
|
|
381,805 |
|
| 12,941 |
|
|
|
Element Solutions Inc |
|
|
299,455 |
|
| 10,647 |
|
|
|
Graphic Packaging Holding Co |
|
|
262,449 |
|
| 3,334 |
|
|
|
HB Fuller Co |
|
|
271,421 |
|
| 14,773 |
|
|
|
Hecla Mining Co |
|
|
71,058 |
|
| 11,656 |
|
|
|
Huntsman Corp |
|
|
292,915 |
|
| 1,271 |
|
(b) |
|
Ingevity Corporation |
|
|
60,017 |
|
| 1,550 |
|
|
|
Louisiana-Pacific Corp |
|
|
109,787 |
|
| 1,379 |
|
|
|
Minerals Technologies Inc |
|
|
98,336 |
|
| 2,400 |
|
(b) |
|
MP Materials Corp |
|
|
47,640 |
|
| 225 |
|
|
|
NewMarket Corp |
|
|
122,812 |
|
| 3,302 |
|
|
|
Olin Corp |
|
|
178,143 |
|
| 555 |
|
|
|
Reliance Steel & Aluminum Co |
|
|
155,222 |
|
| 2,738 |
|
|
|
Royal Gold Inc |
|
|
331,189 |
|
| 3,446 |
|
|
|
RPM International Inc |
|
|
384,677 |
|
| 1,203 |
|
|
|
Scotts Miracle-Gro Co/The |
|
|
76,691 |
|
| 1,986 |
|
|
|
Sensient Technologies Corp |
|
|
131,076 |
|
| 4,526 |
|
|
|
Silgan Holdings Inc |
|
|
204,802 |
|
| 4,146 |
|
|
|
Sonoco Products Co |
|
|
231,637 |
|
45
|
|
|
| SPXX |
|
Nuveen S&P 500 Dynamic Overwrite Fund (continued) |
|
|
Portfolio of Investments December 31, 2023 |
|
|
|
|
|
|
|
|
|
| Shares |
|
|
|
Description (a) |
|
Value |
|
|
|
|
|
|
|
|
|
Materials (continued) |
|
|
|
|
| 2,718 |
|
|
|
Southern Copper Corp |
|
$ |
233,938 |
|
| 5,367 |
|
|
|
SSR Mining Inc |
|
|
57,749 |
|
| 1,068 |
|
|
|
Stepan Co |
|
|
100,979 |
|
| 8,818 |
|
|
|
Tronox Holdings PLC |
|
|
124,863 |
|
| 3,022 |
|
|
|
United States Steel Corp |
|
|
147,020 |
|
| 6,256 |
|
|
|
Valvoline Inc |
|
|
235,100 |
|
| 1,794 |
|
|
|
Westlake Corp |
|
|
251,088 |
|
|
|
|
|
Total Materials |
|
|
6,140,912 |
|
|
|
|
|
|
|
|
|
|
|
|
|
|
|
Media & Entertainment - 7.9% |
|
|
|
|
| 44,594 |
|
(b),(d) |
|
Alphabet Inc, Class A |
|
|
6,229,336 |
|
| 37,014 |
|
(b),(d) |
|
Alphabet Inc, Class C |
|
|
5,216,383 |
|
| 3,071 |
|
(b) |
|
Atlanta Braves Holdings Inc, Class C |
|
|
121,550 |
|
| 109 |
|
|
|
Cable One Inc |
|
|
60,668 |
|
| 40,347 |
|
|
|
Comcast Corp, Class A |
|
|
1,769,215 |
|
| 1,498 |
|
(b) |
|
IAC Inc |
|
|
78,465 |
|
| 2,501 |
|
(b) |
|
Liberty Broadband Corp, Class A |
|
|
201,681 |
|
| 1,107 |
|
(b) |
|
Liberty Media Corp-Liberty Formula One, Class A |
|
|
64,184 |
|
| 1,131 |
|
(b) |
|
Liberty Media Corp-Liberty Live, Class A |
|
|
41,338 |
|
| 16,581 |
|
(b) |
|
Meta Platforms Inc |
|
|
5,869,011 |
|
| 3,464 |
|
(b) |
|
Netflix Inc |
|
|
1,686,553 |
|
| 2,539 |
|
(b) |
|
Pinterest Inc, Class A |
|
|
94,045 |
|
| 1,382 |
|
(b) |
|
ROBLOX Corp, Class A |
|
|
63,185 |
|
| 641 |
|
(b) |
|
Roku Inc |
|
|
58,754 |
|
| 29,033 |
|
(c) |
|
Sirius XM Holdings Inc |
|
|
158,811 |
|
| 721 |
|
(b) |
|
Spotify Technology SA |
|
|
135,483 |
|
| 704 |
|
(b) |
|
TKO Group Holdings Inc |
|
|
57,432 |
|
| 2,279 |
|
(b) |
|
TripAdvisor Inc |
|
|
49,067 |
|
| 14,897 |
|
|
|
Walt Disney Co/The |
|
|
1,345,050 |
|
|
|
|
|
Total Media & Entertainment |
|
|
23,300,211 |
|
|
|
|
|
|
|
|
|
|
|
|
|
|
|
Pharmaceuticals, Biotechnology & Life Sciences - 7.4% |
|
|
|
|
| 15,731 |
|
|
|
AbbVie Inc |
|
|
2,437,833 |
|
| 2,527 |
|
(b) |
|
Alkermes PLC |
|
|
70,099 |
|
| 5,222 |
|
(d) |
|
Amgen Inc |
|
|
1,504,040 |
|
| 913 |
|
(b) |
|
BioMarin Pharmaceutical Inc |
|
|
88,031 |
|
| 19,264 |
|
|
|
Bristol-Myers Squibb Co |
|
|
988,436 |
|
| 1,543 |
|
|
|
Bruker Corp |
|
|
113,380 |
|
| 5,786 |
|
|
|
Danaher Corp |
|
|
1,338,533 |
|
| 5,649 |
|
(b) |
|
Elanco Animal Health Inc |
|
|
84,170 |
|
| 6,385 |
|
|
|
Eli Lilly & Co |
|
|
3,721,943 |
|
| 1,149 |
|
(b) |
|
Exact Sciences Corp |
|
|
85,003 |
|
| 4,414 |
|
(b) |
|
Exelixis Inc |
|
|
105,892 |
|
| 1,972 |
|
(b) |
|
Halozyme Therapeutics Inc |
|
|
72,885 |
|
| 1,132 |
|
(b) |
|
Ionis Pharmaceuticals Inc |
|
|
57,268 |
|
| 1,034 |
|
(b) |
|
Jazz Pharmaceuticals PLC |
|
|
127,182 |
|
| 19,612 |
|
|
|
Johnson & Johnson |
|
|
3,073,985 |
|
| 395 |
|
(b) |
|
Medpace Holdings Inc |
|
|
121,079 |
|
| 23,887 |
|
|
|
Merck & Co Inc |
|
|
2,604,161 |
|
| 462 |
|
(b) |
|
Mirati Therapeutics Inc |
|
|
27,143 |
|
| 3,026 |
|
(b) |
|
Mural Oncology PLC |
|
|
17,914 |
|
| 904 |
|
(b) |
|
Neurocrine Biosciences Inc |
|
|
119,111 |
|
| 50,011 |
|
|
|
Pfizer Inc |
|
|
1,439,817 |
|
| 3,594 |
|
(b) |
|
QIAGEN NV |
|
|
156,087 |
|
| 186 |
|
(b) |
|
Repligen Corp |
|
|
33,443 |
|
| 5,318 |
|
|
|
Royalty Pharma PLC |
|
|
149,383 |
|
| 399 |
|
(b) |
|
Sarepta Therapeutics Inc |
|
|
38,476 |
|
| 3,729 |
|
|
|
Thermo Fisher Scientific Inc |
|
|
1,979,316 |
|
| 798 |
|
(b) |
|
United Therapeutics Corp |
|
|
175,472 |
|
46
|
|
|
|
|
|
|
|
|
| Shares |
|
|
|
Description (a) |
|
Value |
|
|
|
|
|
|
|
|
Pharmaceuticals, Biotechnology & Life Sciences (continued) |
|
|
|
|
| 2,534 |
|
(b) |
|
Vertex Pharmaceuticals Inc |
|
$ |
1,031,059 |
|
|
|
|
|
Total Pharmaceuticals, Biotechnology & Life Sciences |
|
|
21,761,141 |
|
|
|
|
|
|
|
|
|
|
|
|
|
|
|
Real Estate Management & Development - 0.1% |
|
|
|
|
| 1,786 |
|
(b) |
|
Anywhere Real Estate Inc |
|
|
14,484 |
|
| 1,600 |
|
(c) |
|
eXp World Holdings Inc |
|
|
24,832 |
|
| 1,231 |
|
(b) |
|
Jones Lang LaSalle Inc |
|
|
232,499 |
|
| 2,648 |
|
(b) |
|
Seritage Growth Properties, Class A |
|
|
24,759 |
|
| 1,785 |
|
(b) |
|
Zillow Group Inc, Class C |
|
|
103,280 |
|
|
|
|
|
Total Real Estate Management & Development |
|
|
399,854 |
|
|
|
|
|
|
|
|
|
|
|
|
|
|
|
Semiconductors & Semiconductor Equipment - 7.8% |
|
|
|
|
| 5,912 |
|
|
|
Analog Devices Inc |
|
|
1,173,887 |
|
| 11,856 |
|
|
|
Applied Materials Inc |
|
|
1,921,502 |
|
| 3,687 |
|
|
|
Broadcom Inc |
|
|
4,115,614 |
|
| 34,415 |
|
|
|
Intel Corp |
|
|
1,729,354 |
|
| 861 |
|
(b) |
|
Lattice Semiconductor Corp |
|
|
59,400 |
|
| 3,050 |
|
|
|
Marvell Technology Inc |
|
|
183,946 |
|
| 9,246 |
|
|
|
Microchip Technology Inc |
|
|
833,804 |
|
| 1,740 |
|
|
|
MKS INSTRUMENTS INC |
|
|
178,994 |
|
| 18,369 |
|
|
|
NVIDIA Corp |
|
|
9,096,696 |
|
| 10,222 |
|
|
|
QUALCOMM Inc |
|
|
1,478,408 |
|
| 1,337 |
|
(b) |
|
Semtech Corp |
|
|
29,294 |
|
| 10,200 |
|
|
|
Texas Instruments Inc |
|
|
1,738,692 |
|
| 521 |
|
|
|
Universal Display Corp |
|
|
99,646 |
|
| 597 |
|
(b) |
|
Wolfspeed Inc |
|
|
25,975 |
|
|
|
|
|
Total Semiconductors & Semiconductor Equipment |
|
|
22,665,212 |
|
|
|
|
|
|
|
|
|
|
|
|
|
|
|
Software & Services - 10.7% |
|
|
|
|
| 3,572 |
|
(b) |
|
Adobe Inc |
|
|
2,131,056 |
|
| 993 |
|
(b) |
|
Altair Engineering Inc, Class A |
|
|
83,561 |
|
| 2,425 |
|
|
|
Amdocs Ltd |
|
|
213,133 |
|
| 387 |
|
(b) |
|
BILL Holdings Inc |
|
|
31,575 |
|
| 937 |
|
(b) |
|
BlackLine Inc |
|
|
58,506 |
|
| 2,883 |
|
(b) |
|
Box Inc, Class A |
|
|
73,834 |
|
| 805 |
|
(b) |
|
Cloudflare Inc, Class A |
|
|
67,024 |
|
| 581 |
|
(b) |
|
Crowdstrike Holdings Inc, Class A |
|
|
148,341 |
|
| 747 |
|
(b) |
|
DocuSign Inc |
|
|
44,409 |
|
| 7,313 |
|
(b) |
|
Dropbox Inc, Class A |
|
|
215,587 |
|
| 1,426 |
|
(b) |
|
Dynatrace Inc |
|
|
77,988 |
|
| 515 |
|
(b) |
|
Elastic NV |
|
|
58,041 |
|
| 1,172 |
|
(b) |
|
Five9 Inc |
|
|
92,225 |
|
| 340 |
|
(b) |
|
Globant SA |
|
|
80,913 |
|
| 2,467 |
|
(b) |
|
GoDaddy Inc, Class A |
|
|
261,898 |
|
| 2,495 |
|
|
|
Intuit Inc |
|
|
1,559,450 |
|
| 673 |
|
(b) |
|
Manhattan Associates Inc |
|
|
144,910 |
|
| 55,232 |
|
|
|
Microsoft Corp |
|
|
20,769,442 |
|
| 55 |
|
(b) |
|
MicroStrategy Inc, Class A |
|
|
34,739 |
|
| 192 |
|
(b) |
|
MongoDB Inc |
|
|
78,499 |
|
| 2,273 |
|
(b) |
|
Nutanix Inc, Class A |
|
|
108,399 |
|
| 370 |
|
(b) |
|
Okta Inc |
|
|
33,496 |
|
| 14,001 |
|
|
|
Oracle Corp |
|
|
1,476,125 |
|
| 4,962 |
|
(b) |
|
Palantir Technologies Inc, Class A |
|
|
85,198 |
|
| 872 |
|
|
|
Pegasystems Inc |
|
|
42,606 |
|
| 454 |
|
(b) |
|
Rapid7 Inc |
|
|
25,923 |
|
| 1,278 |
|
(b) |
|
RingCentral Inc, Class A |
|
|
43,388 |
|
| 7,476 |
|
(b) |
|
Salesforce Inc |
|
|
1,967,235 |
|
| 2,769 |
|
(b) |
|
SentinelOne Inc, Class A |
|
|
75,981 |
|
| 237 |
|
(b) |
|
Snowflake Inc, Class A |
|
|
47,163 |
|
| 1,000 |
|
(b) |
|
Splunk Inc |
|
|
152,350 |
|
47
|
|
|
| SPXX |
|
Nuveen S&P 500 Dynamic Overwrite Fund (continued) |
|
|
Portfolio of Investments December 31, 2023 |
|
|
|
|
|
|
|
|
|
| Shares |
|
|
|
Description (a) |
|
Value |
|
|
|
|
|
|
|
|
Software & Services (continued) |
|
|
|
|
| 1,641 |
|
(b) |
|
Teradata Corp |
|
$ |
71,400 |
|
| 632 |
|
(b) |
|
Trade Desk Inc/The, Class A |
|
|
45,479 |
|
| 1,346 |
|
(b) |
|
Twilio Inc, Class A |
|
|
102,121 |
|
| 3,241 |
|
(b) |
|
UiPath Inc, Class A |
|
|
80,506 |
|
| 1,252 |
|
(b) |
|
Unity Software Inc |
|
|
51,194 |
|
| 410 |
|
(b) |
|
Wix.com Ltd |
|
|
50,438 |
|
| 1,207 |
|
(b) |
|
Workday Inc, Class A |
|
|
333,204 |
|
| 1,513 |
|
(b) |
|
Ziff Davis Inc |
|
|
101,658 |
|
| 2,638 |
|
(b) |
|
Zoom Video Communications Inc, Class A |
|
|
189,699 |
|
|
|
|
|
Total Software & Services |
|
|
31,308,694 |
|
|
|
|
|
|
|
|
|
|
|
|
|
|
|
Technology Hardware & Equipment - 8.3% |
|
|
|
|
| 108,834 |
|
(d) |
|
Apple Inc |
|
|
20,953,809 |
|
| 1,206 |
|
(b) |
|
Arrow Electronics Inc |
|
|
147,434 |
|
| 3,111 |
|
|
|
Avnet Inc |
|
|
156,794 |
|
| 3,370 |
|
(b) |
|
Ciena Corp |
|
|
151,684 |
|
| 43,703 |
|
|
|
Cisco Systems Inc |
|
|
2,207,875 |
|
| 1,796 |
|
(b) |
|
Coherent Corp |
|
|
78,180 |
|
| 5,255 |
|
|
|
Dell Technologies Inc, Class C |
|
|
402,008 |
|
| 691 |
|
(b) |
|
IPG Photonics Corp |
|
|
75,001 |
|
| 1,617 |
|
|
|
Jabil Inc |
|
|
206,006 |
|
| 1,321 |
|
(b) |
|
Pure Storage Inc, Class A |
|
|
47,107 |
|
|
|
|
|
Total Technology Hardware & Equipment |
|
|
24,425,898 |
|
|
|
|
|
|
|
|
|
|
|
|
|
|
|
Telecommunication Services - 0.5% |
|
|
|
|
| 1,094 |
|
(b) |
|
United States Cellular Corp |
|
|
45,445 |
|
| 37,283 |
|
|
|
Verizon Communications Inc |
|
|
1,405,569 |
|
|
|
|
|
Total Telecommunication Services |
|
|
1,451,014 |
|
|
|
|
|
|
|
|
|
|
|
|
|
|
|
Transportation - 1.7% |
|
|
|
|
| 183 |
|
|
|
Avis Budget Group Inc |
|
|
32,439 |
|
| 942 |
|
|
|
Copa Holdings SA, Class A |
|
|
100,145 |
|
| 7,757 |
|
(b),(c) |
|
Frontier Group Holdings Inc |
|
|
42,353 |
|
| 1,506 |
|
(b) |
|
GXO Logistics Inc |
|
|
92,107 |
|
| 2,294 |
|
|
|
Knight-Swift Transportation Holdings Inc |
|
|
132,249 |
|
| 397 |
|
(b) |
|
Saia Inc |
|
|
173,973 |
|
| 1,524 |
|
|
|
Spirit Airlines Inc |
|
|
24,978 |
|
| 15,981 |
|
(b) |
|
Uber Technologies Inc |
|
|
983,950 |
|
| 6,904 |
|
|
|
Union Pacific Corp |
|
|
1,695,760 |
|
| 9,091 |
|
|
|
United Parcel Service Inc, Class B |
|
|
1,429,378 |
|
| 1,308 |
|
(b) |
|
XPO Inc |
|
|
114,568 |
|
|
|
|
|
Total Transportation |
|
|
4,821,900 |
|
|
|
|
|
|
|
|
|
|
|
|
|
|
|
Utilities - 2.7% |
|
|
|
|
| 2,745 |
|
|
|
ALLETE Inc |
|
|
167,884 |
|
| 8,112 |
|
|
|
Avangrid Inc |
|
|
262,910 |
|
| 5,370 |
|
|
|
Black Hills Corp |
|
|
289,712 |
|
| 2,908 |
|
|
|
Brookfield Renewable Corp, Class A |
|
|
83,721 |
|
| 5,568 |
|
|
|
Clearway Energy Inc, Class C |
|
|
152,730 |
|
| 13,656 |
|
|
|
Consolidated Edison Inc |
|
|
1,242,286 |
|
| 18,165 |
|
|
|
Duke Energy Corp |
|
|
1,762,732 |
|
| 9,953 |
|
|
|
Essential Utilities Inc |
|
|
371,745 |
|
| 3,823 |
|
|
|
IDACORP Inc |
|
|
375,877 |
|
| 4,147 |
|
|
|
National Fuel Gas Co |
|
|
208,055 |
|
| 6,703 |
|
|
|
New Jersey Resources Corp |
|
|
298,820 |
|
| 18,838 |
|
|
|
NextEra Energy Inc |
|
|
1,144,220 |
|
| 3,208 |
|
|
|
Northwestern Energy Group Inc |
|
|
163,255 |
|
| 13,405 |
|
|
|
OGE Energy Corp |
|
|
468,237 |
|
| 837 |
|
|
|
Otter Tail Corp |
|
|
71,120 |
|
| 3,380 |
|
|
|
PNM Resources Inc |
|
|
140,608 |
|
48
|
|
|
|
|
|
|
|
|
|
|
|
|
|
|
|
|
|
|
|
|
|
|
|
|
| Shares |
|
|
|
Description (a) |
|
|
|
|
|
|
|
|
|
|
|
|
Value |
|
|
|
|
|
|
|
|
Utilities (continued) |
|
|
|
|
|
| 7,972 |
|
|
|
Portland General Electric Co |
|
|
$ |
345,506 |
|
| 1,738 |
|
|
|
Southwest Gas Holdings Inc |
|
|
|
110,102 |
|
| 1,283 |
|
(b) |
|
Sunnova Energy International Inc |
|
|
|
19,566 |
|
| 5,242 |
|
|
|
Vistra Corp |
|
|
|
201,922 |
|
|
|
|
|
Total Utilities |
|
|
|
7,881,008 |
|
|
|
|
|
|
|
|
|
|
|
Total Common Stocks (cost
$115,745,635) |
|
|
|
290,715,238 |
|
|
|
|
|
|
|
|
|
|
|
| Shares |
|
|
|
Description (a) |
|
Value |
|
|
|
|
EXCHANGE-TRADED FUNDS - 1.5% |
|
|
|
|
|
| 3,500 |
|
|
|
SPDR S&P 500 ETF Trust |
|
|
$ |
1,663,585 |
|
| 11,300 |
|
(c) |
|
Vanguard Total Stock Market ETF |
|
|
|
2,680,586 |
|
|
|
|
|
Total Exchange-Traded Funds (cost
$3,951,874) |
|
|
|
4,344,171 |
|
|
|
|
|
|
|
|
|
|
|
|
|
|
|
| Type |
|
|
|
Description (e) |
|
Number of
Contracts |
|
|
Notional
Amount (f) |
|
Exercise
Price |
|
|
Expiration
Date |
|
|
Value |
|
|
|
|
OPTIONS PURCHASED - 0.0% |
|
| Put |
|
|
|
S&P 500 Index |
|
|
17 |
|
|
$ |
7,140,000 |
|
|
$ |
4200 |
|
|
|
1/19/24 |
|
|
$ |
2,168 |
|
|
|
|
|
Total Options Purchased (cost $6,670) |
|
|
17 |
|
|
$ |
7,140,000 |
|
|
|
|
|
|
|
|
|
|
|
2,168 |
|
|
|
|
|
|
|
|
|
|
|
Total Long-Term Investments (cost
$119,704,179) |
|
|
|
|
|
|
|
|
|
|
|
|
|
|
|
|
|
|
295,061,577 |
|
|
|
|
|
|
|
|
|
|
|
|
|
|
|
| Shares |
|
|
|
Description (a) |
|
|
|
|
|
|
Coupon |
|
|
|
|
|
Value |
|
|
|
|
INVESTMENTS PURCHASED WITH COLLATERAL FROM SECURITIES LENDING - 1.0% |
|
|
|
|
|
| 2,933,198 |
|
(g) |
|
State Street Navigator Securities Lending
Government Money Market Portfolio |
|
|
|
|
|
|
|
5.360%(h) |
|
|
|
|
|
|
$ |
2,933,198 |
|
|
|
|
|
Total Investments Purchased with Collateral from Securities Lending
(cost $2,933,198) |
|
|
|
|
|
|
|
2,933,198 |
|
|
|
|
|
|
|
|
|
|
|
|
|
|
|
| Principal
Amount (000) |
|
|
|
Description (a) |
|
|
|
|
|
|
Coupon |
|
|
Maturity |
|
|
Value |
|
|
|
|
SHORT-TERM INVESTMENTS - 0.2% |
|
|
|
|
|
|
|
|
|
|
|
|
|
|
|
|
|
|
|
|
|
REPURCHASE AGREEMENTS - 0.2% |
|
|
|
|
|
|
|
|
|
|
|
|
|
|
|
|
|
|
$ 544 |
|
(i) |
|
Fixed Income Clearing Corp (FICC) |
|
|
|
|
|
|
|
1.600% |
|
|
|
1/02/24 |
|
|
$ |
543,866 |
|
|
|
|
|
Total Repurchase Agreements (cost $543,866) |
|
|
|
|
|
|
|
|
|
|
|
|
|
|
|
|
|
|
543,866 |
|
|
|
|
|
|
|
|
|
|
|
Total Short-Term Investments (cost
$543,866) |
|
|
|
|
|
|
|
|
|
|
|
|
|
|
|
|
|
|
543,866 |
|
|
|
|
|
|
|
|
|
|
|
|
|
|
|
|
|
Total Investments (cost $123,181,243) - 102.0% |
|
|
|
|
|
|
|
|
|
|
|
298,538,641 |
|
|
|
|
|
|
|
|
|
|
|
Other Assets & Liabilities, Net - (2.0)% |
|
|
|
|
|
|
|
|
|
|
|
(5,980,898 |
) |
|
|
|
|
|
|
|
|
|
|
Net Assets Applicable to Common Shares - 100% |
|
|
|
|
|
|
|
|
|
|
$ |
292,557,743 |
|
|
|
|
|
|
|
Investments in Derivatives
Options Written
|
|
|
|
|
|
|
|
|
|
|
|
|
|
|
|
|
|
|
|
|
|
|
| Type |
|
Description(e) |
|
Number of
Contracts |
|
|
Notional
Amount (f) |
|
|
Exercise
Price |
|
|
Expiration Date |
|
|
Value |
|
| Call |
|
S&P 500 Index |
|
|
(25) |
|
|
$ |
(11,500,000) |
|
|
|
$4,600 |
|
|
|
1/05/24 |
|
|
$ |
(437,125) |
|
| Call |
|
S&P 500 Index |
|
|
(50) |
|
|
|
(23,000,000) |
|
|
|
4,600 |
|
|
|
1/12/24 |
|
|
|
(910,750) |
|
| Call |
|
Russell 2000 Index |
|
|
(20) |
|
|
|
(4,100,000) |
|
|
|
2,050 |
|
|
|
1/19/24 |
|
|
|
(55,100) |
|
| Call |
|
S&P 500 Index |
|
|
(50) |
|
|
|
(23,375,000) |
|
|
|
4,675 |
|
|
|
1/19/24 |
|
|
|
(610,500) |
|
| Call |
|
S&P 500 Index |
|
|
(35) |
|
|
|
(16,450,000) |
|
|
|
4,700 |
|
|
|
1/19/24 |
|
|
|
(355,075) |
|
| Call |
|
S&P 500 Index |
|
|
(25) |
|
|
|
(11,812,500) |
|
|
|
4,725 |
|
|
|
1/19/24 |
|
|
|
(205,500) |
|
| Call |
|
S&P 500 Index |
|
|
(40) |
|
|
|
(19,100,000) |
|
|
|
4,775 |
|
|
|
1/19/24 |
|
|
|
(196,200) |
|
49
|
|
|
| SPXX |
|
Nuveen S&P 500 Dynamic Overwrite Fund (continued) |
|
|
Portfolio of Investments December 31, 2023 |
|
|
|
|
|
|
|
|
|
|
|
|
|
|
|
|
|
|
|
|
|
|
|
| Type |
|
Description(e) |
|
Number of
Contracts |
|
|
Notional
Amount (f) |
|
|
Exercise
Price |
|
|
Expiration Date |
|
|
Value |
|
| Call |
|
S&P 500 Index |
|
|
(17) |
|
|
|
$(8,160,000) |
|
|
|
$4,800 |
|
|
|
1/19/24 |
|
|
|
$(61,370) |
|
| Call |
|
S&P 500 Index |
|
|
(60) |
|
|
|
(28,800,000) |
|
|
|
4,800 |
|
|
|
1/31/24 |
|
|
|
(329,700) |
|
| Total Options Written (premiums
received $1,769,196) |
|
|
(322) |
|
|
$ |
(146,297,500) |
|
|
|
|
|
|
|
|
|
|
$ |
(3,161,320) |
|
| |
For Fund portfolio compliance purposes, the Fund’s industry classifications refer to any one or more of the industry sub-classifications used by one or more widely recognized market indexes or ratings group indexes, and/or as defined by Fund management. This definition may not apply for purposes of this report, which may combine
industry sub-classifications into sectors for reporting ease. |
| (a) |
All percentages shown in the Portfolio of Investments are based on net assets applicable to common shares unless otherwise
noted. |
| (b) |
Non-income producing; issuer has not declared an
ex-dividend date within the past twelve months. |
| (c) |
Investment, or a portion of investment, is out on loan for securities lending. The total value of the securities out on
loan as of the end of the reporting period was $2,853,286. |
| (d) |
Investment, or portion of investment, has been pledged to collateralize the net payment obligations for investments in
derivatives. |
| (e) |
Exchange-traded, unless otherwise noted. |
| (f) |
For disclosure purposes, Notional Amount is calculated by multiplying the Number of Contracts by the Exercise Price by
100. |
| (g) |
The Fund may loan securities representing up to one third of the value of its total assets (which includes collateral for
securities on loan) to broker dealers, banks, and other institutions. The collateral maintained by the Fund shall have a value, at the inception of each loan, equal to not less than 100% of the value of the loaned securities. The cash collateral
received by the Fund is invested in this money market fund. |
| (h) |
The rate shown is the one-day yield as of the end of the reporting period.
|
| (i) |
Agreement with Fixed Income Clearing Corporation, 1.600% dated 12/29/23 to be repurchased at $543,963 on 1/2/24,
collateralized by Government Agency Securities, with coupon rate 2.875% and maturity date 5/15/32, valued at $554,747. |
| ADR |
American Depositary Receipt |
| REIT |
Real Estate Investment Trust |
| SPDR |
Standard & Poor’s Depositary Receipt |
See Notes to Financial Statements
50
|
|
|
| QQQX |
|
Nuveen Nasdaq 100 Dynamic Overwrite Fund
Portfolio of Investments December 31, 2023 |
|
|
|
|
|
|
|
|
|
|
| Shares |
|
|
|
Description (a) |
|
Value |
|
|
|
|
|
LONG-TERM INVESTMENTS - 101.2% |
|
|
|
|
|
|
|
|
COMMON STOCKS - 100.0% |
|
|
|
|
|
|
|
|
|
|
|
|
Automobiles & Components - 3.5% |
|
|
|
|
| 40,233 |
|
|
|
Ford Motor Co |
|
$ |
490,440 |
|
| 4,110 |
|
|
|
Lear Corp |
|
|
580,373 |
|
| 48,771 |
|
(b),(c) |
|
Lucid Group Inc |
|
|
205,326 |
|
| 22,273 |
|
(b),(c) |
|
QuantumScape Corp |
|
|
154,798 |
|
| 22,972 |
|
(c) |
|
Rivian Automotive Inc, Class A |
|
|
538,923 |
|
| 163,806 |
|
(c) |
|
Tesla Inc |
|
|
40,702,515 |
|
|
|
|
|
Total Automobiles & Components |
|
|
42,672,375 |
|
|
|
|
|
|
|
|
|
|
|
|
|
|
|
Capital Goods - 1.4% |
|
|
|
|
| 39,235 |
|
(c) |
|
Archer Aviation Inc, Class A |
|
|
240,903 |
|
| 1,478 |
|
(c) |
|
Axon Enterprise Inc |
|
|
381,812 |
|
| 1,956 |
|
(c) |
|
Boeing Co/The |
|
|
509,851 |
|
| 9,138 |
|
|
|
Caterpillar Inc |
|
|
2,701,832 |
|
| 3,812 |
|
(b),(c) |
|
Enovix Corp |
|
|
47,726 |
|
| 7,764 |
|
|
|
Fortive Corp |
|
|
571,663 |
|
| 30,184 |
|
|
|
General Electric Co |
|
|
3,852,384 |
|
| 584 |
|
|
|
HEICO Corp |
|
|
104,460 |
|
| 2,990 |
|
|
|
Howmet Aerospace Inc |
|
|
161,819 |
|
| 6,441 |
|
(b),(c) |
|
Plug Power Inc |
|
|
28,985 |
|
| 7,632 |
|
|
|
Rockwell Automation Inc |
|
|
2,369,583 |
|
| 116 |
|
|
|
TransDigm Group Inc |
|
|
117,346 |
|
| 4,996 |
|
|
|
United Rentals Inc |
|
|
2,864,806 |
|
| 5,734 |
|
|
|
Vertiv Holdings Co, Class A |
|
|
275,404 |
|
| 1,840 |
|
|
|
Watsco Inc |
|
|
788,385 |
|
| 1,390 |
|
|
|
WW Grainger Inc |
|
|
1,151,879 |
|
|
|
|
|
Total Capital Goods |
|
|
16,168,838 |
|
|
|
|
|
|
|
|
|
|
|
|
|
|
|
Commercial & Professional Services - 0.6% |
|
|
|
|
| 21,698 |
|
(c) |
|
ACV Auctions Inc, Class A |
|
|
328,725 |
|
| 634 |
|
|
|
Booz Allen Hamilton Holding Corp |
|
|
81,095 |
|
| 9,596 |
|
(c) |
|
EAS Segment |
|
|
789,367 |
|
| 1,124 |
|
|
|
Equifax Inc |
|
|
277,954 |
|
| 19,936 |
|
|
|
Robert Half Inc |
|
|
1,752,773 |
|
| 7,070 |
|
|
|
Rollins Inc |
|
|
308,747 |
|
| 4,378 |
|
|
|
Tetra Tech Inc |
|
|
730,819 |
|
| 7,562 |
|
|
|
Waste Connections Inc |
|
|
1,128,780 |
|
| 9,915 |
|
|
|
Waste Management Inc |
|
|
1,775,776 |
|
|
|
|
|
Total Commercial & Professional Services |
|
|
7,174,036 |
|
|
|
|
|
|
|
|
|
|
|
|
|
|
|
Consumer Discretionary Distribution & Retail - 6.9% |
|
|
|
|
| 3,906 |
|
(c) |
|
Abercrombie & Fitch Co, Class A |
|
|
344,587 |
|
| 394,145 |
|
(c),(d) |
|
Amazon.com Inc |
|
|
59,886,391 |
|
| 5,446 |
|
|
|
American Eagle Outfitters Inc |
|
|
115,237 |
|
| 940 |
|
(c) |
|
AutoZone Inc |
|
|
2,430,473 |
|
| 1,817 |
|
(c) |
|
Burlington Stores Inc |
|
|
353,370 |
|
| 1,711 |
|
(c) |
|
Carvana Co |
|
|
90,580 |
|
| 52,348 |
|
(c) |
|
Coupang Inc |
|
|
847,514 |
|
| 8,039 |
|
|
|
Dick’s Sporting Goods Inc |
|
|
1,181,331 |
|
| 1,571 |
|
|
|
Dillard’s Inc, Class A |
|
|
634,134 |
|
| 41,606 |
|
|
|
eBay Inc |
|
|
1,814,854 |
|
| 12,343 |
|
(c) |
|
Etsy Inc |
|
|
1,000,400 |
|
| 2,402 |
|
(c) |
|
Five Below Inc |
|
|
512,010 |
|
| 5,972 |
|
|
|
Gap Inc/The |
|
|
124,875 |
|
| 14,472 |
|
|
|
Genuine Parts Co |
|
|
2,004,372 |
|
| 20,421 |
|
|
|
LKQ Corp |
|
|
975,920 |
|
51
|
|
|
| QQQX |
|
Nuveen Nasdaq 100 Dynamic Overwrite Fund (continued) |
|
|
Portfolio of Investments December 31, 2023 |
|
|
|
|
|
|
|
|
|
| Shares |
|
|
|
Description (a) |
|
Value |
|
|
|
|
|
|
|
|
Consumer Discretionary Distribution & Retail (continued) |
|
|
|
|
| 4,325 |
|
|
|
Lowe’s Cos Inc |
|
$ |
962,529 |
|
| 14,611 |
|
(c) |
|
Ollie’s Bargain Outlet Holdings Inc |
|
|
1,108,829 |
|
| 7,621 |
|
|
|
Pool Corp |
|
|
3,038,569 |
|
| 4,547 |
|
(c) |
|
Savers Value Village Inc |
|
|
79,027 |
|
| 24,886 |
|
|
|
TJX Cos Inc/The |
|
|
2,334,556 |
|
| 6,915 |
|
|
|
Tractor Supply Co |
|
|
1,486,932 |
|
| 2,331 |
|
(c) |
|
Ulta Beauty Inc |
|
|
1,142,167 |
|
| 4,507 |
|
(c) |
|
Wayfair Inc, Class A |
|
|
278,082 |
|
| 3,191 |
|
|
|
Williams-Sonoma Inc |
|
|
643,880 |
|
|
|
|
|
Total Consumer Discretionary Distribution & Retail |
|
|
83,390,619 |
|
|
|
|
|
|
|
|
|
|
|
|
|
|
|
Consumer Durables & Apparel - 0.4% |
|
|
|
|
| 2,696 |
|
(c) |
|
Deckers Outdoor Corp |
|
|
1,802,087 |
|
| 27,957 |
|
|
|
NIKE Inc, Class B |
|
|
3,035,291 |
|
| 3,437 |
|
(c) |
|
Skechers USA Inc, Class A |
|
|
214,263 |
|
|
|
|
|
Total Consumer Durables & Apparel |
|
|
5,051,641 |
|
|
|
|
|
|
|
|
|
|
|
|
|
|
|
Consumer Services - 3.1% |
|
|
|
|
| 6,160 |
|
(c) |
|
Booking Holdings Inc |
|
|
21,850,875 |
|
| 1,740 |
|
(c) |
|
Chipotle Mexican Grill Inc |
|
|
3,979,310 |
|
| 21,002 |
|
|
|
Darden Restaurants Inc |
|
|
3,450,629 |
|
| 433 |
|
|
|
Domino’s Pizza Inc |
|
|
178,496 |
|
| 13,319 |
|
(c) |
|
DraftKings Inc, Class A |
|
|
469,495 |
|
| 602 |
|
(c) |
|
Duolingo Inc |
|
|
136,564 |
|
| 26,996 |
|
|
|
Hilton Worldwide Holdings Inc |
|
|
4,915,702 |
|
| 4,279 |
|
|
|
McDonald’s Corp |
|
|
1,268,766 |
|
| 10,345 |
|
|
|
Service Corp International/US |
|
|
708,115 |
|
| 1,480 |
|
|
|
Wingstop Inc |
|
|
379,738 |
|
|
|
|
|
Total Consumer Services |
|
|
37,337,690 |
|
|
|
|
|
|
|
|
|
|
|
|
|
|
|
Consumer Staples Distribution & Retail - 2.2% |
|
|
|
|
| 25,248 |
|
(c) |
|
BJ’s Wholesale Club Holdings Inc |
|
|
1,683,032 |
|
| 2,618 |
|
|
|
Casey’s General Stores Inc |
|
|
719,269 |
|
| 210,528 |
|
(c) |
|
HF Foods Group Inc |
|
|
1,124,220 |
|
| 24,681 |
|
|
|
Kroger Co/The |
|
|
1,128,168 |
|
| 22,357 |
|
(c) |
|
Performance Food Group Co |
|
|
1,545,987 |
|
| 25,877 |
|
(c) |
|
Sprouts Farmers Market Inc |
|
|
1,244,942 |
|
| 60,824 |
|
|
|
Sysco Corp |
|
|
4,448,059 |
|
| 17,183 |
|
|
|
Target Corp |
|
|
2,447,203 |
|
| 46,686 |
|
(c) |
|
US Foods Holding Corp |
|
|
2,120,011 |
|
| 59,706 |
|
|
|
Walmart Inc |
|
|
9,412,651 |
|
|
|
|
|
Total Consumer Staples Distribution & Retail |
|
|
25,873,542 |
|
|
|
|
|
|
|
|
|
|
|
|
|
|
|
Energy - 0.3% |
|
|
|
|
| 4,902 |
|
(c) |
|
Clean Energy Fuels Corp |
|
|
18,775 |
|
| 666 |
|
|
|
ConocoPhillips |
|
|
77,303 |
|
| 5,519 |
|
|
|
Hess Corp |
|
|
795,619 |
|
| 32,582 |
|
|
|
NOV Inc |
|
|
660,763 |
|
| 3,259 |
|
|
|
Pioneer Natural Resources Co |
|
|
732,884 |
|
| 8,314 |
|
|
|
Schlumberger NV |
|
|
432,660 |
|
| 5,484 |
|
|
|
Select Water Solutions Inc |
|
|
41,624 |
|
| 21,805 |
|
|
|
TechnipFMC PLC |
|
|
439,153 |
|
| 141 |
|
|
|
Texas Pacific Land Corp |
|
|
221,715 |
|
| 698 |
|
(c) |
|
Weatherford International PLC |
|
|
68,285 |
|
|
|
|
|
Total Energy |
|
|
3,488,781 |
|
|
|
|
|
|
|
|
|
|
|
|
|
|
|
Equity Real Estate Investment Trusts (REITs) - 0.2% |
|
|
|
|
| 55,254 |
|
|
|
CubeSmart |
|
|
2,561,023 |
|
|
|
|
|
Total Equity Real Estate Investment Trusts (REITs) |
|
|
2,561,023 |
|
|
|
|
|
|
|
52
|
|
|
|
|
|
|
|
|
| Shares |
|
|
|
Description (a) |
|
Value |
|
|
|
|
|
|
|
|
Financial Services - 2.4% |
|
|
|
|
| 3,005 |
|
(c) |
|
Affirm Holdings Inc |
|
$ |
147,666 |
|
| 5,861 |
|
(c) |
|
Berkshire Hathaway Inc, Class B |
|
|
2,090,384 |
|
| 666 |
|
(c) |
|
Coinbase Global Inc, Class A |
|
|
115,831 |
|
| 11,527 |
|
|
|
Jack Henry & Associates Inc |
|
|
1,883,627 |
|
| 8,130 |
|
|
|
Mastercard Inc, Class A |
|
|
3,467,526 |
|
| 8,682 |
|
|
|
Moody’s Corp |
|
|
3,390,842 |
|
| 19,418 |
|
|
|
Morgan Stanley |
|
|
1,810,728 |
|
| 143,943 |
|
(c) |
|
PayPal Holdings Inc |
|
|
8,839,540 |
|
| 3,079 |
|
|
|
S&P Global Inc |
|
|
1,356,361 |
|
| 11,343 |
|
|
|
SEI Investments Co |
|
|
720,848 |
|
| 11,700 |
|
(c) |
|
Toast Inc, Class A |
|
|
213,642 |
|
| 17,825 |
|
|
|
Visa Inc, Class A |
|
|
4,640,739 |
|
|
|
|
|
Total Financial Services |
|
|
28,677,734 |
|
|
|
|
|
|
|
|
|
|
|
|
|
|
|
Food, Beverage & Tobacco - 3.1% |
|
|
|
|
| 1,452 |
|
|
|
Archer-Daniels-Midland Co |
|
|
104,863 |
|
| 1,462 |
|
(c) |
|
Boston Beer Co Inc/The, Class A |
|
|
505,253 |
|
| 70,834 |
|
(c) |
|
Bridgford Foods Corp |
|
|
775,632 |
|
| 35,266 |
|
|
|
Brown-Forman Corp, Class B |
|
|
2,013,689 |
|
| 7,539 |
|
(c) |
|
Bunge Global SA |
|
|
761,062 |
|
| 10,507 |
|
|
|
Cal-Maine Foods Inc |
|
|
602,997 |
|
| 37,908 |
|
(c) |
|
Celsius Holdings Inc |
|
|
2,066,744 |
|
| 97,069 |
|
|
|
Coca-Cola Co/The |
|
|
5,720,276 |
|
| 190 |
|
|
|
Coca-Cola Consolidated Inc |
|
|
176,396 |
|
| 7,494 |
|
|
|
Constellation Brands Inc, Class A |
|
|
1,811,675 |
|
| 4,567 |
|
(c) |
|
Freshpet Inc |
|
|
396,233 |
|
| 40,685 |
|
|
|
General Mills Inc |
|
|
2,650,221 |
|
| 853 |
|
|
|
Ingredion Inc |
|
|
92,576 |
|
| 22,636 |
|
(c) |
|
Laird Superfood Inc |
|
|
20,599 |
|
| 17,629 |
|
|
|
Lamb Weston Holdings Inc |
|
|
1,905,519 |
|
| 20,310 |
|
|
|
McCormick & Co Inc/MD |
|
|
1,389,610 |
|
| 242,394 |
|
(c) |
|
Monster Beverage Corp |
|
|
13,964,318 |
|
| 10,703 |
|
(c) |
|
Post Holdings Inc |
|
|
942,506 |
|
| 15,193 |
|
(c) |
|
Simply Good Foods Co/The |
|
|
601,643 |
|
| 16,131 |
|
(c) |
|
Sovos Brands Inc |
|
|
355,366 |
|
| 12,843 |
|
|
|
Tyson Foods Inc, Class A |
|
|
690,311 |
|
|
|
|
|
Total Food, Beverage & Tobacco |
|
|
37,547,489 |
|
|
|
|
|
|
|
|
|
|
|
|
|
|
|
Health Care Equipment & Services - 1.8% |
|
|
|
|
| 26,882 |
|
|
|
Abbott Laboratories |
|
|
2,958,902 |
|
| 1,197 |
|
(c) |
|
Align Technology Inc |
|
|
327,978 |
|
| 13,236 |
|
(c) |
|
Alphatec Holdings Inc |
|
|
199,996 |
|
| 11,805 |
|
(c) |
|
Axonics Inc |
|
|
734,625 |
|
| 2,837 |
|
|
|
Becton Dickinson & Co |
|
|
691,746 |
|
| 45,774 |
|
(c) |
|
Boston Scientific Corp |
|
|
2,646,195 |
|
| 9,791 |
|
|
|
Cardinal Health Inc |
|
|
986,933 |
|
| 845 |
|
|
|
CENCORA INC |
|
|
173,546 |
|
| 255 |
|
|
|
Cooper Cos Inc/The |
|
|
96,502 |
|
| 10,457 |
|
(c) |
|
Edwards Lifesciences Corp |
|
|
797,346 |
|
| 768 |
|
|
|
Embecta Corp |
|
|
14,538 |
|
| 1,777 |
|
(c) |
|
Glaukos Corp |
|
|
141,254 |
|
| 6,017 |
|
(c) |
|
Guardant Health Inc |
|
|
162,760 |
|
| 11,126 |
|
(c) |
|
Inari Medical Inc |
|
|
722,300 |
|
| 2,477 |
|
(c) |
|
Inspire Medical Systems Inc |
|
|
503,896 |
|
| 17,865 |
|
(c) |
|
LENSAR Inc |
|
|
62,706 |
|
| 4,308 |
|
|
|
McKesson Corp |
|
|
1,994,518 |
|
| 313 |
|
(c) |
|
Novocure Ltd |
|
|
4,673 |
|
| 271 |
|
(c) |
|
Penumbra Inc |
|
|
68,167 |
|
| 2,672 |
|
(c) |
|
PROCEPT BioRobotics Corp |
|
|
111,984 |
|
| 2,655 |
|
(c) |
|
RxSight Inc |
|
|
107,050 |
|
| 5,192 |
|
(c) |
|
Schrodinger Inc/United States |
|
|
185,874 |
|
53
|
|
|
| QQQX |
|
Nuveen Nasdaq 100 Dynamic Overwrite Fund (continued) |
|
|
Portfolio of Investments December 31, 2023 |
|
|
|
|
|
|
|
|
|
| Shares |
|
|
|
Description (a) |
|
Value |
|
|
|
|
|
|
|
|
Health Care Equipment & Services (continued) |
|
|
|
|
| 1,347 |
|
(c) |
|
Shockwave Medical Inc |
|
$ |
256,684 |
|
| 19,914 |
|
|
|
Stryker Corp |
|
|
5,963,446 |
|
| 20,982 |
|
(c) |
|
Teladoc Health Inc |
|
|
452,162 |
|
| 695 |
|
(c) |
|
TransMedics Group Inc |
|
|
54,856 |
|
| 929 |
|
|
|
UnitedHealth Group Inc |
|
|
489,091 |
|
| 2,900 |
|
(c) |
|
Veeva Systems Inc, Class A |
|
|
558,308 |
|
| 4,183 |
|
(c) |
|
Venus Concept Inc |
|
|
4,852 |
|
|
|
|
|
Total Health Care Equipment & Services |
|
|
21,472,888 |
|
|
|
|
|
|
|
|
|
|
|
|
|
|
|
Household & Personal Products - 0.2% |
|
|
|
|
| 1,256 |
|
|
|
Colgate-Palmolive Co |
|
|
100,116 |
|
| 4,331 |
|
(c) |
|
elf Beauty Inc |
|
|
625,137 |
|
| 1,884 |
|
|
|
Estee Lauder Cos Inc/The, Class A |
|
|
275,535 |
|
| 11,199 |
|
|
|
Procter & Gamble Co/The |
|
|
1,641,101 |
|
|
|
|
|
Total Household & Personal Products |
|
|
2,641,889 |
|
|
|
|
|
|
|
|
|
|
|
|
|
|
|
Insurance - 0.0% |
|
|
|
|
| 4,744 |
|
(b),(c) |
|
Lemonade Inc |
|
|
76,521 |
|
|
|
|
|
Total Insurance |
|
|
76,521 |
|
|
|
|
|
|
|
|
|
|
|
|
|
|
|
Materials - 0.3% |
|
|
|
|
| 4,212 |
|
|
|
Ball Corp |
|
|
242,274 |
|
| 6,845 |
|
(c) |
|
comScore Inc |
|
|
114,311 |
|
| 4,584 |
|
|
|
Linde PLC |
|
|
1,882,695 |
|
| 3,839 |
|
|
|
Sherwin-Williams Co/The |
|
|
1,197,384 |
|
|
|
|
|
Total Materials |
|
|
3,436,664 |
|
|
|
|
|
|
|
|
|
|
|
|
|
|
|
Media & Entertainment - 16.8% |
|
|
|
|
| 439,779 |
|
(c) |
|
Alphabet Inc, Class A |
|
|
61,432,729 |
|
| 338,076 |
|
(c) |
|
Alphabet Inc, Class C |
|
|
47,645,051 |
|
| 642,116 |
|
|
|
Comcast Corp, Class A |
|
|
28,156,787 |
|
| 6,551 |
|
(c) |
|
Integral Ad Science Holding Corp |
|
|
94,269 |
|
| 11,325 |
|
(c) |
|
Lions Gate Entertainment Corp, Class A |
|
|
123,442 |
|
| 10,553 |
|
(c) |
|
Live Nation Entertainment Inc |
|
|
987,761 |
|
| 37,991 |
|
(c) |
|
Match Group Inc |
|
|
1,386,672 |
|
| 160,569 |
|
(c) |
|
Meta Platforms Inc |
|
|
56,835,003 |
|
| 25,957 |
|
|
|
New York Times Co/The, Class A |
|
|
1,271,633 |
|
| 6,270 |
|
|
|
News Corp, Class B |
|
|
161,264 |
|
| 15,223 |
|
(c) |
|
ROBLOX Corp, Class A |
|
|
695,996 |
|
| 12,831 |
|
(c) |
|
Roku Inc |
|
|
1,176,089 |
|
| 42,393 |
|
|
|
Saga Communications Inc, Class A |
|
|
943,668 |
|
| 8,142 |
|
(c) |
|
TKO Group Holdings Inc |
|
|
664,224 |
|
| 11,379 |
|
|
|
Walt Disney Co/The |
|
|
1,027,410 |
|
|
|
|
|
Total Media & Entertainment |
|
|
202,601,998 |
|
|
|
|
|
|
|
|
|
|
|
|
|
|
|
Pharmaceuticals, Biotechnology & Life Sciences - 5.0% |
|
|
|
|
| 3,964 |
|
(c) |
|
89bio Inc |
|
|
44,278 |
|
| 21,953 |
|
|
|
Agilent Technologies Inc |
|
|
3,052,126 |
|
| 66,016 |
|
(d) |
|
Amgen Inc |
|
|
19,013,928 |
|
| 803 |
|
(c) |
|
Arcus Biosciences Inc |
|
|
15,337 |
|
| 1,819 |
|
(c) |
|
Arvinas Inc |
|
|
74,870 |
|
| 4,186 |
|
(c) |
|
Biohaven Ltd |
|
|
179,161 |
|
| 1,796 |
|
(c) |
|
BioMarin Pharmaceutical Inc |
|
|
173,170 |
|
| 3,399 |
|
(c) |
|
Blueprint Medicines Corp |
|
|
313,524 |
|
| 4,277 |
|
(c) |
|
Bridgebio Pharma Inc |
|
|
172,662 |
|
| 2,012 |
|
(c) |
|
Cerevel Therapeutics Holdings Inc |
|
|
85,309 |
|
| 5,019 |
|
(c) |
|
Charles River Laboratories International Inc |
|
|
1,186,492 |
|
| 2,504 |
|
(c) |
|
Cymabay Therapeutics Inc |
|
|
59,144 |
|
| 5,067 |
|
(c) |
|
Cytokinetics Inc |
|
|
423,044 |
|
| 16,193 |
|
|
|
Danaher Corp |
|
|
3,746,089 |
|
54
|
|
|
|
|
|
|
|
|
| Shares |
|
|
|
Description (a) |
|
Value |
|
|
|
|
|
|
|
|
Pharmaceuticals, Biotechnology & Life Sciences (continued) |
|
|
|
|
| 22,400 |
|
(c) |
|
Day One Biopharmaceuticals Inc |
|
$ |
327,040 |
|
| 6,554 |
|
(c) |
|
Editas Medicine Inc |
|
|
66,392 |
|
| 2,706 |
|
|
|
Eli Lilly & Co |
|
|
1,577,382 |
|
| 5,556 |
|
(c) |
|
Exelixis Inc |
|
|
133,288 |
|
| 172,825 |
|
|
|
Gilead Sciences Inc |
|
|
14,000,553 |
|
| 48,226 |
|
(b),(c) |
|
ImmunityBio Inc |
|
|
242,095 |
|
| 2,239 |
|
(c) |
|
ImmunoGen Inc |
|
|
66,386 |
|
| 13,603 |
|
(c) |
|
Insmed Inc |
|
|
421,557 |
|
| 3,844 |
|
(c) |
|
Ionis Pharmaceuticals Inc |
|
|
194,468 |
|
| 7,172 |
|
(c) |
|
Iovance Biotherapeutics Inc |
|
|
58,308 |
|
| 22,160 |
|
(c) |
|
Kura Oncology Inc |
|
|
318,661 |
|
| 1,618 |
|
(c) |
|
Madrigal Pharmaceuticals Inc |
|
|
374,373 |
|
| 5,783 |
|
(c) |
|
Mirati Therapeutics Inc |
|
|
339,751 |
|
| 7,810 |
|
(c) |
|
Neurocrine Biosciences Inc |
|
|
1,029,046 |
|
| 13,272 |
|
(c) |
|
Regeneron Pharmaceuticals Inc |
|
|
11,656,665 |
|
| 4,581 |
|
(c) |
|
Revance Therapeutics Inc |
|
|
40,267 |
|
| 4,032 |
|
(c) |
|
REVOLUTION Medicines Inc |
|
|
115,638 |
|
| 14,185 |
|
(c) |
|
Roivant Sciences Ltd |
|
|
159,298 |
|
| 3,102 |
|
(c) |
|
SpringWorks Therapeutics Inc |
|
|
113,223 |
|
| 7,934 |
|
(c) |
|
Twist Bioscience Corp |
|
|
292,447 |
|
| 8,154 |
|
(c) |
|
Ultragenyx Pharmaceutical Inc |
|
|
389,924 |
|
| 193 |
|
|
|
West Pharmaceutical Services Inc |
|
|
67,959 |
|
|
|
|
|
Total Pharmaceuticals, Biotechnology & Life Sciences |
|
|
60,523,855 |
|
|
|
|
|
|
|
|
|
|
|
|
|
|
|
Semiconductors & Semiconductor Equipment - 19.5% |
|
|
|
|
| 166,423 |
|
(c) |
|
Advanced Micro Devices Inc |
|
|
24,532,414 |
|
| 94,350 |
|
|
|
Analog Devices Inc |
|
|
18,734,136 |
|
| 165,056 |
|
|
|
Applied Materials Inc |
|
|
26,750,626 |
|
| 9,301 |
|
(c) |
|
Axcelis Technologies Inc |
|
|
1,206,247 |
|
| 37,356 |
|
|
|
Broadcom Inc |
|
|
41,698,635 |
|
| 15,643 |
|
(c) |
|
Cirrus Logic Inc |
|
|
1,301,341 |
|
| 5,054 |
|
(c) |
|
Credo Technology Group Holding Ltd |
|
|
98,401 |
|
| 2,309 |
|
(c) |
|
Enphase Energy Inc |
|
|
305,111 |
|
| 10,198 |
|
|
|
Entegris Inc |
|
|
1,221,924 |
|
| 6,555 |
|
(c) |
|
First Solar Inc |
|
|
1,129,295 |
|
| 2,690 |
|
(c) |
|
FormFactor Inc |
|
|
112,200 |
|
| 420,372 |
|
|
|
Intel Corp |
|
|
21,123,693 |
|
| 37,130 |
|
(c) |
|
Lattice Semiconductor Corp |
|
|
2,561,599 |
|
| 13,569 |
|
(c) |
|
MACOM Technology Solutions Holdings Inc |
|
|
1,261,239 |
|
| 2,974 |
|
(b),(c) |
|
Maxeon Solar Technologies Ltd |
|
|
21,324 |
|
| 6,123 |
|
|
|
Monolithic Power Systems Inc |
|
|
3,862,266 |
|
| 9,503 |
|
(c) |
|
Navitas Semiconductor Corp |
|
|
76,689 |
|
| 111,204 |
|
|
|
NVIDIA Corp |
|
|
55,070,445 |
|
| 7,607 |
|
(c) |
|
Onto Innovation Inc |
|
|
1,163,110 |
|
| 12,494 |
|
|
|
Power Integrations Inc |
|
|
1,025,882 |
|
| 12,202 |
|
(c) |
|
Qorvo Inc |
|
|
1,374,067 |
|
| 140,959 |
|
|
|
QUALCOMM Inc |
|
|
20,386,900 |
|
| 11,536 |
|
(c) |
|
Rambus Inc |
|
|
787,332 |
|
| 9,889 |
|
(c) |
|
Silicon Laboratories Inc |
|
|
1,308,018 |
|
| 1,869 |
|
(c) |
|
SiTime Corp |
|
|
228,168 |
|
| 20,407 |
|
|
|
Skyworks Solutions Inc |
|
|
2,294,155 |
|
| 16,275 |
|
(c) |
|
SYNAPTICS INC |
|
|
1,856,652 |
|
| 9,086 |
|
|
|
Taiwan Semiconductor Manufacturing Co Ltd, Sponsored ADR |
|
|
944,944 |
|
| 3,690 |
|
|
|
Teradyne Inc |
|
|
400,439 |
|
| 9,995 |
|
|
|
Universal Display Corp |
|
|
1,911,644 |
|
|
|
|
|
Total Semiconductors & Semiconductor Equipment |
|
|
234,748,896 |
|
|
|
|
|
|
|
55
|
|
|
| QQQX |
|
Nuveen Nasdaq 100 Dynamic Overwrite Fund (continued) |
|
|
Portfolio of Investments December 31, 2023 |
|
|
|
|
|
|
|
|
|
| Shares |
|
|
|
Description (a) |
|
Value |
|
|
|
|
|
|
|
|
Software & Services - 15.9% |
|
|
|
|
| 1,868 |
|
(c) |
|
Appfolio Inc, Class A |
|
$ |
323,612 |
|
| 6,319 |
|
(c) |
|
AppLovin Corp, Class A |
|
|
251,812 |
|
| 16,176 |
|
(c) |
|
Asana Inc |
|
|
307,506 |
|
| 52,492 |
|
(c) |
|
Autodesk Inc |
|
|
12,780,752 |
|
| 4,846 |
|
|
|
Bentley Systems Inc, Class B |
|
|
252,864 |
|
| 6,843 |
|
(c) |
|
Braze Inc, Class A |
|
|
363,569 |
|
| 11,942 |
|
(b),(c) |
|
C3.ai Inc, Class A |
|
|
342,855 |
|
| 9,383 |
|
(c) |
|
Ceridian HCM Holding Inc |
|
|
629,787 |
|
| 5,650 |
|
(c) |
|
Cleanspark Inc |
|
|
62,319 |
|
| 20,252 |
|
(c) |
|
Confluent Inc, Class A |
|
|
473,897 |
|
| 5,238 |
|
(c) |
|
DocuSign Inc |
|
|
311,399 |
|
| 15,187 |
|
(c) |
|
DoubleVerify Holdings Inc |
|
|
558,578 |
|
| 16,008 |
|
(c) |
|
Dropbox Inc, Class A |
|
|
471,916 |
|
| 20,808 |
|
(c) |
|
Dynatrace Inc |
|
|
1,137,989 |
|
| 2,978 |
|
(c) |
|
Elastic NV |
|
|
335,621 |
|
| 9,639 |
|
(c) |
|
EngageSmart Inc |
|
|
220,733 |
|
| 1,335 |
|
(c) |
|
Fair Isaac Corp |
|
|
1,553,953 |
|
| 3,646 |
|
(c) |
|
Five9 Inc |
|
|
286,904 |
|
| 14,290 |
|
(c) |
|
Freshworks Inc, Class A |
|
|
335,672 |
|
| 5,922 |
|
(c) |
|
Gitlab Inc, Class A |
|
|
372,849 |
|
| 8,062 |
|
(c) |
|
Guidewire Software Inc |
|
|
879,080 |
|
| 7,482 |
|
(c) |
|
HashiCorp Inc, Class A |
|
|
176,874 |
|
| 2,688 |
|
(c) |
|
HubSpot Inc |
|
|
1,560,492 |
|
| 3,345 |
|
(c) |
|
Intapp Inc |
|
|
127,177 |
|
| 9,067 |
|
(c) |
|
Manhattan Associates Inc |
|
|
1,952,306 |
|
| 5,006 |
|
(c) |
|
Marathon Digital Holdings Inc |
|
|
117,591 |
|
| 365,081 |
|
|
|
Microsoft Corp |
|
|
137,285,059 |
|
| 393 |
|
(c) |
|
MicroStrategy Inc, Class A |
|
|
248,227 |
|
| 11,808 |
|
(c) |
|
Nutanix Inc, Class A |
|
|
563,124 |
|
| 40,479 |
|
|
|
Oracle Corp |
|
|
4,267,701 |
|
| 80,164 |
|
(c) |
|
Palantir Technologies Inc, Class A |
|
|
1,376,416 |
|
| 1,053 |
|
(c) |
|
Paylocity Holding Corp |
|
|
173,587 |
|
| 7,008 |
|
(c) |
|
Procore Technologies Inc |
|
|
485,094 |
|
| 24,964 |
|
(c) |
|
PTC Inc |
|
|
4,367,701 |
|
| 4,804 |
|
(c) |
|
Qualys Inc |
|
|
942,929 |
|
| 3,549 |
|
(c) |
|
Riot Platforms Inc |
|
|
54,903 |
|
| 22,714 |
|
(c) |
|
Salesforce Inc |
|
|
5,976,962 |
|
| 21,736 |
|
(c) |
|
SentinelOne Inc, Class A |
|
|
596,436 |
|
| 6,953 |
|
(c) |
|
ServiceNow Inc |
|
|
4,912,225 |
|
| 5,606 |
|
(c) |
|
Smartsheet Inc, Class A |
|
|
268,079 |
|
| 16,980 |
|
(c) |
|
Sprinklr Inc, Class A |
|
|
204,439 |
|
| 7,614 |
|
(c) |
|
Sprout Social Inc, Class A |
|
|
467,804 |
|
| 6,834 |
|
(c) |
|
Tenable Holdings Inc |
|
|
314,774 |
|
| 2,332 |
|
(c) |
|
Tyler Technologies Inc |
|
|
975,056 |
|
| 36,872 |
|
(c) |
|
UiPath Inc, Class A |
|
|
915,900 |
|
| 9,566 |
|
(c) |
|
Unity Software Inc |
|
|
391,154 |
|
| 10,300 |
|
(c) |
|
Varonis Systems Inc |
|
|
466,384 |
|
| 1,869 |
|
(c) |
|
Workiva Inc |
|
|
189,760 |
|
| 4,315 |
|
(c) |
|
Zoom Video Communications Inc, Class A |
|
|
310,292 |
|
|
|
|
|
Total Software & Services |
|
|
191,942,113 |
|
|
|
|
|
|
|
|
|
|
|
|
|
|
|
Technology Hardware & Equipment - 14.1% |
|
|
|
|
| 742,091 |
|
(d) |
|
Apple Inc |
|
|
142,874,779 |
|
| 497,907 |
|
|
|
Cisco Systems Inc |
|
|
25,154,262 |
|
| 8,099 |
|
(c) |
|
Keysight Technologies Inc |
|
|
1,288,470 |
|
|
|
|
|
Total Technology Hardware & Equipment |
|
|
169,317,511 |
|
|
|
|
|
|
|
|
|
|
|
|
|
|
|
Telecommunication Services - 0.4% |
|
|
|
|
| 51,989 |
|
(b),(c) |
|
AST SpaceMobile Inc |
|
|
313,494 |
|
| 32,495 |
|
|
|
Spok Holdings Inc |
|
|
503,023 |
|
| 31,079 |
|
|
|
Telephone and Data Systems Inc |
|
|
570,300 |
|
56
|
|
|
|
|
|
|
|
|
|
|
|
|
|
|
|
|
|
|
|
|
|
|
|
|
| Shares |
|
|
|
Description (a) |
|
Value |
|
|
|
|
|
|
|
|
Telecommunication Services (continued) |
|
|
|
|
|
| 100,308 |
|
|
|
Verizon Communications Inc |
|
|
$ |
3,781,611 |
|
|
|
|
|
Total Telecommunication Services |
|
|
|
5,168,428 |
|
|
|
|
|
|
|
|
|
|
|
|
|
|
|
Transportation - 0.7% |
|
|
|
|
|
| 11,239 |
|
|
|
Delta Air Lines Inc |
|
|
|
452,145 |
|
| 228 |
|
|
|
FedEx Corp |
|
|
|
57,677 |
|
| 4,575 |
|
|
|
JB Hunt Transport Services Inc |
|
|
|
913,811 |
|
| 26,971 |
|
(c) |
|
Lyft Inc, Class A |
|
|
|
404,295 |
|
| 2,687 |
|
|
|
Norfolk Southern Corp |
|
|
|
635,153 |
|
| 1,881 |
|
(c) |
|
Saia Inc |
|
|
|
824,292 |
|
| 33,792 |
|
(c) |
|
Uber Technologies Inc |
|
|
|
2,080,574 |
|
| 10,994 |
|
|
|
Union Pacific Corp |
|
|
|
2,700,346 |
|
| 4,685 |
|
(c) |
|
XPO Inc |
|
|
|
410,359 |
|
|
|
|
|
Total Transportation |
|
|
|
8,478,652 |
|
|
|
|
|
|
|
|
|
|
|
|
|
|
|
Utilities - 1.2% |
|
|
|
|
|
| 8,663 |
|
|
|
American Water Works Co Inc |
|
|
|
1,143,429 |
|
| 15,430 |
|
|
|
Atmos Energy Corp |
|
|
|
1,788,337 |
|
| 13,565 |
|
|
|
CMS Energy Corp |
|
|
|
787,719 |
|
| 10,727 |
|
|
|
Consolidated Edison Inc |
|
|
|
975,835 |
|
| 13,604 |
|
|
|
Duke Energy Corp |
|
|
|
1,320,132 |
|
| 19,654 |
|
|
|
FirstEnergy Corp |
|
|
|
720,516 |
|
| 17,908 |
|
|
|
NRG Energy Inc |
|
|
|
925,844 |
|
| 69,334 |
|
|
|
PG&E Corp |
|
|
|
1,250,092 |
|
| 3,827 |
|
|
|
Public Service Enterprise Group Inc |
|
|
|
234,021 |
|
| 22,816 |
|
|
|
Sempra |
|
|
|
1,705,040 |
|
| 52,824 |
|
|
|
Southern Co/The |
|
|
|
3,704,019 |
|
| 13,645 |
|
(c) |
|
Sunnova Energy International Inc |
|
|
|
208,086 |
|
|
|
|
|
Total Utilities |
|
|
|
14,763,070 |
|
|
|
|
|
|
|
|
|
|
|
Total Common Stocks
(cost $407,610,692) |
|
|
|
1,205,116,253 |
|
|
|
|
|
|
|
|
|
|
|
| Shares |
|
|
|
Description (a) |
|
Value |
|
|
|
|
EXCHANGE-TRADED FUNDS - 1.2% |
|
|
|
|
|
|
|
|
|
| 58,000 |
|
|
|
Vanguard Total Stock Market ETF |
|
|
$ |
13,758,760 |
|
|
|
|
|
Total Exchange-Traded Funds
(cost $13,379,869) |
|
|
|
13,758,760 |
|
|
|
|
|
|
|
|
|
|
|
|
|
|
|
| Type |
|
|
|
Description (e) |
|
Number of
Contracts |
|
|
Notional
Amount (f) |
|
|
Exercise
Price |
|
|
Expiration
Date |
|
|
Value |
|
|
|
|
OPTIONS PURCHASED - 0.0% |
|
|
|
|
|
|
|
|
|
|
|
|
|
| Put |
|
|
|
S&P 500 Index |
|
|
70 |
|
|
$ |
29,400,000 |
|
|
$ |
4200 |
|
|
|
1/19/24 |
|
|
$ |
8,925 |
|
|
|
|
|
Total Options Purchased
(cost $27,466) |
|
|
70 |
|
|
$ |
29,400,000 |
|
|
|
|
|
|
|
|
|
|
|
8,925 |
|
|
|
|
|
|
|
|
|
|
|
Total Long-Term Investments
(cost $421,018,027) |
|
|
|
|
|
|
|
|
|
|
|
|
|
|
|
|
|
|
1,218,883,938 |
|
|
|
|
|
|
|
|
|
|
|
|
|
|
|
| Shares |
|
|
|
Description (a) |
|
|
|
|
|
|
|
Coupon |
|
|
|
|
|
Value |
|
|
|
|
INVESTMENTS PURCHASED WITH COLLATERAL FROM SECURITIES LENDING - 0.1% |
|
|
|
|
|
|
|
|
|
|
|
| 1,542,799 |
|
(g) |
|
State Street Navigator Securities Lending
Government Money Market Portfolio |
|
|
|
5.360%(h) |
|
|
|
|
|
|
$ |
1,542,799 |
|
|
|
|
|
Total Investments Purchased with Collateral from Securities Lending
(cost $1,542,799) |
|
|
|
|
|
|
|
1,542,799 |
|
|
|
|
|
|
|
57
|
|
|
| QQQX |
|
Nuveen Nasdaq 100 Dynamic Overwrite Fund (continued) |
|
|
Portfolio of Investments December 31, 2023 |
|
|
|
|
|
|
|
|
|
|
|
|
|
|
|
|
|
|
|
|
|
|
|
|
|
| Principal
Amount (000) |
|
|
|
|
Description (a) |
|
|
|
|
|
|
|
Coupon |
|
|
Maturity |
|
Value |
|
|
|
|
|
|
SHORT-TERM INVESTMENTS - 0.1% |
|
|
|
|
|
|
|
|
|
|
|
|
|
|
|
|
|
|
|
|
|
|
|
|
REPURCHASE AGREEMENTS - 0.1% |
|
|
|
|
|
|
|
|
|
|
|
|
|
|
|
| $ |
1,610 |
|
|
(i) |
|
Fixed Income Clearing Corp (FICC) |
|
|
|
|
|
|
|
|
|
|
1.600% |
|
|
1/02/24 |
|
$ |
1,609,514 |
|
|
|
|
|
|
|
Total Repurchase Agreements
(cost $1,609,514) |
|
|
|
|
|
|
|
|
|
|
|
|
|
|
|
|
1,609,514 |
|
|
|
|
|
|
|
|
|
|
|
|
|
|
|
Total Short-Term Investments
(cost $1,609,514) |
|
|
|
|
|
|
|
|
|
|
|
|
|
|
|
|
1,609,514 |
|
|
|
|
|
|
|
|
|
|
|
|
|
|
|
|
|
|
|
|
|
|
|
Total Investments (cost $424,170,340) - 101.4% |
|
|
|
|
|
|
|
|
|
|
|
|
|
|
|
|
1,222,036,251 |
|
|
|
|
|
|
|
|
|
|
|
|
|
|
|
Other Assets & Liabilities, Net - (1.4)% |
|
|
|
|
|
|
|
|
|
|
|
|
|
|
|
|
(17,211,201 |
) |
|
|
|
|
|
|
|
|
|
|
|
|
|
|
Net Assets Applicable to Common Shares - 100% |
|
|
|
|
|
|
|
|
|
|
|
|
|
|
|
$ |
1,204,825,050 |
|
|
|
|
|
|
|
|
|
Investments in Derivatives
Options Written
|
|
|
|
|
|
|
|
|
|
|
|
|
|
|
|
|
|
|
|
|
|
|
| Type |
|
Description(e) |
|
Number of
Contracts |
|
|
Notional
Amount (f) |
|
|
Exercise
Price |
|
|
Expiration Date |
|
|
Value |
|
| Call |
|
Invesco QQQ Trust Series 1 |
|
|
(1,000) |
|
|
|
$(38,978,000) |
|
|
|
$390 |
|
|
|
1/05/24 |
|
|
|
$(2,005,000) |
|
| Call |
|
Invesco QQQ Trust Series 1 |
|
|
(2,000) |
|
|
|
(78,356,000) |
|
|
|
392 |
|
|
|
1/12/24 |
|
|
|
(3,790,000) |
|
| Call |
|
Invesco QQQ Trust Series 1 |
|
|
(2,500) |
|
|
|
(99,945,000) |
|
|
|
400 |
|
|
|
1/19/24 |
|
|
|
(3,187,500) |
|
| Call |
|
Invesco QQQ Trust Series 1 |
|
|
(1,500) |
|
|
|
(61,767,000) |
|
|
|
412 |
|
|
|
1/19/24 |
|
|
|
(701,250) |
|
| Call |
|
Russell 2000 Index |
|
|
(100) |
|
|
|
(20,500,000) |
|
|
|
2,050 |
|
|
|
1/19/24 |
|
|
|
(275,500) |
|
| Call |
|
S&P 500 Index |
|
|
(140) |
|
|
|
(65,800,000) |
|
|
|
4,700 |
|
|
|
1/19/24 |
|
|
|
(1,420,300) |
|
| Call |
|
S&P 500 Index |
|
|
(70) |
|
|
|
(33,600,000) |
|
|
|
4,800 |
|
|
|
1/19/24 |
|
|
|
(252,700) |
|
| Call |
|
NASDAQ 100 Stock INDEX |
|
|
(35) |
|
|
|
(58,275,000) |
|
|
|
16,650 |
|
|
|
1/19/24 |
|
|
|
(1,229,375) |
|
| Call |
|
NASDAQ 100 Stock INDEX |
|
|
(40) |
|
|
|
(67,200,000) |
|
|
|
16,800 |
|
|
|
1/19/24 |
|
|
|
(1,010,000) |
|
| Call |
|
S&P 500 Index |
|
|
(140) |
|
|
|
(67,200,000) |
|
|
|
4,800 |
|
|
|
1/31/24 |
|
|
|
(769,300) |
|
| Total Options Written (premiums received
$9,030,492) |
|
|
(7,525) |
|
|
$ |
(591,621,000) |
|
|
|
|
|
|
|
|
|
|
$ |
(14,640,925) |
|
For Fund portfolio compliance purposes, the Fund’s industry classifications refer to any one or more of the industry
sub-classifications used by one or more widely recognized market indexes or ratings group indexes, and/or as defined by Fund management. This definition may not apply for purposes of this report, which may
combine industry sub-classifications into sectors for reporting ease.
| (a) |
All percentages shown in the Portfolio of Investments are based on net assets applicable to common shares unless otherwise
noted. |
| (b) |
Investment, or a portion of investment, is out on loan for securities lending. The total value of the securities out on
loan as of the end of the reporting period was $1,418,741. |
| (c) |
Non-income producing; issuer has not declared an
ex-dividend date within the past twelve months. |
| (d) |
Investment, or portion of investment, has been pledged to collateralize the net payment obligations for investments in
derivatives. |
| (e) |
Exchange-traded, unless otherwise noted. |
| (f) |
For disclosure purposes, Notional Amount is calculated by multiplying the Number of Contracts by the Exercise Price by
100. |
| (g) |
The Fund may loan securities representing up to one third of the value of its total assets (which includes collateral for
securities on loan) to broker dealers, banks, and other institutions. The collateral maintained by the Fund shall have a value, at the inception of each loan, equal to not less than 100% of the value of the loaned securities. The cash collateral
received by the Fund is invested in this money market fund. |
| (h) |
The rate shown is the one-day yield as of the end of the reporting period.
|
| (i) |
Agreement with Fixed Income Clearing Corporation, 1.600% dated 12/29/23 to be repurchased at $1,609,800 on 1/2/24,
collateralized by Government Agency Securities, with coupon rate 2.875% and maturity date 5/15/32, valued at $1,641,759. |
| ADR |
American Depositary Receipt |
| REIT |
Real Estate Investment Trust |
See Notes to Financial Statements
58
|
|
|
| JCE |
|
Nuveen Core Equity Alpha Fund
Portfolio of Investments December 31, 2023 |
|
|
|
|
|
|
|
|
|
|
| Shares |
|
|
|
Description (a) |
|
Value |
|
|
|
|
LONG-TERM INVESTMENTS - 100.1% |
|
|
|
|
|
|
|
|
COMMON STOCKS - 99.6% |
|
|
|
|
|
|
|
|
|
|
|
|
Automobiles & Components - 1.1% |
|
|
|
|
| 9,310 |
|
(b) |
|
Tesla Inc |
|
$ |
2,313,349 |
|
|
|
|
|
Total Automobiles & Components |
|
|
2,313,349 |
|
|
|
|
|
|
|
|
|
|
|
|
|
|
|
Banks - 1.9% |
|
|
|
|
| 4,005 |
|
|
|
Bank of America Corp |
|
|
134,849 |
|
| 31,400 |
|
|
|
Citigroup Inc |
|
|
1,615,216 |
|
| 9,070 |
|
|
|
JPMorgan Chase & Co |
|
|
1,542,807 |
|
| 82,410 |
|
(b) |
|
NU Holdings Ltd/Cayman Islands, Class A |
|
|
686,475 |
|
|
|
|
|
Total Banks |
|
|
3,979,347 |
|
|
|
|
|
|
|
|
|
|
|
|
|
|
|
Capital Goods - 10.2% |
|
|
|
|
| 750 |
|
|
|
3M Co |
|
|
81,990 |
|
| 9,260 |
|
|
|
AGCO Corp |
|
|
1,124,257 |
|
| 20,290 |
|
|
|
Crane NXT Co |
|
|
1,153,892 |
|
| 12,950 |
|
|
|
Esab Corp |
|
|
1,121,729 |
|
| 29,770 |
|
|
|
Flowserve Corp |
|
|
1,227,119 |
|
| 6,200 |
|
|
|
General Dynamics Corp |
|
|
1,609,954 |
|
| 15,280 |
|
|
|
General Electric Co |
|
|
1,950,186 |
|
| 9,220 |
|
|
|
Honeywell International Inc |
|
|
1,933,526 |
|
| 1,320 |
|
|
|
Hubbell Inc |
|
|
434,188 |
|
| 4,650 |
|
|
|
Huntington Ingalls Industries Inc |
|
|
1,207,326 |
|
| 23,750 |
|
|
|
Johnson Controls International plc |
|
|
1,368,950 |
|
| 2,610 |
|
|
|
Lennox International Inc |
|
|
1,168,027 |
|
| 3,740 |
|
|
|
Lockheed Martin Corp |
|
|
1,695,118 |
|
| 54,910 |
|
|
|
MDU Resources Group Inc |
|
|
1,087,218 |
|
| 3,040 |
|
|
|
Northrop Grumman Corp |
|
|
1,423,146 |
|
| 13,650 |
|
|
|
Oshkosh Corp |
|
|
1,479,797 |
|
| 34,940 |
|
|
|
Vertiv Holdings Co, Class A |
|
|
1,678,168 |
|
|
|
|
|
Total Capital Goods |
|
|
21,744,591 |
|
|
|
|
|
|
|
|
|
|
|
|
|
|
|
Commercial & Professional Services - 2.2% |
|
|
|
|
| 14,640 |
|
(b) |
|
EAS Segment |
|
|
1,204,286 |
|
| 10,580 |
|
|
|
Leidos Holdings Inc |
|
|
1,145,179 |
|
| 6,380 |
|
|
|
MSA Safety Inc |
|
|
1,077,136 |
|
| 30,460 |
|
|
|
Rollins Inc |
|
|
1,330,188 |
|
|
|
|
|
Total Commercial & Professional Services |
|
|
4,756,789 |
|
|
|
|
|
|
|
|
|
|
|
|
|
|
|
Consumer Discretionary Distribution & Retail - 7.2% |
|
|
|
|
| 58,260 |
|
(b),(c) |
|
Amazon.com Inc |
|
|
8,852,024 |
|
| 68,720 |
|
(b) |
|
Coupang Inc |
|
|
1,112,577 |
|
| 10,190 |
|
|
|
Home Depot Inc/The |
|
|
3,531,345 |
|
| 20,110 |
|
|
|
TJX Cos Inc/The |
|
|
1,886,519 |
|
|
|
|
|
Total Consumer Discretionary Distribution & Retail |
|
|
15,382,465 |
|
|
|
|
|
|
|
|
|
|
|
|
|
|
|
Consumer Durables & Apparel - 1.5% |
|
|
|
|
| 370 |
|
|
|
DR Horton Inc |
|
|
56,233 |
|
| 16,250 |
|
|
|
NIKE Inc, Class B |
|
|
1,764,262 |
|
| 36,810 |
|
|
|
Tapestry Inc |
|
|
1,354,976 |
|
|
|
|
|
Total Consumer Durables & Apparel |
|
|
3,175,471 |
|
|
|
|
|
|
|
59
|
|
|
| JCE |
|
Nuveen Core Equity Alpha Fund (continued) |
|
|
Portfolio of Investments December 31, 2023 |
|
|
|
|
|
|
|
|
|
| Shares |
|
|
|
Description (a) |
|
Value |
|
|
|
|
|
|
|
|
Consumer Services - 1.7% |
|
|
|
|
| 550 |
|
(b) |
|
Booking Holdings Inc |
|
$ |
1,950,971 |
|
| 220 |
|
|
|
McDonald’s Corp |
|
|
65,232 |
|
| 17,280 |
|
|
|
Starbucks Corp |
|
|
1,659,053 |
|
|
|
|
|
Total Consumer Services |
|
|
3,675,256 |
|
|
|
|
|
|
|
|
|
|
|
|
|
|
|
Consumer Staples Distribution & Retail - 2.2% |
|
|
|
|
| 540 |
|
|
|
Costco Wholesale Corp |
|
|
356,443 |
|
| 18,680 |
|
|
|
Sysco Corp |
|
|
1,366,069 |
|
| 11,960 |
|
|
|
Target Corp |
|
|
1,703,343 |
|
| 8,459 |
|
|
|
Walmart Inc |
|
|
1,333,561 |
|
|
|
|
|
Total Consumer Staples Distribution & Retail |
|
|
4,759,416 |
|
|
|
|
|
|
|
|
|
|
|
|
|
|
|
Diversified Financials - 0.2% |
|
|
|
|
| 13,450 |
|
(b) |
|
NCR Corp ATM |
|
|
326,700 |
|
|
|
|
|
Total Diversified Financials |
|
|
326,700 |
|
|
|
|
|
|
|
|
|
|
|
|
|
|
|
Energy - 3.9% |
|
|
|
|
| 42,020 |
|
|
|
Baker Hughes Co |
|
|
1,436,244 |
|
| 2,329 |
|
|
|
Chevron Corp |
|
|
347,394 |
|
| 2,660 |
|
|
|
EOG Resources Inc |
|
|
321,727 |
|
| 31,750 |
|
|
|
Exxon Mobil Corp |
|
|
3,174,365 |
|
| 25,080 |
|
|
|
HF Sinclair Corp |
|
|
1,393,695 |
|
| 11,980 |
|
|
|
Valero Energy Corp |
|
|
1,557,400 |
|
|
|
|
|
Total Energy |
|
|
8,230,825 |
|
|
|
|
|
|
|
|
|
|
|
|
|
|
|
Equity Real Estate Investment Trusts (REITs) - 1.2% |
|
|
|
|
| 3,490 |
|
|
|
Cousins Properties Inc |
|
|
84,982 |
|
| 8,130 |
|
|
|
Digital Realty Trust Inc |
|
|
1,094,135 |
|
| 2,330 |
|
|
|
Host Hotels & Resorts Inc |
|
|
45,365 |
|
| 26,470 |
|
|
|
Ventas Inc |
|
|
1,319,265 |
|
|
|
|
|
Total Equity Real Estate Investment Trusts (REITs) |
|
|
2,543,747 |
|
|
|
|
|
|
|
|
|
|
|
|
|
|
|
Financial Services - 7.3% |
|
|
|
|
| 8,790 |
|
|
|
American Express Co |
|
|
1,646,719 |
|
| 14,420 |
|
(b) |
|
Berkshire Hathaway Inc, Class B |
|
|
5,143,037 |
|
| 22,070 |
|
(b) |
|
Block Inc |
|
|
1,707,114 |
|
| 23,430 |
|
|
|
Fidelity National Information Services Inc |
|
|
1,407,440 |
|
| 7,390 |
|
(b) |
|
Fiserv Inc |
|
|
981,688 |
|
| 12,310 |
|
|
|
Global Payments Inc |
|
|
1,563,370 |
|
| 1,901 |
|
|
|
Mastercard Inc, Class A |
|
|
810,796 |
|
| 22,380 |
|
|
|
Nasdaq Inc |
|
|
1,301,173 |
|
| 4,400 |
|
|
|
Visa Inc, Class A |
|
|
1,145,540 |
|
|
|
|
|
Total Financial Services |
|
|
15,706,877 |
|
|
|
|
|
|
|
|
|
|
|
|
|
|
|
Food, Beverage & Tobacco - 3.2% |
|
|
|
|
| 10,510 |
|
(b) |
|
Bunge Global SA |
|
|
1,060,985 |
|
| 20,870 |
|
|
|
Coca-Cola Co/The |
|
|
1,229,869 |
|
| 15,710 |
|
|
|
PepsiCo Inc |
|
|
2,668,186 |
|
| 20,100 |
|
|
|
Philip Morris International Inc |
|
|
1,891,008 |
|
|
|
|
|
Total Food, Beverage & Tobacco |
|
|
6,850,048 |
|
|
|
|
|
|
|
|
|
|
|
|
|
|
|
Health Care Equipment & Services - 5.6% |
|
|
|
|
| 26,290 |
|
(b) |
|
Boston Scientific Corp |
|
|
1,519,825 |
|
| 11,880 |
|
|
|
Cardinal Health Inc |
|
|
1,197,504 |
|
| 19,390 |
|
(b) |
|
Centene Corp |
|
|
1,438,932 |
|
| 3,780 |
|
(c) |
|
Elevance Health Inc |
|
|
1,782,497 |
|
| 16,030 |
|
(b) |
|
Hologic Inc |
|
|
1,145,344 |
|
| 2,970 |
|
|
|
Humana Inc |
|
|
1,359,696 |
|
| 1,780 |
|
(b) |
|
Insulet Corp |
|
|
386,224 |
|
60
|
|
|
|
|
|
|
|
|
| Shares |
|
|
|
Description (a) |
|
Value |
|
|
|
|
|
|
|
|
Health Care Equipment & Services (continued) |
|
|
|
|
| 12,580 |
|
|
|
Medtronic PLC |
|
$ |
1,036,340 |
|
| 30,370 |
|
(b) |
|
Teladoc Health Inc |
|
|
654,473 |
|
| 2,880 |
|
|
|
UnitedHealth Group Inc |
|
|
1,516,234 |
|
|
|
|
|
Total Health Care Equipment & Services |
|
|
12,037,069 |
|
|
|
|
|
|
|
|
|
|
|
|
|
|
|
Household & Personal Products - 1.9% |
|
|
|
|
| 14,550 |
|
|
|
Colgate-Palmolive Co |
|
|
1,159,780 |
|
| 19,690 |
|
|
|
Procter & Gamble Co/The |
|
|
2,885,373 |
|
|
|
|
|
Total Household & Personal Products |
|
|
4,045,153 |
|
|
|
|
|
|
|
|
|
|
|
|
|
|
|
Insurance - 1.8% |
|
|
|
|
| 11,150 |
|
|
|
Cincinnati Financial Corp |
|
|
1,153,579 |
|
| 13,240 |
|
|
|
Loews Corp |
|
|
921,371 |
|
| 8,870 |
|
|
|
Marsh & McLennan Cos Inc |
|
|
1,680,599 |
|
|
|
|
|
Total Insurance |
|
|
3,755,549 |
|
|
|
|
|
|
|
|
|
|
|
|
|
|
|
Materials - 1.8% |
|
|
|
|
| 5,030 |
|
|
|
Air Products and Chemicals Inc |
|
|
1,377,214 |
|
| 31,180 |
|
(b) |
|
Axalta Coating Systems Ltd |
|
|
1,059,185 |
|
| 9,300 |
|
|
|
PPG Industries Inc |
|
|
1,390,815 |
|
|
|
|
|
Total Materials |
|
|
3,827,214 |
|
|
|
|
|
|
|
|
|
|
|
|
|
|
|
Media & Entertainment - 7.5% |
|
|
|
|
| 33,820 |
|
(b),(c) |
|
Alphabet Inc, Class A |
|
|
4,724,316 |
|
| 36,710 |
|
(b),(c) |
|
Alphabet Inc, Class C |
|
|
5,173,540 |
|
| 47,670 |
|
|
|
Comcast Corp, Class A |
|
|
2,090,330 |
|
| 9,090 |
|
(b) |
|
Meta Platforms Inc |
|
|
3,217,496 |
|
| 10,240 |
|
|
|
Walt Disney Co/The |
|
|
924,570 |
|
|
|
|
|
Total Media & Entertainment |
|
|
16,130,252 |
|
|
|
|
|
|
|
|
|
|
|
|
|
|
|
Pharmaceuticals, Biotechnology & Life Sciences - 7.9% |
|
|
|
|
| 17,060 |
|
|
|
AbbVie Inc |
|
|
2,643,788 |
|
| 32,300 |
|
|
|
Bristol-Myers Squibb Co |
|
|
1,657,313 |
|
| 2,070 |
|
|
|
Eli Lilly & Co |
|
|
1,206,644 |
|
| 21,459 |
|
|
|
Johnson & Johnson |
|
|
3,363,484 |
|
| 23,991 |
|
|
|
Merck & Co Inc |
|
|
2,615,499 |
|
| 130 |
|
(b) |
|
Mettler-Toledo International Inc |
|
|
157,685 |
|
| 4,690 |
|
(b) |
|
Neurocrine Biosciences Inc |
|
|
617,954 |
|
| 60,290 |
|
|
|
Pfizer Inc |
|
|
1,735,749 |
|
| 35,000 |
|
|
|
Royalty Pharma PLC |
|
|
983,150 |
|
| 1,443 |
|
|
|
Thermo Fisher Scientific Inc |
|
|
765,930 |
|
| 3,500 |
|
|
|
West Pharmaceutical Services Inc |
|
|
1,232,420 |
|
|
|
|
|
Total Pharmaceuticals, Biotechnology & Life Sciences |
|
|
16,979,616 |
|
|
|
|
|
|
|
|
|
|
|
|
|
|
|
Real Estate Management & Development - 0.2% |
|
|
|
|
| 2,190 |
|
(b) |
|
Jones Lang LaSalle Inc |
|
|
413,625 |
|
|
|
|
|
Total Real Estate Management & Development |
|
|
413,625 |
|
|
|
|
|
|
|
|
|
|
|
|
|
|
|
Semiconductors & Semiconductor Equipment - 5.9% |
|
|
|
|
| 17,840 |
|
(b) |
|
Allegro MicroSystems Inc |
|
|
540,017 |
|
| 830 |
|
|
|
Broadcom Inc |
|
|
926,488 |
|
| 15,130 |
|
|
|
Intel Corp |
|
|
760,282 |
|
| 16,610 |
|
|
|
NVIDIA Corp |
|
|
8,225,604 |
|
| 14,670 |
|
|
|
QUALCOMM Inc |
|
|
2,121,722 |
|
|
|
|
|
Total Semiconductors & Semiconductor Equipment |
|
|
12,574,113 |
|
|
|
|
|
|
|
61
|
|
|
| JCE |
|
Nuveen Core Equity Alpha Fund (continued) |
|
|
Portfolio of Investments December 31, 2023 |
|
|
|
|
|
|
|
|
|
|
|
|
|
|
|
|
|
|
|
|
|
|
|
|
|
| Shares |
|
|
|
Description (a) |
|
|
Value |
|
|
|
|
|
|
|
|
|
Software & Services - 12.3% |
|
|
|
|
|
| 5,210 |
|
(b) |
|
Adobe Inc |
|
|
$ |
3,108,286 |
|
| 750 |
|
(b) |
|
Atlassian Corp Ltd, Class A |
|
|
|
178,395 |
|
| 7,640 |
|
(b) |
|
Cadence Design Systems Inc |
|
|
|
2,080,907 |
|
| 7,940 |
|
(b) |
|
DocuSign Inc |
|
|
|
472,033 |
|
| 44,115 |
|
|
|
Microsoft Corp |
|
|
|
16,589,005 |
|
| 11,421 |
|
(b) |
|
Salesforce Inc |
|
|
|
3,005,322 |
|
| 1,000 |
|
(b) |
|
Synopsys Inc |
|
|
|
514,910 |
|
| 8,640 |
|
(b) |
|
Teradata Corp |
|
|
|
375,926 |
|
|
|
|
|
Total Software & Services |
|
|
|
26,324,784 |
|
|
|
|
|
|
|
|
|
|
|
|
|
|
|
Technology Hardware & Equipment - 9.3% |
|
|
|
|
|
| 86,548 |
|
(c) |
|
Apple Inc |
|
|
|
16,663,086 |
|
| 42,190 |
|
|
|
Cisco Systems Inc |
|
|
|
2,131,439 |
|
| 3,280 |
|
|
|
Motorola Solutions Inc |
|
|
|
1,026,935 |
|
|
|
|
|
Total Technology Hardware & Equipment |
|
|
|
19,821,460 |
|
|
|
|
|
|
|
|
|
|
|
|
|
|
|
Transportation - 0.1% |
|
|
|
|
|
| 3,850 |
|
(b) |
|
Alaska Air Group Inc |
|
|
|
150,419 |
|
|
|
|
|
Total Transportation |
|
|
|
150,419 |
|
|
|
|
|
|
|
|
|
|
|
|
|
|
|
Utilities - 1.5% |
|
|
|
|
|
| 12,920 |
|
|
|
Evergy Inc |
|
|
|
674,424 |
|
| 18,200 |
|
|
|
Sempra |
|
|
|
1,360,086 |
|
| 20,300 |
|
|
|
Xcel Energy Inc |
|
|
|
1,256,773 |
|
|
|
|
|
Total Utilities |
|
|
|
3,291,283 |
|
|
|
|
|
|
|
|
|
|
|
Total Common Stocks (cost
$167,582,749) |
|
|
|
212,795,418 |
|
|
|
|
|
|
|
|
|
|
|
| Shares |
|
|
|
Description (a) |
|
|
Value |
|
|
|
|
|
EXCHANGE-TRADED FUNDS - 0.5% |
|
|
|
|
|
|
|
|
|
| 2,285 |
|
|
|
iShares Core S&P 500 ETF |
|
|
$ |
1,091,385 |
|
|
|
|
|
Total Exchange-Traded Funds (cost
$961,733) |
|
|
|
1,091,385 |
|
|
|
|
|
|
|
|
|
|
|
|
|
|
|
| Type |
|
|
|
Description (d) |
|
Number of
Contracts |
|
|
Notional
Amount (e) |
|
|
Exercise
Price |
|
|
Expiration
Date |
|
|
Value |
|
|
|
|
|
OPTIONS PURCHASED - 0.0% |
|
|
|
|
|
| Put |
|
|
|
S&P 500 Index |
|
|
8 |
|
|
$ |
3,360,000 |
|
|
$ |
4200 |
|
|
|
1/19/24 |
|
|
$ |
1,020 |
|
|
|
|
|
Total Options Purchased (cost $3,139) |
|
|
8 |
|
|
$ |
3,360,000 |
|
|
|
|
|
|
|
|
|
|
|
1,020 |
|
|
|
|
|
|
|
|
|
|
|
Total Long-Term Investments (cost
$168,547,621) |
|
|
|
|
|
|
|
|
|
|
|
|
|
|
|
|
|
|
213,887,823 |
|
|
|
|
|
|
|
|
|
|
|
|
|
|
|
| Principal
Amount (000) |
|
|
|
Description (a) |
|
|
|
|
|
|
|
Coupon |
|
|
Maturity |
|
|
Value |
|
|
|
|
|
SHORT-TERM INVESTMENTS - 0.2% |
|
|
|
|
|
|
|
|
|
|
|
|
|
|
|
|
|
|
|
|
|
REPURCHASE AGREEMENTS - 0.2% |
|
|
|
|
|
|
|
|
|
|
|
|
|
|
|
|
|
|
$ 352 |
|
(f) |
|
Fixed Income Clearing Corp (FICC) |
|
|
|
|
|
|
|
1.600% |
|
|
|
1/02/24 |
|
|
$ |
352,017 |
|
|
|
|
|
Total Repurchase Agreements (cost
$352,017) |
|
|
|
|
|
|
|
|
|
|
|
352,017 |
|
|
|
|
|
|
|
|
|
|
|
Total Short-Term Investments (cost
$352,017) |
|
|
|
|
|
|
|
|
|
|
|
352,017 |
|
|
|
|
|
|
|
|
|
|
|
|
|
|
|
|
|
Total Investments (cost $168,899,638) - 100.3% |
|
|
|
|
|
|
|
|
|
|
|
214,239,840 |
|
|
|
|
|
|
|
|
|
|
|
Other Assets & Liabilities, Net - (0.3)% |
|
|
|
|
|
|
|
|
|
|
|
|
|
|
|
(570,606 |
) |
|
|
|
|
|
|
|
|
|
|
Net Assets Applicable to Common Shares - 100% |
|
|
|
|
|
|
|
|
|
|
$ |
213,669,234 |
|
|
|
|
|
|
|
62
Investments in Derivatives
Options Written
|
|
|
|
|
|
|
|
|
|
|
|
|
|
|
|
|
|
|
|
|
|
|
| Type |
|
Description(d) |
|
Number of
Contracts |
|
|
Notional
Amount (e) |
|
|
Exercise
Price |
|
|
Expiration Date |
|
|
Value |
|
| Call |
|
Russell 2000 Index |
|
|
(10) |
|
|
|
$(2,050,000) |
|
|
|
$2,050 |
|
|
|
1/19/24 |
|
|
|
$(27,550) |
|
| Call |
|
S&P 500 Index |
|
|
(20) |
|
|
|
(9,400,000) |
|
|
|
4,700 |
|
|
|
1/19/24 |
|
|
|
(202,900) |
|
| Call |
|
S&P 500 Index |
|
|
(30) |
|
|
|
(14,250,000) |
|
|
|
4,750 |
|
|
|
1/19/24 |
|
|
|
(193,500) |
|
| Call |
|
S&P 500 Index |
|
|
(25) |
|
|
|
(12,000,000) |
|
|
|
4,800 |
|
|
|
1/19/24 |
|
|
|
(90,250) |
|
| Total Options Written
(premiums received $148,242) |
|
|
(85) |
|
|
|
$(37,700,000) |
|
|
|
|
|
|
|
|
|
|
|
$(514,200) |
|
| |
For Fund portfolio compliance purposes, the Fund’s industry classifications refer to any one or more of the industry sub-classifications used by one or more widely recognized market indexes or ratings group indexes, and/or as defined by Fund management. This definition may not apply for purposes of this report, which may combine
industry sub-classifications into sectors for reporting ease. |
| (a) |
All percentages shown in the Portfolio of Investments are based on net assets applicable to common shares unless otherwise
noted. |
| (b) |
Non-income producing; issuer has not declared an
ex-dividend date within the past twelve months. |
| (c) |
Investment, or portion of investment, has been pledged to collateralize the net payment obligations for investments in
derivatives. |
| (d) |
Exchange-traded, unless otherwise noted. |
| (e) |
For disclosure purposes, Notional Amount is calculated by multiplying the Number of Contracts by the Exercise Price by
100. |
| (f) |
Agreement with Fixed Income Clearing Corporation, 1.600% dated 12/29/23 to be repurchased at $352,079 on 1/2/24,
collateralized by Government Agency Securities, with coupon rate 2.875% and maturity date 5/15/32, valued at $359,059. |
| REIT |
Real Estate Investment Trust |
See Notes to Financial Statements
63
Statement of Assets and Liabilities
|
|
|
|
|
|
|
|
|
|
|
|
|
|
|
|
|
|
|
|
|
| December 31, 2023 |
|
BXMX |
|
|
DIAX |
|
|
SPXX |
|
|
QQQX |
|
|
JCE |
|
| ASSETS |
|
|
|
|
|
|
|
|
|
|
|
|
|
|
|
|
|
|
|
|
|
|
|
|
|
|
| Long-term investments, at
value†‡ |
|
$ |
1,445,759,666 |
|
|
$ |
595,385,878 |
|
|
$ |
295,061,577 |
|
|
$ |
1,218,883,938 |
|
|
$ |
213,887,823 |
|
| Investments purchased with collateral from securities lending, at value
(cost approximates value) |
|
|
571,823 |
|
|
|
910,821 |
|
|
|
2,933,198 |
|
|
|
1,542,799 |
|
|
|
- |
|
| Short-term investments, at value¸ |
|
|
62,475,000 |
|
|
|
1,028,999 |
|
|
|
543,866 |
|
|
|
1,609,514 |
|
|
|
352,017 |
|
| Cash |
|
|
- |
|
|
|
- |
|
|
|
1,277 |
|
|
|
- |
|
|
|
- |
|
| Cash denominated in foreign currencies^ |
|
|
553 |
|
|
|
- |
|
|
|
- |
|
|
|
- |
|
|
|
- |
|
| Receivables: |
|
|
|
|
|
|
|
|
|
|
|
|
|
|
|
|
|
|
|
|
| Dividends |
|
|
1,346,172 |
|
|
|
214,025 |
|
|
|
223,545 |
|
|
|
211,817 |
|
|
|
193,384 |
|
| Interest |
|
|
27,645 |
|
|
|
137 |
|
|
|
73 |
|
|
|
215 |
|
|
|
47 |
|
| Reclaims |
|
|
2,213 |
|
|
|
- |
|
|
|
- |
|
|
|
329 |
|
|
|
- |
|
| Deferred offering costs |
|
|
- |
|
|
|
- |
|
|
|
212,709 |
|
|
|
36,674 |
|
|
|
- |
|
| Other |
|
|
346,848 |
|
|
|
55,016 |
|
|
|
63,054 |
|
|
|
143,573 |
|
|
|
41,068 |
|
|
|
|
|
|
|
| Total assets |
|
|
1,510,529,920 |
|
|
|
597,594,876 |
|
|
|
299,039,299 |
|
|
|
1,222,428,859 |
|
|
|
214,474,339 |
|
| LIABILITIES |
|
|
|
|
|
|
|
|
|
|
|
|
|
|
|
|
|
|
|
|
| Cash overdraft |
|
|
26,432,496 |
|
|
|
- |
|
|
|
- |
|
|
|
- |
|
|
|
- |
|
| Written options, at value# |
|
|
29,372,135 |
|
|
|
6,326,250 |
|
|
|
3,161,320 |
|
|
|
14,640,925 |
|
|
|
514,200 |
|
| Payables: |
|
|
|
|
|
|
|
|
|
|
|
|
|
|
|
|
|
|
|
|
| Management fees |
|
|
1,028,497 |
|
|
|
425,531 |
|
|
|
202,701 |
|
|
|
842,428 |
|
|
|
164,657 |
|
| Collateral from securities lending |
|
|
571,823 |
|
|
|
910,821 |
|
|
|
2,933,198 |
|
|
|
1,542,799 |
|
|
|
- |
|
| Accrued expenses: |
|
|
|
|
|
|
|
|
|
|
|
|
|
|
|
|
|
|
|
|
| Custodian fees |
|
|
72,732 |
|
|
|
36,510 |
|
|
|
51,588 |
|
|
|
64,029 |
|
|
|
36,135 |
|
| Investor relations |
|
|
180,521 |
|
|
|
79,241 |
|
|
|
44,198 |
|
|
|
158,290 |
|
|
|
24,461 |
|
| Trustees fees |
|
|
340,746 |
|
|
|
59,435 |
|
|
|
55,468 |
|
|
|
138,122 |
|
|
|
43,275 |
|
| Professional fees |
|
|
12,647 |
|
|
|
5,971 |
|
|
|
4,427 |
|
|
|
10,571 |
|
|
|
3,748 |
|
| Shareholder reporting expenses |
|
|
102,507 |
|
|
|
48,131 |
|
|
|
28,362 |
|
|
|
95,804 |
|
|
|
18,510 |
|
| Shareholder servicing agent fees |
|
|
163 |
|
|
|
120 |
|
|
|
124 |
|
|
|
163 |
|
|
|
119 |
|
| Shelf offering costs |
|
|
- |
|
|
|
- |
|
|
|
170 |
|
|
|
43,537 |
|
|
|
- |
|
| Other |
|
|
25,052 |
|
|
|
5,450 |
|
|
|
– |
|
|
|
67,141 |
|
|
|
– |
|
|
|
|
|
|
|
| Total liabilities |
|
|
58,139,319 |
|
|
|
7,897,460 |
|
|
|
6,481,556 |
|
|
|
17,603,809 |
|
|
|
805,105 |
|
|
|
|
|
|
|
| Net assets applicable to common shares |
|
$ |
1,452,390,601 |
|
|
$ |
589,697,416 |
|
|
$ |
292,557,743 |
|
|
$ |
1,204,825,050 |
|
|
$ |
213,669,234 |
|
|
|
|
|
|
|
| Common shares outstanding |
|
|
104,165,286 |
|
|
|
36,366,913 |
|
|
|
17,960,021 |
|
|
|
48,826,783 |
|
|
|
16,084,218 |
|
| Net asset value (“NAV”) per common share
outstanding |
|
$ |
13.94 |
|
|
$ |
16.22 |
|
|
$ |
16.29 |
|
|
$ |
24.68 |
|
|
$ |
13.28 |
|
| NET ASSETS APPLICABLE TO COMMON SHARES CONSIST OF: |
|
|
|
|
|
|
|
|
|
|
|
|
|
|
|
|
|
|
|
|
| Common shares, $0.01 par value per share |
|
$ |
1,041,653 |
|
|
$ |
363,669 |
|
|
$ |
179,600 |
|
|
$ |
488,268 |
|
|
$ |
160,842 |
|
| Paid-in capital |
|
|
498,649,133 |
|
|
|
214,192,677 |
|
|
|
117,730,825 |
|
|
|
415,539,940 |
|
|
|
168,468,420 |
|
| Total distributable earnings (loss) |
|
|
952,699,815 |
|
|
|
375,141,070 |
|
|
|
174,647,318 |
|
|
|
788,796,842 |
|
|
|
45,039,972 |
|
| Net assets applicable to common shares |
|
$ |
1,452,390,601 |
|
|
$ |
589,697,416 |
|
|
$ |
292,557,743 |
|
|
$ |
1,204,825,050 |
|
|
$ |
213,669,234 |
|
| Authorized shares: |
|
|
|
|
|
|
|
|
|
|
|
|
|
|
|
|
|
|
|
|
| Common |
|
|
Unlimited |
|
|
|
Unlimited |
|
|
|
Unlimited |
|
|
|
Unlimited |
|
|
|
Unlimited |
|
|
|
|
|
|
|
| † Long-term investments, cost |
|
$ |
472,674,465 |
|
|
$ |
219,812,715 |
|
|
$ |
119,704,179 |
|
|
$ |
421,018,027 |
|
|
$ |
168,547,621 |
|
|
|
|
|
|
|
| ¸ Short-term investments, cost |
|
$ |
62,475,000 |
|
|
$ |
1,028,999 |
|
|
$ |
543,866 |
|
|
$ |
1,609,514 |
|
|
$ |
352,017 |
|
|
|
|
|
|
|
|
‡ Includes
securities loaned of |
|
$ |
542,055 |
|
|
$ |
880,798 |
|
|
$ |
2,853,286 |
|
|
$ |
1,418,741 |
|
|
$ |
– |
|
|
|
|
|
|
|
| # Written options, premiums
received |
|
$ |
18,134,727 |
|
|
$ |
3,539,608 |
|
|
$ |
1,769,196 |
|
|
$ |
9,030,492 |
|
|
$ |
148,242 |
|
|
|
|
|
|
|
| ^ Cash denominated in foreign
currencies, cost |
|
$ |
536 |
|
|
$ |
– |
|
|
$ |
– |
|
|
$ |
– |
|
|
$ |
– |
|
See Notes to Financial Statements
64
Statement of Operations
|
|
|
|
|
|
|
|
|
|
|
|
|
|
|
|
|
|
|
|
|
| Year Ended December 31, 2023 |
|
BXMX |
|
|
DIAX |
|
|
SPXX |
|
|
QQQX |
|
|
JCE |
|
|
|
|
|
|
|
| INVESTMENT INCOME |
|
|
|
|
|
|
|
|
|
|
|
|
|
|
|
|
|
|
|
|
| Dividends |
|
$ |
23,489,945 |
|
|
$ |
12,606,830 |
|
|
$ |
4,650,348 |
|
|
$ |
10,128,283 |
|
|
$ |
3,080,909 |
|
| Interest |
|
|
1,195,450 |
|
|
|
23,619 |
|
|
|
11,645 |
|
|
|
46,723 |
|
|
|
9,097 |
|
| Securities lending income, net |
|
|
30,070 |
|
|
|
2,492 |
|
|
|
33,053 |
|
|
|
79,910 |
|
|
|
153 |
|
| Tax withheld |
|
|
(62,185 |
) |
|
|
– |
|
|
|
(1,000 |
) |
|
|
(7,870 |
) |
|
|
– |
|
| Total investment income |
|
|
24,653,280 |
|
|
|
12,632,941 |
|
|
|
4,694,046 |
|
|
|
10,247,046 |
|
|
|
3,090,159 |
|
|
|
|
|
|
|
| EXPENSES |
|
|
|
|
|
|
|
|
|
|
|
|
|
|
|
|
|
|
|
|
| Management fees |
|
|
11,720,779 |
|
|
|
4,938,219 |
|
|
|
2,324,589 |
|
|
|
9,375,678 |
|
|
|
1,873,902 |
|
| Shareholder servicing agent fees |
|
|
924 |
|
|
|
610 |
|
|
|
304 |
|
|
|
641 |
|
|
|
320 |
|
| Interest expense |
|
|
90,928 |
|
|
|
866 |
|
|
|
638 |
|
|
|
14,907 |
|
|
|
706 |
|
| Trustees fees |
|
|
50,915 |
|
|
|
20,844 |
|
|
|
10,282 |
|
|
|
40,843 |
|
|
|
7,333 |
|
| Custodian expenses |
|
|
101,105 |
|
|
|
46,533 |
|
|
|
91,904 |
|
|
|
88,062 |
|
|
|
49,093 |
|
| Investor relations expenses |
|
|
263,604 |
|
|
|
120,744 |
|
|
|
68,357 |
|
|
|
241,936 |
|
|
|
41,360 |
|
| Professional fees |
|
|
129,170 |
|
|
|
85,152 |
|
|
|
65,825 |
|
|
|
125,120 |
|
|
|
66,923 |
|
| Shareholder reporting expenses |
|
|
146,041 |
|
|
|
72,809 |
|
|
|
50,372 |
|
|
|
144,504 |
|
|
|
32,659 |
|
| Stock exchange listing fees |
|
|
31,687 |
|
|
|
10,968 |
|
|
|
9,677 |
|
|
|
– |
|
|
|
7,355 |
|
| Other |
|
|
246,545 |
|
|
|
133,397 |
|
|
|
55,675 |
|
|
|
328,162 |
|
|
|
13,902 |
|
|
|
|
|
|
|
| Total expenses |
|
|
12,781,698 |
|
|
|
5,430,142 |
|
|
|
2,677,623 |
|
|
|
10,359,853 |
|
|
|
2,093,553 |
|
|
|
|
|
|
|
| Net investment income (loss) |
|
|
11,871,582 |
|
|
|
7,202,799 |
|
|
|
2,016,423 |
|
|
|
(112,807 |
) |
|
|
996,606 |
|
|
|
|
|
|
|
| REALIZED AND UNREALIZED GAIN (LOSS) |
|
|
|
|
|
|
|
|
|
|
|
|
|
|
|
|
|
|
|
|
| Realized gain (loss) from: |
|
|
|
|
|
|
|
|
|
|
|
|
|
|
|
|
|
|
|
|
| Investments |
|
|
71,087,372 |
|
|
|
44,508,309 |
|
|
|
25,845,287 |
|
|
|
171,170,159 |
|
|
|
5,865,459 |
|
| Written options |
|
|
(64,188,719 |
) |
|
|
(36,025,816 |
) |
|
|
(17,718,688 |
) |
|
|
(127,634,999 |
) |
|
|
(3,443,165 |
) |
| Foreign currency transactions |
|
|
504 |
|
|
|
– |
|
|
|
– |
|
|
|
– |
|
|
|
– |
|
| Net realized gain (loss) |
|
|
6,899,157 |
|
|
|
8,482,493 |
|
|
|
8,126,599 |
|
|
|
43,535,160 |
|
|
|
2,422,294 |
|
|
|
|
|
|
|
| Change in unrealized appreciation (depreciation) on: |
|
|
|
|
|
|
|
|
|
|
|
|
|
|
|
|
|
|
|
|
| Investments |
|
|
249,318,823 |
|
|
|
31,672,322 |
|
|
|
39,899,041 |
|
|
|
297,126,137 |
|
|
|
37,772,549 |
|
| Written options |
|
|
(26,901,319 |
) |
|
|
(4,664,741 |
) |
|
|
(2,252,036 |
) |
|
|
(13,045,299 |
) |
|
|
(651,805 |
) |
| Foreign currency translations |
|
|
213 |
|
|
|
– |
|
|
|
– |
|
|
|
– |
|
|
|
– |
|
| Net change in unrealized appreciation (depreciation) |
|
|
222,417,717 |
|
|
|
27,007,581 |
|
|
|
37,647,005 |
|
|
|
284,080,838 |
|
|
|
37,120,744 |
|
|
|
|
|
|
|
| Net realized and unrealized gain (loss) |
|
|
229,316,874 |
|
|
|
35,490,074 |
|
|
|
45,773,604 |
|
|
|
327,615,998 |
|
|
|
39,543,038 |
|
|
|
|
|
|
|
| Net increase (decrease) in net assets applicable to common
shares from operations |
|
$ |
241,188,456 |
|
|
$ |
42,692,873 |
|
|
$ |
47,790,027 |
|
|
$ |
327,503,191 |
|
|
$ |
40,539,644 |
|
See Notes to Financial Statements
65
Statement of Changes in Net Assets
|
|
|
|
|
|
|
|
|
|
|
|
|
|
|
|
|
|
|
|
|
|
|
| |
|
BXMX |
|
|
DIAX |
|
|
|
|
|
|
|
|
| |
|
Year Ended
12/31/23 |
|
|
Year Ended
12/31/22 |
|
|
|
|
|
Year Ended
12/31/23 |
|
|
Year Ended
12/31/22 |
|
|
|
| OPERATIONS |
|
|
|
|
|
|
|
|
|
|
|
|
|
|
|
|
|
|
|
|
|
|
| Net investment income (loss) |
|
$ |
11,871,582 |
|
|
$ |
9,828,657 |
|
|
|
|
|
|
$ |
7,202,799 |
|
|
$ |
7,248,390 |
|
|
|
| Net realized gain (loss) |
|
|
6,899,157 |
|
|
|
130,874,764 |
|
|
|
|
|
|
|
8,482,493 |
|
|
|
26,781,810 |
|
|
|
| Net change in unrealized appreciation (depreciation) |
|
|
222,417,717 |
|
|
|
(324,625,247 |
) |
|
|
|
|
|
|
27,007,581 |
|
|
|
(61,332,721 |
) |
|
|
|
|
|
|
|
|
|
| Net increase (decrease) in net assets applicable to common shares
from operations |
|
|
241,188,456 |
|
|
|
(183,921,826 |
) |
|
|
|
|
|
|
42,692,873 |
|
|
|
(27,302,521 |
) |
|
|
|
|
|
|
|
|
|
| DISTRIBUTIONS TO COMMON SHAREHOLDERS |
|
|
|
|
|
|
|
|
|
|
|
|
|
|
|
|
|
|
|
|
|
|
| Dividends |
|
|
(71,581,067 |
) |
|
|
(98,466,148 |
) |
|
|
|
|
|
|
(10,665,642 |
) |
|
|
(40,345,882 |
) |
|
|
| Return of Capital |
|
|
(26,959,293 |
) |
|
|
– |
|
|
|
|
|
|
|
(31,039,934 |
) |
|
|
(1,359,694 |
) |
|
|
|
|
|
|
|
|
|
| Total distributions |
|
|
(98,540,360 |
) |
|
|
(98,466,148 |
) |
|
|
|
|
|
|
(41,705,576 |
) |
|
|
(41,705,576 |
) |
|
|
|
|
|
|
|
|
|
| CAPITAL SHARE TRANSACTIONS |
|
|
|
|
|
|
|
|
|
|
|
|
|
|
|
|
|
|
|
|
|
|
|
|
|
|
|
|
|
| Common shares: |
|
|
|
|
|
|
|
|
|
|
|
|
|
|
|
|
|
|
|
|
|
|
|
|
|
|
|
|
|
| Reinvestments of distributions |
|
|
986,113 |
|
|
|
– |
|
|
|
|
|
|
|
– |
|
|
|
– |
|
|
|
|
|
|
|
|
|
|
| Net increase (decrease) applicable to common shares from capital
share transactions |
|
|
986,113 |
|
|
|
– |
|
|
|
|
|
|
|
– |
|
|
|
– |
|
|
|
| Net increase (decrease) in net assets applicable to common
shares |
|
|
143,634,209 |
|
|
|
(282,387,974 |
) |
|
|
|
|
|
|
987,297 |
|
|
|
(69,008,097 |
) |
|
|
| Net assets applicable to common shares at the beginning of the
period |
|
|
1,308,756,392 |
|
|
|
1,591,144,366 |
|
|
|
|
|
|
|
588,710,119 |
|
|
|
657,718,216 |
|
|
|
|
|
|
|
|
|
|
| Net assets applicable to common shares at the end of the
period |
|
$ |
1,452,390,601 |
|
|
$ |
1,308,756,392 |
|
|
|
|
|
|
$ |
589,697,416 |
|
|
$ |
588,710,119 |
|
|
|
See Notes to Financial Statements
66
|
|
|
|
|
|
|
|
|
|
|
|
|
|
|
|
|
|
|
|
|
| |
|
SPXX |
|
QQQX |
|
|
|
|
|
|
|
| |
|
Year Ended
12/31/23 |
|
|
Year Ended
12/31/22 |
|
|
|
|
Year Ended
12/31/23 |
|
|
Year Ended
12/31/22 |
|
|
|
| OPERATIONS |
|
|
|
|
|
|
|
|
|
|
|
|
|
|
|
|
|
|
|
|
| Net investment income (loss) |
|
$ |
2,016,423 |
|
|
$ |
2,227,889 |
|
|
|
|
$ |
(112,807 |
) |
|
$ |
403,565 |
|
|
|
| Net realized gain (loss) |
|
|
8,126,599 |
|
|
|
20,649,764 |
|
|
|
|
|
43,535,160 |
|
|
|
104,349,228 |
|
|
|
| Net change in unrealized appreciation (depreciation) |
|
|
37,647,005 |
|
|
|
(70,181,751 |
) |
|
|
|
|
284,080,838 |
|
|
|
(480,763,794 |
) |
|
|
|
|
|
|
|
|
|
| Net increase (decrease) in net assets applicable to common shares
from operations |
|
|
47,790,027 |
|
|
|
(47,304,098 |
) |
|
|
|
|
327,503,191 |
|
|
|
(376,011,001 |
) |
|
|
|
|
|
|
|
|
|
| DISTRIBUTIONS TO COMMON SHAREHOLDERS |
|
|
|
|
|
|
|
|
|
|
|
|
|
|
|
|
|
|
|
|
| Dividends |
|
|
(13,323,270 |
) |
|
|
(20,756,114 |
) |
|
|
|
|
(59,281,400 |
) |
|
|
(93,184,576 |
) |
|
|
| Return of Capital |
|
|
(7,797,715 |
) |
|
|
- |
|
|
|
|
|
(22,507,046 |
) |
|
|
- |
|
|
|
|
|
|
|
|
|
|
| Total distributions |
|
|
(21,120,985 |
) |
|
|
(20,756,114 |
) |
|
|
|
|
(81,788,446 |
) |
|
|
(93,184,576 |
) |
|
|
|
|
|
|
|
|
|
| CAPITAL SHARE TRANSACTIONS |
|
|
|
|
|
|
|
|
|
|
|
|
|
|
|
|
|
|
|
|
|
|
|
|
|
|
|
| Common shares: |
|
|
|
|
|
|
|
|
|
|
|
|
|
|
|
|
|
|
|
|
|
|
|
|
|
|
|
| Proceeds from shelf offering, net of offering costs |
|
|
(7,370 |
) |
|
|
10,181,265 |
|
|
|
|
|
7,390,865 |
|
|
|
81,420,803 |
|
|
|
| Reinvestments of distributions |
|
|
135,722 |
|
|
|
223,858 |
|
|
|
|
|
2,001,708 |
|
|
|
2,625,827 |
|
|
|
|
|
|
|
|
|
|
| Net increase (decrease) applicable to common shares from capital
share transactions |
|
|
128,352 |
|
|
|
10,405,123 |
|
|
|
|
|
9,392,573 |
|
|
|
84,046,630 |
|
|
|
| Net increase (decrease) in net assets applicable to common
shares |
|
|
26,797,394 |
|
|
|
(57,655,089 |
) |
|
|
|
|
255,107,318 |
|
|
|
(385,148,947 |
) |
|
|
| Net assets applicable to common shares at the beginning of the
period |
|
|
265,760,349 |
|
|
|
323,415,438 |
|
|
|
|
|
949,717,732 |
|
|
|
1,334,866,679 |
|
|
|
|
|
|
|
|
|
|
| Net assets applicable to common shares at the end of the
period |
|
$ |
292,557,743 |
|
|
$ |
265,760,349 |
|
|
|
|
$ |
1,204,825,050 |
|
|
$ |
949,717,732 |
|
|
|
See Notes to Financial Statements
67
|
|
|
|
|
|
|
|
|
|
|
| |
|
JCE |
|
|
|
|
| |
|
Year Ended
12/31/23 |
|
|
Year Ended
12/31/22 |
|
|
|
| OPERATIONS |
|
|
|
|
|
|
|
|
|
|
| Net investment income (loss) |
|
$ |
996,606 |
|
|
$ |
1,534,041 |
|
|
|
| Net realized gain (loss) |
|
|
2,422,294 |
|
|
|
(1,637,397 |
) |
|
|
| Net change in unrealized appreciation (depreciation) |
|
|
37,120,744 |
|
|
|
(47,326,005 |
) |
|
|
|
|
|
|
| Net increase (decrease) in net assets applicable to common shares
from operations |
|
|
40,539,644 |
|
|
|
(47,429,361 |
) |
|
|
|
|
|
|
| DISTRIBUTIONS TO COMMON SHAREHOLDERS |
|
|
|
|
|
|
|
|
|
|
| Dividends |
|
|
(1,294,889 |
) |
|
|
(32,669,229 |
) |
|
|
| Return of Capital |
|
|
(19,292,910 |
) |
|
|
(4,773,720 |
) |
|
|
|
|
|
|
| Total distributions |
|
|
(20,587,799 |
) |
|
|
(37,442,949 |
) |
|
|
|
|
|
|
| CAPITAL SHARE TRANSACTIONS |
|
|
|
|
|
|
|
|
|
|
| Common shares: |
|
|
|
|
|
|
|
|
|
|
|
|
|
|
| Reinvestments of distributions |
|
|
149,097 |
|
|
|
396,514 |
|
|
|
|
|
|
|
| Net increase (decrease) applicable to common shares from capital
share transactions |
|
|
149,097 |
|
|
|
396,514 |
|
|
|
| Net increase (decrease) in net assets applicable to common
shares |
|
|
20,100,942 |
|
|
|
(84,475,796 |
) |
|
|
| Net assets applicable to common shares at the beginning of the
period |
|
|
193,568,292 |
|
|
|
278,044,088 |
|
|
|
|
|
|
|
| Net assets applicable to common shares at the end of the
period |
|
$ |
213,669,234 |
|
|
$ |
193,568,292 |
|
|
|
See Notes to Financial Statements
68
[This page intentionally left blank.]
69
Financial Highlights
The following data is for a common share outstanding for each fiscal year end unless otherwise noted:
|
|
|
|
|
|
|
|
|
|
|
|
|
|
|
|
|
|
|
|
|
|
|
|
|
|
|
|
|
|
|
|
|
|
|
|
|
|
|
|
|
|
|
|
|
|
|
|
|
| |
|
|
|
|
Investment Operations |
|
|
Less Distributions to
Common Shareholders |
|
|
Common Share |
|
|
|
|
|
|
|
|
|
|
|
|
|
|
| |
|
Common
Share Net Asset
Value,
Beginning of Period |
|
|
Net
Investment Income (NII)
(Loss)(a) |
|
|
Net
Realized/ Unrealized
Gain (Loss) |
|
|
Total |
|
|
From
NII |
|
|
From Net
Realized Gains |
|
|
Return of
Capital |
|
|
Total |
|
|
Shelf
Offering Costs |
|
|
Premium
per Share
Sold through
Shelf Offering |
|
|
Net Asset
Value, End of
Period |
|
|
Share
Price, End of
Period |
|
| BXMX |
|
|
|
|
|
|
|
|
|
|
|
|
|
|
|
|
|
|
|
|
|
|
|
|
|
|
|
|
|
|
|
|
|
|
|
|
|
|
|
|
|
|
|
|
|
|
|
|
| 12/31/23 |
|
|
$12.57 |
|
|
|
$0.11 |
|
|
|
$2.20 |
|
|
|
$2.31 |
|
|
|
$(0.11) |
|
|
|
$(0.57) |
|
|
|
$(0.26) |
|
|
|
$(0.94) |
|
|
|
$– |
|
|
|
$– |
|
|
|
$13.94 |
|
|
|
$12.83 |
|
| 12/31/22 |
|
|
15.29 |
|
|
|
0.09 |
|
|
|
(1.86) |
|
|
|
(1.77) |
|
|
|
(0.10) |
|
|
|
(0.85) |
|
|
|
– |
|
|
|
(0.95) |
|
|
|
– |
|
|
|
– |
|
|
|
12.57 |
|
|
|
12.65 |
|
| 12/31/21 |
|
|
13.75 |
|
|
|
0.04 |
|
|
|
2.36 |
|
|
|
2.40 |
|
|
|
(0.07) |
|
|
|
(0.41) |
|
|
|
(0.38) |
|
|
|
(0.86) |
|
|
|
– |
|
|
|
– |
|
|
|
15.29 |
|
|
|
14.65 |
|
| 12/31/20 |
|
|
13.68 |
|
|
|
0.15 |
|
|
|
0.80 |
|
|
|
0.95 |
|
|
|
(0.12) |
|
|
|
– |
|
|
|
(0.76) |
|
|
|
(0.88) |
|
|
|
–(c) |
|
|
|
–(c) |
|
|
|
13.75 |
|
|
|
12.88 |
|
| 12/31/19 |
|
|
12.61 |
|
|
|
0.16 |
|
|
|
1.84 |
|
|
|
2.00 |
|
|
|
(0.16) |
|
|
|
– |
|
|
|
(0.77) |
|
|
|
(0.93) |
|
|
|
–(c) |
|
|
|
–(c) |
|
|
|
13.68 |
|
|
|
13.75 |
|
| DIAX |
|
|
|
|
|
|
|
|
|
|
|
|
|
|
|
|
|
|
|
|
|
|
|
|
|
|
|
|
|
|
|
|
|
|
|
|
|
|
|
|
|
|
|
|
|
|
|
|
| 12/31/23 |
|
|
16.19 |
|
|
|
0.20 |
|
|
|
0.98 |
|
|
|
1.18 |
|
|
|
(0.20) |
|
|
|
(0.10) |
|
|
|
(0.85) |
|
|
|
(1.15) |
|
|
|
– |
|
|
|
– |
|
|
|
16.22 |
|
|
|
14.00 |
|
| 12/31/22 |
|
|
18.09 |
|
|
|
0.20 |
|
|
|
(0.95) |
|
|
|
(0.75) |
|
|
|
(0.20) |
|
|
|
(0.91) |
|
|
|
(0.04) |
|
|
|
(1.15) |
|
|
|
– |
|
|
|
– |
|
|
|
16.19 |
|
|
|
15.51 |
|
| 12/31/21 |
|
|
16.65 |
|
|
|
0.17 |
|
|
|
2.36 |
|
|
|
2.53 |
|
|
|
(0.17) |
|
|
|
(0.16) |
|
|
|
(0.76) |
|
|
|
(1.09) |
|
|
|
– |
|
|
|
– |
|
|
|
18.09 |
|
|
|
17.77 |
|
| 12/31/20 |
|
|
18.20 |
|
|
|
0.22 |
|
|
|
(0.66) |
|
|
|
(0.44) |
|
|
|
(0.22) |
|
|
|
(0.81) |
|
|
|
(0.08) |
|
|
|
(1.11) |
|
|
|
–(c) |
|
|
|
–(c) |
|
|
|
16.65 |
|
|
|
15.20 |
|
| 12/31/19 |
|
|
16.90 |
|
|
|
0.27 |
|
|
|
2.21 |
|
|
|
2.48 |
|
|
|
(0.27) |
|
|
|
– |
|
|
|
(0.91) |
|
|
|
(1.18) |
|
|
|
–(c) |
|
|
|
–(c) |
|
|
|
18.20 |
|
|
|
17.66 |
|
| SPXX |
|
|
|
|
|
|
|
|
|
|
|
|
|
|
|
|
|
|
|
|
|
|
|
|
|
|
|
|
|
|
|
|
|
|
|
|
|
|
|
|
|
|
|
|
|
|
|
|
| 12/31/23 |
|
|
14.80 |
|
|
|
0.11 |
|
|
|
2.56 |
|
|
|
2.67 |
|
|
|
(0.12) |
|
|
|
(0.63) |
|
|
|
(0.43) |
|
|
|
(1.18) |
|
|
|
– |
|
|
|
– |
|
|
|
16.29 |
|
|
|
15.04 |
|
| 12/31/22 |
|
|
18.70 |
|
|
|
0.13 |
|
|
|
(2.85) |
|
|
|
(2.72) |
|
|
|
(0.13) |
|
|
|
(1.05) |
|
|
|
– |
|
|
|
(1.18) |
|
|
|
– |
|
|
|
– |
|
|
|
14.80 |
|
|
|
16.12 |
|
| 12/31/21 |
|
|
16.17 |
|
|
|
0.11 |
|
|
|
3.40 |
|
|
|
3.51 |
|
|
|
(0.11) |
|
|
|
(0.60) |
|
|
|
(0.27) |
|
|
|
(0.98) |
|
|
|
–(c) |
|
|
|
–(c) |
|
|
|
18.70 |
|
|
|
18.60 |
|
| 12/31/20 |
|
|
16.27 |
|
|
|
0.15 |
|
|
|
0.75 |
|
|
|
0.90 |
|
|
|
(0.15) |
|
|
|
– |
|
|
|
(0.85) |
|
|
|
(1.00) |
|
|
|
–(c) |
|
|
|
–(c) |
|
|
|
16.17 |
|
|
|
15.24 |
|
| 12/31/19 |
|
|
14.42 |
|
|
|
0.17 |
|
|
|
2.74 |
|
|
|
2.91 |
|
|
|
(0.18) |
|
|
|
– |
|
|
|
(0.88) |
|
|
|
(1.06) |
|
|
|
–(c) |
|
|
|
–(c) |
|
|
|
16.27 |
|
|
|
16.47 |
|
| QQQX |
|
|
|
|
|
|
|
|
|
|
|
|
|
|
|
|
|
|
|
|
|
|
|
|
|
|
|
|
|
|
|
|
|
|
|
|
|
|
|
|
|
|
|
|
|
|
|
|
| 12/31/23 |
|
|
19.61 |
|
|
|
–(c) |
|
|
|
6.74 |
|
|
|
6.74 |
|
|
|
– |
|
|
|
(1.22) |
|
|
|
(0.46) |
|
|
|
(1.68) |
|
|
|
–(c) |
|
|
|
0.01 |
|
|
|
24.68 |
|
|
|
23.15 |
|
| 12/31/22 |
|
|
29.63 |
|
|
|
0.01 |
|
|
|
(8.06) |
|
|
|
(8.05) |
|
|
|
(0.01) |
|
|
|
(1.96) |
|
|
|
– |
|
|
|
(1.97) |
|
|
|
– |
|
|
|
– |
|
|
|
19.61 |
|
|
|
20.43 |
|
| 12/31/21 |
|
|
26.32 |
|
|
|
(0.06) |
|
|
|
5.12 |
|
|
|
5.06 |
|
|
|
– |
|
|
|
(0.78) |
|
|
|
(1.01) |
|
|
|
(1.79) |
|
|
|
–(c) |
|
|
|
0.04 |
|
|
|
29.63 |
|
|
|
30.65 |
|
| 12/31/20 |
|
|
24.12 |
|
|
|
0.04 |
|
|
|
3.70 |
|
|
|
3.74 |
|
|
|
(0.01) |
|
|
|
– |
|
|
|
(1.55) |
|
|
|
(1.56) |
|
|
|
–(c) |
|
|
|
0.02 |
|
|
|
26.32 |
|
|
|
26.01 |
|
| 12/31/19 |
|
|
20.27 |
|
|
|
0.06 |
|
|
|
5.33 |
|
|
|
5.39 |
|
|
|
(0.05) |
|
|
|
– |
|
|
|
(1.51) |
|
|
|
(1.56) |
|
|
|
–(c) |
|
|
|
0.02 |
|
|
|
24.12 |
|
|
|
24.05 |
|
| (a) |
Based on average shares outstanding. |
70
|
|
|
|
|
|
|
|
|
|
|
|
|
|
|
|
|
|
|
|
|
|
|
|
|
| |
|
|
|
|
|
|
|
Common Share Supplemental Data/
Ratios Applicable to Common Shares |
|
| |
|
Common Share
Total Returns |
|
|
|
|
|
Ratios to Average
Net Assets |
|
|
|
|
|
|
|
|
|
|
|
| |
|
Based
on Net Asset
Value(b) |
|
|
Based
on Share
Price(b) |
|
|
Net
Assets,
End of
Period (000) |
|
|
Expenses |
|
|
Net
Investment Income
(Loss) |
|
|
Portfolio
Turnover Rate |
|
| |
|
|
|
|
|
|
|
|
|
|
|
|
|
|
|
|
|
|
|
|
|
18.84% |
|
|
|
9.05% |
|
|
$ |
1,452,391 |
|
|
|
0.91% |
|
|
|
0.85% |
|
|
|
16% |
|
|
|
|
(11.63) |
|
|
|
(7.09) |
|
|
|
1,308,756 |
|
|
|
0.89 |
|
|
|
0.70 |
|
|
|
6 |
|
|
|
|
17.80 |
|
|
|
20.75 |
|
|
|
1,591,144 |
|
|
|
0.89 |
|
|
|
0.31 |
|
|
|
7 |
|
|
|
|
7.92 |
|
|
|
1.16 |
|
|
|
1,431,454 |
|
|
|
0.91 |
|
|
|
1.14 |
|
|
|
22 |
|
| |
|
|
16.16 |
|
|
|
22.08 |
|
|
|
1,422,672 |
|
|
|
0.91 |
|
|
|
1.18 |
|
|
|
4 |
|
| |
|
|
|
|
|
|
|
|
|
|
|
|
|
|
|
|
|
|
|
|
|
|
|
|
|
|
|
7.67 |
|
|
|
(2.18) |
|
|
|
589,697 |
|
|
|
0.94 |
|
|
|
1.25 |
|
|
|
12 |
|
|
|
|
(3.92) |
|
|
|
(5.93) |
|
|
|
588,710 |
|
|
|
0.93 |
|
|
|
1.20 |
|
|
|
15 |
|
|
|
|
15.45 |
|
|
|
24.60 |
|
|
|
657,718 |
|
|
|
0.92 |
|
|
|
0.96 |
|
|
|
8 |
|
|
|
|
(1.49) |
|
|
|
(6.73) |
|
|
|
605,601 |
|
|
|
0.94 |
|
|
|
1.40 |
|
|
|
27 |
|
| |
|
|
14.94 |
|
|
|
17.07 |
|
|
|
661,255 |
|
|
|
0.95 |
|
|
|
1.49 |
|
|
|
6 |
|
| |
|
|
|
|
|
|
|
|
|
|
|
|
|
|
|
|
|
|
|
|
|
|
|
|
|
|
|
18.45 |
|
|
|
0.75 |
|
|
|
292,558 |
|
|
|
0.94 |
|
|
|
0.71 |
|
|
|
21 |
|
|
|
|
(14.70) |
|
|
|
(6.79) |
|
|
|
265,760 |
|
|
|
0.92 |
|
|
|
0.78 |
|
|
|
32 |
|
|
|
|
22.15 |
|
|
|
29.03 |
|
|
|
323,415 |
|
|
|
0.90 |
|
|
|
0.61 |
|
|
|
26 |
|
|
|
|
6.60 |
|
|
|
(0.24) |
|
|
|
277,949 |
|
|
|
0.93 |
|
|
|
1.03 |
|
|
|
20 |
|
| |
|
|
20.62 |
|
|
|
25.40 |
|
|
|
275,280 |
|
|
|
0.99 |
|
|
|
1.11 |
|
|
|
8 |
|
| |
|
|
|
|
|
|
|
|
|
|
|
|
|
|
|
|
|
|
|
|
|
|
|
|
|
|
|
35.03 |
|
|
|
21.78 |
|
|
|
1,204,825 |
|
|
|
0.92 |
|
|
|
(0.01) |
|
|
|
35 |
|
|
|
|
(27.68) |
|
|
|
(27.25) |
|
|
|
949,718 |
|
|
|
0.92 |
|
|
|
0.04 |
|
|
|
36 |
|
|
|
|
19.85 |
|
|
|
25.39 |
|
|
|
1,334,867 |
|
|
|
0.90 |
|
|
|
(0.21) |
|
|
|
32 |
|
|
|
|
16.61 |
|
|
|
15.66 |
|
|
|
1,092,308 |
|
|
|
0.94 |
|
|
|
0.15 |
|
|
|
20 |
|
| |
|
|
27.33 |
|
|
|
28.73 |
|
|
|
951,945 |
|
|
|
0.91 |
|
|
|
0.25 |
|
|
|
11 |
|
| (b) |
Total Return Based on Common Share NAV is the combination of changes in common share NAV, reinvested dividend income at
Common Share NAV and reinvested capital gains distributions at NAV, if any. The last dividend declared in the period, which is typically paid on the first business day of the following month, is assumed to be reinvested at the ending NAV. The actual
reinvest price for the last dividend declared in the period may often be based on the Fund’s market price (and not its NAV), and therefore may be different from the price used in the calculation. Total returns are not annualized.
|
| |
Total Return Based on Common Share Price is the combination of changes in the market price per share and the effect of
reinvested dividend income and reinvested capital gains distributions, if any, at the average price paid per share at the time of reinvestment. The last dividend declared in the period, which is typically paid on the first business day of the
following month, is assumed to be reinvested at the ending market price. The actual reinvestment for the last dividend declared in the period may take place over several days, and in some instances may not be based on the market price, so the actual
reinvestment price may be different from the price used in the calculation. Total returns are not annualized. |
| (c) |
Value rounded to zero. |
See Notes to Financial Statements
71
Financial Highlights (continuted)
The following data is for a common share outstanding for each fiscal year end unless otherwise noted:
|
|
|
|
|
|
|
|
|
|
|
|
|
|
|
|
|
|
|
|
|
|
|
|
|
|
|
|
|
|
|
|
|
|
|
|
|
|
|
|
|
|
|
|
|
| |
|
|
|
|
Investment Operations |
|
|
Less Distributions to
Common Shareholders |
|
|
Common Share |
|
| |
|
Common
Share Net Asset
Value, Beginning
of Period |
|
|
Net
Investment Income (NII)
(Loss)(a) |
|
|
Net
Realized/ Unrealized
Gain (Loss) |
|
|
Total |
|
|
From
NII |
|
|
From Net
Realized Gains |
|
|
Return of
Capital |
|
|
Total |
|
|
Premium
per Share
Sold through
Shelf Offering |
|
|
Net Asset
Value, End of
Period |
|
|
Share
Price, End of
Period |
|
| JCE |
|
|
|
|
|
|
|
|
|
|
|
|
|
|
|
|
|
|
|
|
|
|
|
|
|
|
|
|
|
|
|
|
|
|
|
|
|
|
|
|
|
|
|
|
| 12/31/23 |
|
|
$12.04 |
|
|
|
$0.06 |
|
|
|
$2.46 |
|
|
|
$2.52 |
|
|
|
$(0.06 |
) |
|
|
$(0.02 |
) |
|
|
$(1.20 |
) |
|
|
$(1.28 |
) |
|
|
$– |
|
|
|
$13.28 |
|
|
|
$13.55 |
|
| 12/31/22 |
|
|
17.33 |
|
|
|
0.10 |
|
|
|
(3.06) |
|
|
|
(2.96) |
|
|
|
(0.10 |
) |
|
|
(1.93 |
) |
|
|
(0.30 |
) |
|
|
(2.33 |
) |
|
|
– |
|
|
|
12.04 |
|
|
|
13.54 |
|
| 12/31/21 |
|
|
15.21 |
|
|
|
0.01 |
|
|
|
3.95 |
|
|
|
3.96 |
|
|
|
(0.07 |
) |
|
|
(1.77 |
) |
|
|
– |
|
|
|
(1.84 |
) |
|
|
– |
|
|
|
17.33 |
|
|
|
18.58 |
|
| 12/31/20 |
|
|
15.04 |
|
|
|
0.14 |
|
|
|
0.96 |
|
|
|
1.10 |
|
|
|
(0.10 |
) |
|
|
(0.83 |
) |
|
|
– |
|
|
|
(0.93 |
) |
|
|
–(c) |
|
|
|
15.21 |
|
|
|
14.07 |
|
| 12/31/19 |
|
|
12.68 |
|
|
|
0.09 |
|
|
|
3.27 |
|
|
|
3.36 |
|
|
|
(0.10 |
) |
|
|
(0.55 |
) |
|
|
(0.35 |
) |
|
|
(1.00 |
) |
|
|
– |
|
|
|
15.04 |
|
|
|
14.62 |
|
| (a) |
Based on average shares outstanding. |
| (b) |
Total Return Based on Common Share NAV is the combination of changes in common share NAV, reinvested dividend income at
Common Share NAV and reinvested capital gains distributions at NAV, if any. The last dividend declared in the period, which is typically paid on the first business day of the following month, is assumed to be reinvested at the ending NAV. The actual
reinvest price for the last dividend declared in the period may often be based on the Fund’s market price (and not its NAV), and therefore may be different from the price used in the calculation. Total returns are not annualized.
|
| |
Total Return Based on Common Share Price is the combination of changes in the market price per share and the effect of
reinvested dividend income and reinvested capital gains distributions, if any, at the average price paid per share at the time of reinvestment. The last dividend declared in the period, which is typically paid on the first business day of the
following month, is assumed to be reinvested at the ending market price. The actual reinvestment for the last dividend declared in the period may take place over several days, and in some instances may not be based on the market price, so the actual
reinvestment price may be different from the price used in the calculation. Total returns are not annualized. |
72
|
|
|
|
|
|
|
|
|
|
|
|
|
|
|
|
|
|
|
|
|
|
|
|
|
| |
|
|
|
|
|
Common Share Supplemental Data/
Ratios Applicable to Common Shares |
|
| |
|
Common Share
Total Returns |
|
|
|
|
Ratios to Average
Net Assets |
|
|
|
|
|
|
|
|
|
| |
|
Based
on Net Asset
Value(b) |
|
Based
on Share
Price(b) |
|
Net
Assets, End of
Period (000) |
|
|
Expenses |
|
Net
Investment Income
(Loss) |
|
Portfolio
Turnover Rate |
| |
|
|
|
|
|
|
|
|
|
|
|
|
|
|
|
|
|
|
|
|
|
|
|
|
|
|
|
21.68 |
% |
|
|
10.60 |
% |
|
|
$213,669 |
|
|
|
1.02 |
% |
|
|
0.48 |
% |
|
|
105 |
% |
|
|
|
(17.30 |
) |
|
|
(14.07 |
) |
|
|
193,568 |
|
|
|
1.00 |
|
|
|
0.66 |
|
|
|
92 |
|
|
|
|
26.91 |
|
|
|
47.15 |
|
|
|
278,044 |
|
|
|
0.98 |
|
|
|
0.09 |
|
|
|
104 |
|
|
|
|
8.42 |
|
|
|
3.62 |
|
|
|
243,790 |
|
|
|
1.17 |
(d) |
|
|
1.00 |
(d) |
|
|
169 |
|
| |
|
|
26.96 |
|
|
|
30.26 |
|
|
|
241,024 |
|
|
|
1.01 |
|
|
|
0.64 |
|
|
|
35 |
|
| (c) |
Value rounded to zero. |
| (d) |
During the period ended December 31, 2020, the Adviser voluntarily reimbursed the Fund for certain expenses incurred
in connection with a common shares equity shelf program. As a result, the Expenses and Net Investment Income (Loss) Ratios to Average Net Assets reflect this voluntary expense reimbursement from Adviser. The Expenses and Net Investment Income (Loss)
Ratios to Average Net Assets excluding this expense reimbursement from Adviser were as follows: |
|
|
|
|
|
|
|
|
|
|
|
| |
|
Ratios to Average Net Assets |
|
| |
|
|
|
Expenses |
|
|
NII
(Loss) |
|
|
|
|
|
| |
|
12/31/20 |
|
|
1.23% |
|
|
|
0.94% |
|
See Notes to Financial Statements
73
Notes to Financial Statements
Fund Information: The funds covered in this report and their corresponding New York Stock Exchange (“NYSE”) or Nasdaq National Market
(“Nasdaq”) symbols are as follows (each a “Fund” and collectively, the “Funds”):
| |
· |
|
Nuveen S&P 500 Buy-Write Income Fund (BXMX) |
| |
· |
|
Nuveen Dow 30SM Dynamic Overwrite Fund (DIAX) |
| |
· |
|
Nuveen S&P 500 Dynamic Overwrite Fund (SPXX) |
| |
· |
|
Nuveen Nasdaq 100 Dynamic Overwrite Fund (QQQX) |
| |
· |
|
Nuveen Core Equity Alpha Fund (JCE) |
The Funds are registered under the Investment Company Act of 1940 (the “1940 Act”), as amended, as diversified
(non-diversified for DIAX and QQQX) closed-end management investment companies. Shares of BXMX, DIAX, SPXX and JCE are traded on the NYSE while shares of QQQX are traded
on the Nasdaq. BXMX, DIAX, SPXX, QQQX and JCE were organized as Massachusetts business trusts on July 23, 2004, May 20, 2014, November 11, 2004, May 20, 2014 and January 9, 2007, respectively.
Current Fiscal Period: The end of the reporting period for the Funds is December 31, 2023, and the period covered by these Notes to Financial Statements is
the fiscal year ended December 31, 2023 (the “current fiscal period”).
Investment Adviser and
Sub-Adviser: The Funds’ investment adviser is Nuveen Fund Advisors, LLC (the “Adviser”), a subsidiary of Nuveen, LLC (“Nuveen”). Nuveen is the investment management arm of Teachers
Insurance and Annuity Association of America (TIAA). The Adviser has overall responsibility for management of the Funds, oversees the management of the Funds’ portfolios, manages the Funds’ business affairs and provides certain clerical,
bookkeeping and other administrative services, and, if necessary, asset allocation decisions. The Adviser has entered into sub-advisory agreements with Gateway Investment Advisers, LLC (“Gateway”),
under which Gateway manages BXMX’s investment portfolio and Nuveen Asset Management, LLC (“NAM”), a subsidiary of the Adviser, under which NAM manages the investment portfolios of DIAX, SPXX, QQQX and JCE.
Developments Regarding the Funds’ Control Share By-Law: On October 5, 2020, the Funds and certain other closed-end funds in the Nuveen fund complex amended their by-laws. Among other things, the amended by-laws included provisions pursuant
to which, in summary, a shareholder who obtains beneficial ownership of common shares in a Control Share Acquisition (as defined in the by-laws) shall have the same voting rights as other common shareholders
only to the extent authorized by the other disinterested shareholders (the “Control Share By-Law”). On January 14, 2021, a shareholder of certain Nuveen
closed-end funds filed a civil complaint in the U.S. District Court for the Southern District of New York (the “District Court”) against certain Nuveen funds and their trustees, seeking a declaration
that such funds’ Control Share By-Laws violate the 1940 Act, rescission of such fund’s Control Share By-Laws and a permanent injunction against such funds
applying the Control Share By-Laws. On February 18, 2022, the District Court granted judgment in favor of the plaintiff’s claim for rescission of such funds’ Control Share By-Laws and the plaintiff’s declaratory judgment claim, and declared that such funds’ Control Share By-Laws violate Section 18(i) of the 1940 Act. Following
review of the judgment of the District Court, on February 22, 2022, the Funds’ Board of Trustees (the “Board”) amended the Fund’s by-laws to provide that the Funds’ Control Share By-Law shall be of no force and effect for so long as the judgment of the District Court is effective and that if the judgment of the District Court is reversed, overturned, vacated, stayed, or otherwise nullified,
the Fund’s Control Share By-Law will be automatically reinstated and apply to any beneficial owner of common shares acquired in a Control Share Acquisition, regardless of whether such Control Share
Acquisition occurs before or after such reinstatement, for the duration of the stay or upon issuance of the mandate reversing, overturning, vacating or otherwise nullifying the judgment of the District Court. On February 25, 2022, the Board and
the Funds appealed the District Court’s decision to the U.S. Court of Appeals for the Second Circuit. On November 30, 2023, the U.S. Court of Appeals for the Second Circuit upheld the opinion of the District Court.
| 2. |
Significant Accounting Policies |
The accompanying financial statements were prepared in accordance with accounting principles generally accepted in the United States of America (“U.S. GAAP”),
which may require the use of estimates made by management and the evaluation of subsequent events. Actual results may differ from those estimates. Each Fund is an investment company and follows accounting guidance in the Financial Accounting
Standards Board (“FASB”) Accounting Standards Codification 946, Financial Services – Investment Companies. The net asset value (“NAV”) for financial reporting purposes may differ from the NAV for processing security and
shareholder transactions. The NAV for financial reporting purposes includes security and shareholder transactions through the date of the report. Total return is computed based on the NAV used for processing security and shareholder transactions.
The following is a summary of the significant accounting policies consistently followed by the Funds.
Compensation: The Funds pay no compensation
directly to those of its officers, all of whom receive remuneration for their services to the Funds from the Adviser or its affiliates. The Board has adopted a deferred compensation plan for independent trustees that enables trustees
to elect to defer receipt of all or a portion of the annual compensation they are entitled to receive from certain Nuveen-advised funds. Under the plan, deferred amounts are treated as though equal dollar amounts had been invested in shares of
select Nuveen-advised funds.
Distributions to Common Shareholders: Distributions to common shareholders are recorded on the ex-dividend date. The amount, character and timing of distributions are determined in accordance with federal income tax regulations, which may differ from U.S. GAAP.
74
Each Fund makes quarterly cash distributions to shareholders of a stated dollar amount per share. Subject to approval
and oversight by the Board, each Fund seeks to maintain a stable distribution level designed to deliver the long-term return potential of each Fund’s investment strategy through regular quarterly distributions (a “Managed Distribution
Program”). Total distributions during a calendar year generally will be made from each Fund’s net investment income, net realized capital gains and net unrealized capital gains in the Fund’s portfolio, if any. The portion of
distributions paid attributed to net unrealized gains, if any, is distributed from the Fund’s assets and is treated by shareholders as a non-taxable distribution (“return of capital”) for tax
purposes. In the event that total distributions during a calendar year exceed a Fund’s total return on NAV, the difference will reduce NAV per share. If a Fund’s total return on NAV exceeds total distributions during a calendar year, the
excess will be reflected as an increase in NAV per share. The final determination of the source and character of all distributions paid by a Fund during the fiscal year is made after the end of the fiscal year and is reflected in the financial
statements contained in the annual report as of December 31 each year.
Foreign Currency Transactions and Translation: To the extent that the Funds invest
in securities and/or contracts that are denominated in a currency other than U.S. dollars, the Funds will be subject to currency risk, which is the risk that an increase in the U.S. dollar relative to the foreign currency will reduce returns or
portfolio value. Generally, when the U.S. dollar rises in value against a foreign currency, the Funds’ investments denominated in that currency will lose value because their currency is worth fewer U.S. dollars; the opposite effect occurs if
the U.S. dollar falls in relative value. Investments and other assets and liabilities denominated in foreign currencies are converted into U.S. dollars on a spot (i.e. cash) basis at the spot rate prevailing in the foreign currency exchange market
at the time of valuation. Purchases and sales of investments and income denominated in foreign currencies are translated into U.S. dollars on the respective dates of such transactions.
The books and records of the Funds are maintained in U.S. dollars. Assets, including investments, and liabilities denominated in foreign currencies are translated into
U.S. dollars at the end of each day. Purchases and sales of securities, income and expenses are translated into U.S. dollars at the prevailing exchange rate on the respective dates of the transactions.
Net realized foreign currency gains and losses resulting from changes in exchange rates associated with (i) foreign currency, (ii) investments and
(iii) derivatives include foreign currency gains and losses between trade date and settlement date of the transactions, foreign currency transactions, and the difference between the amounts of interest and dividends recorded on the books of the
Funds and the amounts actually received are recognized as a component of “Net realized gain (loss) from investments and foreign currency transactions” on the Statement of Operations, when applicable.
The unrealized gains and losses resulting from changes in foreign currency exchange rates and changes in foreign exchange rates associated with (i) investments and
(ii) other assets and liabilities are recognized as a component of “Change in net unrealized appreciation (depreciation) of foreign currency translations” on the Statement of Operations, when applicable. The unrealized gains and
losses resulting from changes in foreign exchange rates associated with investments in derivatives are recognized as a component of the respective derivative’s related “Change in net unrealized appreciation (depreciation)” on the
Statement of Operations, when applicable.
Foreign Taxes: The Funds may be subject to foreign taxes on income, gains on investments or foreign currency
repatriation, a portion of which may be recoverable. The Funds will accrue such taxes and recoveries as applicable, based upon the current interpretation of tax rules and regulations that exist in the markets in which the Funds invest.
Indemnifications: Under the Funds’ organizational documents, their officers and trustees are indemnified against certain liabilities arising out of the
performance of their duties to the Funds. In addition, in the normal course of business, the Funds enter into contracts that provide general indemnifications to other parties. The Funds’ maximum exposure under these arrangements is unknown
as this would involve future claims that may be made against the Funds that have not yet occurred. However, the Funds have not had prior claims or losses pursuant to these contracts and expects the risk of loss to be remote.
Investments and Investment Income: Securities transactions are accounted for as of the trade date for financial reporting purposes. Realized gains and losses on
securities transactions are based upon the specific identification method. Dividend income is recorded on the ex-dividend date or, for certain foreign securities, when information is available. Non-cash dividends received in the form of stock, if any, are recognized on the ex-dividend date and recorded at fair value. Interest income is recorded on an accrual basis.
Interest income also reflects payment-in-kind (“PIK”) interest and paydown gains and losses, if any. PIK interest represents income received in the form of
securities in lieu of cash. Securities lending income is comprised of fees earned from borrowers and income earned on cash collateral investments.
Netting
Agreements: In the ordinary course of business, the Funds may enter into transactions subject to enforceable International Swaps and Derivatives Association, Inc. (ISDA) master agreements or other similar arrangements (“netting
agreements”). Generally, the right to offset in netting agreements allows each Fund to offset certain securities and derivatives with a specific counterparty, when applicable, as well as any collateral received or delivered to that counterparty
based on the terms of the agreements. Generally, each Fund manages its cash collateral and securities collateral on a counterparty basis. With respect to certain counterparties, in accordance with the terms of the netting agreements, collateral
posted to the Funds is held in a segregated account by the Funds’ custodian and/or with respect to those amounts which can be sold or repledged, are presented in the Funds’ Portfolio of Investments or Statement of Assets and Liabilities.
The Funds’ investments subject to netting agreements as of the end of the reporting period, if any, are further described later in these Notes to Financials.
New Accounting Pronouncement: In March 2020, FASB issued Accounting Standards Update (“ASU”) 2020-04,
Reference Rate Reform: Facilitation of the Effects of Reference Rate Reform on Financial Reporting. The main objective of the new guidance is to provide relief to companies that will be impacted by the expected change in benchmark interest rates,
when participating banks will no longer be required to submit London Interbank Offered Rate (LIBOR) quotes by the UK Financial Conduct Authority (FCA). The new guidance allows companies to, provided the only change to existing contracts are a change
to an approved benchmark interest rate, account for modifications as a continuance of the existing contract without additional analysis. For new and existing contracts, the Funds may elect to apply the amendments as of March 12, 2020 through
December 31,
75
Notes to Financial Statements (continued)
2022. In December 2022, FASB deferred ASU 2022-04 and issued ASU 2022-06, Reference Rate Reform: Deferral of the Sunset Date of Topic 848, which extends the application of the amendments through December 31, 2024. Management has not yet elected to apply the amendments, is
continuously evaluating the potential effect a discontinuation of LIBOR could have on the Funds’ investments and has currently determined that it is unlikely the ASU’s adoption will have a significant impact on the Funds’ financial
statements and various filings.
New Accounting Pronouncement: In June 2022, the FASB issued ASU 2022-03 to clarify the
guidance in Topic 820, Fair Value Measurement (“Topic 820”). The amendments in ASU 2022-03 affect all entities that have investments in equity securities measured at fair value that are subject to a
contractual sale restriction. ASU 2022-03 (1) clarifies the guidance in Topic 820, when measuring the fair value of an equity security subject to contractual restrictions that prohibit the sale of equity
security, (2) amends a related illustrative example, and (3) introduces new disclosure requirements for equity securities subject to contractual sale restrictions that are measured at fair value in accordance with Topic 820. For public
business entities, the amendments in ASU 2022-03 are effective for fiscal years beginning after December 15, 2023, and interim periods within those fiscal years. For all other entities, the amendments are
effective for fiscal years beginning after December 15, 2024, and interim periods within those fiscal years. Early adoption is permitted for both interim and annual financial statements that have not yet been issued or made available for
issuance. During the current fiscal period, the Funds adopted the new guidance and there was no material impact to the Funds.
| 3. |
Investment Valuation and Fair Value Measurements |
The Funds’ investments in securities are recorded at their estimated fair value utilizing valuation methods approved by the Adviser, subject to oversight of
the Board. Fair value is defined as the price that would be received upon selling an investment or transferring a liability in an orderly transaction to an independent buyer in the principal or most advantageous market for the investment. U.S.
GAAP establishes the three-tier hierarchy which is used to maximize the use of observable market data and minimize the use of unobservable inputs and to establish classification of fair value measurements for disclosure purposes. Observable inputs
reflect the assumptions market participants would use in pricing the asset or liability. Observable inputs are based on market data obtained from sources independent of the reporting entity. Unobservable inputs reflect management’s assumptions
about the assumptions market participants would use in pricing the asset or liability. Unobservable inputs are based on the best information available in the circumstances. The following is a summary of the three-tiered hierarchy of valuation input
levels.
|
|
|
| Level 1 – |
|
Inputs are unadjusted and prices are determined using quoted prices in active markets for identical securities. |
|
|
| Level 2 – |
|
Prices are determined using other significant observable inputs (including quoted prices for similar securities, interest rates, credit spreads, etc.). |
|
|
| Level 3 – |
|
Prices are determined using significant unobservable inputs (including management’s assumptions in determining the fair value of investments). |
A description of the valuation techniques applied to the Funds’ major classifications of assets and liabilities measured at fair
value follows:
Equity securities and exchange-traded funds listed or traded on a national market or exchange are valued based on their last reported sales price
or official closing price of such market or exchange on the valuation date. Foreign equity securities and registered investment companies that trade on a foreign exchange are valued at the last reported sales price or official closing
price on the principal exchange where traded, and converted to U.S. dollars at the prevailing rates of exchange on the valuation date. For events affecting the value of foreign securities between the time when the exchange on which
they are traded closes and the time when the Funds’ net assets are calculated, such securities will be valued at fair value in accordance with procedures adopted by the Adviser, subject to the oversight of the Board. To the extent these
securities are actively traded and no valuation adjustments are applied, they are generally classified as Level 1. When valuation adjustments are applied to the most recent last sales price or official closing price, these securities are
generally classified as Level 2.
Prices of certain American Depositary Receipts (“ADR”) held by the Funds that trade in the United States are valued
based on the last traded price, official closing price, or an evaluated price provided by the pricing services and are generally classified as Level 1 or 2.
Purchased and written options traded and listed on a national market or exchange are valued at the mean of the closing bid and asked prices and are generally classified
as Level 1.
Over-the-counter (“OTC”) options are marked-to-market daily based upon a price supplied by a pricing service. OTC options are generally classified as Level 2.
Investments in investment companies are valued at their respective NAVs or share price on the valuation date and are generally classified as Level 1.
Repurchase agreements are valued at contract amount plus accrued interest, which approximates market value. These securities are generally classified as Level 2.
For any portfolio security or derivative for which market quotations are not readily available or for which the Adviser deems the valuations derived using the
valuation procedures described above not to reflect fair value, the Adviser will determine a fair value in good faith using alternative procedures approved by the Adviser, subject to the oversight of the Board. As a general principle, the fair value
of a security is the amount that the owner might reasonably expect to receive for it in a current sale. A variety of factors may be considered in determining the fair value of such securities, which may include consideration of the following: yields
or prices of investments of comparable quality, type of issue, coupon, maturity and rating, market quotes or indications of value from security dealers, evaluations of anticipated cash flows or collateral, general market conditions and other
information and analysis, including the obligor’s credit characteristics considered relevant. To the extent the inputs are observable and timely, the values would be classified as Level 2; otherwise they would be classified as
Level 3.
76
The following table summarizes the market value of the Funds’ investments as of the end of the reporting period,
based on the inputs used to value them:
|
|
|
|
|
|
|
|
|
|
|
|
|
|
|
|
|
| BXMX |
|
Level 1 |
|
|
Level 2 |
|
|
Level 3 |
|
|
Total |
|
| |
|
| Long-Term Investments: |
|
|
|
|
|
|
|
|
|
|
|
|
|
|
|
|
| Common Stocks |
|
$ |
1,445,759,666 |
|
|
$ |
– |
|
|
$ |
– |
|
|
$ |
1,445,759,666 |
|
| Investments Purchased with Collateral from Securities Lending |
|
|
571,823 |
|
|
|
– |
|
|
|
– |
|
|
|
571,823 |
|
| Short-Term Investments: |
|
|
|
|
|
|
|
|
|
|
|
|
|
|
|
|
| Repurchase Agreements |
|
|
– |
|
|
|
62,475,000 |
|
|
|
– |
|
|
|
62,475,000 |
|
| Investments in Derivatives: |
|
|
|
|
|
|
|
|
|
|
|
|
|
|
|
|
| Options Written |
|
|
(29,372,135) |
|
|
|
– |
|
|
|
– |
|
|
|
(29,372,135) |
|
| |
|
| Total |
|
$ |
1,416,959,354 |
|
|
$ |
62,475,000 |
|
|
$ |
– |
|
|
$ |
1,479,434,354 |
|
| |
|
|
|
|
|
|
| DIAX |
|
Level 1 |
|
|
Level 2 |
|
|
Level 3 |
|
|
Total |
|
| |
|
| Long-Term Investments: |
|
|
|
|
|
|
|
|
|
|
|
|
|
|
|
|
| Common Stocks |
|
$ |
587,934,534 |
|
|
$ |
– |
|
|
$ |
– |
|
|
$ |
587,934,534 |
|
| Exchange-Traded Funds |
|
|
7,446,881 |
|
|
|
– |
|
|
|
– |
|
|
|
7,446,881 |
|
| Options Purchased |
|
|
4,463 |
|
|
|
– |
|
|
|
– |
|
|
|
4,463 |
|
| Investments Purchased with Collateral from Securities Lending |
|
|
910,821 |
|
|
|
– |
|
|
|
– |
|
|
|
910,821 |
|
| Short-Term Investments: |
|
|
|
|
|
|
|
|
|
|
|
|
|
|
|
|
| Repurchase Agreements |
|
|
– |
|
|
|
1,028,999 |
|
|
|
– |
|
|
|
1,028,999 |
|
| Investments in Derivatives: |
|
|
|
|
|
|
|
|
|
|
|
|
|
|
|
|
| Options Written |
|
|
(6,326,250) |
|
|
|
– |
|
|
|
– |
|
|
|
(6,326,250) |
|
| |
|
| Total |
|
$ |
589,970,449 |
|
|
$ |
1,028,999 |
|
|
$ |
– |
|
|
$ |
590,999,448 |
|
| |
|
|
|
|
|
|
| SPXX |
|
Level 1 |
|
|
Level 2 |
|
|
Level 3 |
|
|
Total |
|
| |
|
| Long-Term Investments: |
|
|
|
|
|
|
|
|
|
|
|
|
|
|
|
|
| Common Stocks |
|
$ |
290,715,238 |
|
|
$ |
– |
|
|
$ |
– |
|
|
$ |
290,715,238 |
|
| Exchange-Traded Funds |
|
|
4,344,171 |
|
|
|
– |
|
|
|
– |
|
|
|
4,344,171 |
|
| Options Purchased |
|
|
2,168 |
|
|
|
– |
|
|
|
– |
|
|
|
2,168 |
|
| Investments Purchased with Collateral from Securities Lending |
|
|
2,933,198 |
|
|
|
– |
|
|
|
– |
|
|
|
2,933,198 |
|
| Short-Term Investments: |
|
|
|
|
|
|
|
|
|
|
|
|
|
|
|
|
| Repurchase Agreements |
|
|
– |
|
|
|
543,866 |
|
|
|
– |
|
|
|
543,866 |
|
| Investments in Derivatives: |
|
|
|
|
|
|
|
|
|
|
|
|
|
|
|
|
| Options Written |
|
|
(3,161,320) |
|
|
|
– |
|
|
|
– |
|
|
|
(3,161,320) |
|
| |
|
| Total |
|
$ |
294,833,455 |
|
|
$ |
543,866 |
|
|
$ |
– |
|
|
$ |
295,377,321 |
|
| |
|
|
|
|
|
|
| QQQX |
|
Level 1 |
|
|
Level 2 |
|
|
Level 3 |
|
|
Total |
|
| |
|
| Long-Term Investments: |
|
|
|
|
|
|
|
|
|
|
|
|
|
|
|
|
| Common Stocks |
|
$ |
1,205,116,253 |
|
|
$ |
– |
|
|
$ |
– |
|
|
$ |
1,205,116,253 |
|
| Exchange-Traded Funds |
|
|
13,758,760 |
|
|
|
– |
|
|
|
– |
|
|
|
13,758,760 |
|
| Options Purchased |
|
|
8,925 |
|
|
|
– |
|
|
|
– |
|
|
|
8,925 |
|
| Investments Purchased with Collateral from Securities Lending |
|
|
1,542,799 |
|
|
|
– |
|
|
|
– |
|
|
|
1,542,799 |
|
| Short-Term Investments: |
|
|
|
|
|
|
|
|
|
|
|
|
|
|
|
|
| Repurchase Agreements |
|
|
– |
|
|
|
1,609,514 |
|
|
|
– |
|
|
|
1,609,514 |
|
| Investments in Derivatives: |
|
|
|
|
|
|
|
|
|
|
|
|
|
|
|
|
| Options Written |
|
|
(14,640,925) |
|
|
|
– |
|
|
|
– |
|
|
|
(14,640,925) |
|
| |
|
| Total |
|
$ |
1,205,785,812 |
|
|
$ |
1,609,514 |
|
|
$ |
– |
|
|
$ |
1,207,395,326 |
|
| |
|
77
Notes to Financial Statements (continued)
|
|
|
|
|
|
|
|
|
|
|
|
|
|
|
|
|
| JCE |
|
Level 1 |
|
|
Level 2 |
|
|
Level 3 |
|
|
Total |
|
| |
|
| Long-Term Investments: |
|
|
|
|
|
|
|
|
|
|
|
|
|
|
|
|
| Common Stocks |
|
$ |
212,795,418 |
|
|
$ |
– |
|
|
$ |
– |
|
|
$ |
212,795,418 |
|
| Exchange-Traded Funds |
|
|
1,091,385 |
|
|
|
– |
|
|
|
– |
|
|
|
1,091,385 |
|
| Options Purchased |
|
|
1,020 |
|
|
|
– |
|
|
|
– |
|
|
|
1,020 |
|
| Short-Term Investments: |
|
|
|
|
|
|
|
|
|
|
|
|
|
|
|
|
| Repurchase Agreements |
|
|
– |
|
|
|
352,017 |
|
|
|
– |
|
|
|
352,017 |
|
| Investments in Derivatives: |
|
|
|
|
|
|
|
|
|
|
|
|
|
|
|
|
| Options Written |
|
|
(514,200) |
|
|
|
– |
|
|
|
– |
|
|
|
(514,200) |
|
| |
|
| Total |
|
$ |
213,373,623 |
|
|
$ |
352,017 |
|
|
$ |
– |
|
|
$ |
213,725,640 |
|
| |
|
Repurchase Agreements: In connection with transactions in repurchase agreements, it is each Fund’s policy that its custodian take possession of the underlying
collateral securities, the fair value of which exceeds the principal amount of the repurchase transaction, including accrued interest, at all times. If the counterparty defaults, and the fair value of the collateral declines, realization of the
collateral may be delayed or limited.
The following table presents the repurchase agreements for the Funds that are subject to netting agreements as of the end of
the reporting period, and the collateral delivered related to those repurchase agreements.
|
|
|
|
|
|
|
|
|
|
|
| Fund |
|
Counterparty |
|
Short-term
Investments, at Value |
|
|
Collateral
Pledged (From) Counterparty |
|
| |
|
| BXMX |
|
Fixed Income Clearing Corporation |
|
$ |
62,475,000 |
|
|
$ |
63,724,519 |
|
| DIAX |
|
Fixed Income Clearing Corporation |
|
|
1,028,999 |
|
|
|
1,049,636 |
|
| SPXX |
|
Fixed Income Clearing Corporation |
|
|
543,866 |
|
|
|
554,747 |
|
| QQQX |
|
Fixed Income Clearing Corporation |
|
|
1,609,514 |
|
|
|
1,641,759 |
|
| JCE |
|
Fixed Income Clearing Corporation |
|
|
352,017 |
|
|
|
359,059 |
|
| |
|
Securities Lending: Each Fund may lend securities representing up to one-third of the
value of its total assets to broker-dealers, banks, and other institutions in order to generate additional income. When loaning securities, a Fund retains the benefits of owning the securities, including the economic equivalent of dividends or
interest generated by the security. The loans are continuous, can be recalled at any time, and have no set maturity. The Funds’ custodian, State Street Bank and Trust Company, serves as the securities lending agent (the “Agent”).
When a Fund loans its portfolio securities, it will receive, at the inception of each loan, cash collateral equal to an amount not less than 100% of the market value of
the loaned securities. The actual percentage of the cash collateral will vary depending upon the asset type of the loaned securities. Collateral for the loaned securities is invested in a government money market vehicle maintained by the Agent,
which is subject to the requirements of Rule 2a-7 under the 1940 Act. The value of the loaned securities and the liability to return the cash collateral received are recognized on the Statement of Assets and
Liabilities. If the market value of the loaned securities increases, the borrower must furnish additional collateral to the Fund, which is also recognized on the Statement of Assets and Liabilities. Securities out on loan are subject to termination
at any time at the option of the borrower or the Fund. Upon termination, the borrower is required to return to the Fund securities identical to the securities loaned. During the term of the loan, the Fund bears the market risk with respect to the
investment of collateral and the risk that the Agent may default on its contractual obligations to the Fund. The Agent bears the risk that the borrower may default on its obligation to return the loaned securities as the Agent is contractually
obligated to indemnify the Fund if at the time of a default by a borrower some or all of the loan securities have not been returned.
Securities lending income
recognized by a Fund consists of earnings on invested collateral and lending fees, net of any rebates to the borrower and compensation to the Agent. Such income is recognized on the Statement of Operations.
As of the end of the current reporting period, the total value of the loaned securities and the total value of collateral received were as follows:
|
|
|
|
|
|
|
|
|
|
|
| Fund |
|
Asset Class out on Loan |
|
Long-Term
Investments, at Value |
|
|
Total Collateral
Received |
|
| |
|
| BXMX |
|
Common Stocks |
|
|
$ 542,055 |
|
|
|
$ 571,823 |
|
| DIAX |
|
Exchange-Traded Funds |
|
|
880,798 |
|
|
|
910,821 |
|
| |
|
| SPXX |
|
Common Stocks |
|
|
223,228 |
|
|
|
239,057 |
|
|
|
Exchange-Traded Funds |
|
|
2,630,058 |
|
|
|
2,694,141 |
|
| |
|
| Total |
|
|
|
|
2,853,286 |
|
|
|
2,933,198 |
|
| |
|
| QQQX |
|
Common Stocks |
|
|
1,418,741 |
|
|
|
1,542,799 |
|
| |
|
Purchases and Sales: Long-term purchases and sales during the current fiscal period were as follows:
78
|
|
|
|
|
|
|
|
|
| Fund |
|
Non-U.S.
Government
Purchases |
|
|
Non-U.S.
Government
Sales |
|
| |
|
| BXMX |
|
$ |
220,300,183 |
|
|
$ |
400,469,923 |
|
| DIAX |
|
|
70,893,666 |
|
|
|
143,885,185 |
|
| SPXX |
|
|
59,096,670 |
|
|
|
96,534,872 |
|
| QQQX |
|
|
393,086,804 |
|
|
|
597,299,756 |
|
| JCE |
|
|
217,072,222 |
|
|
|
239,532,012 |
|
| |
|
The Funds may purchase securities on a when-issued or delayed-delivery basis. Securities purchased on a when-issued or delayed-delivery
basis may have extended settlement periods; interest income is not accrued until settlement date. Any securities so purchased are subject to market fluctuation during this period. If a Fund has outstanding when-issued/delayed-delivery purchases
commitments as of the end of the reporting period, such amounts are recognized on the Statement of Assets and Liabilities.
| 5. |
Derivative Investments |
Each Fund is authorized to invest in certain derivative instruments. As defined by U.S. GAAP, a derivative is a financial instrument whose value is derived from an
underlying security price, foreign exchange rate, interest rate, index of prices or rates, or other variables. Investments in derivatives as of the end of and/or during the current fiscal period, if any, are included within the Statement of Assets
and Liabilities and the Statement of Operations, respectively.
Options Transactions: The Funds may purchase (buy) or write (sell) put and call options on
specific securities (including groups or “baskets” of specific securities), interest rates, stock indices and/or bond indices (each a “financial instrument”). Options can be settled either directly with the counterparty (over the
counter) or through a central clearing house (exchange traded). Call and put options give the holder the right, in return for a premium paid, to purchase or sell, respectively, a financial instrument at a specified exercise price at any time during
the period of the option.
When a Fund purchases an option, an amount equal to the premium paid (the premium plus commission) is recognized as an asset on the
Statement of Asset and Liabilities. When a Fund writes an option, an amount equal to the net premium received (the premium less commission) is recognized as a liability on the Statement of Assets and Liabilities and is subsequently adjusted to
reflect the current value of the written option until the option is exercised or expires or the Fund enters into a closing purchase transaction. The changes in the value of options purchased and/or written during the fiscal period are recognized as
in unrealized appreciation (depreciation) on the Statement of Operations. When an option expires, the premiums received or paid are recognized as realized gains or losses on the Statement of Operations. When an option is exercised or a closing
purchase transaction is entered into, the difference between the premium and the amount received or paid in a closing transaction is recognized as a realized gain or loss on the Statement of Operations.
The market risk associated with purchasing options is limited to the premium paid. The Fund, as writer of an option, has no control over whether the underlying instrument
may be sold (called) or purchased (put) and as a result bears the risk of an unfavorable change in the market value of the instrument underlying the written option. There is also the risk the Fund may not be able to enter into a closing transaction
because of an illiquid market.
During the current fiscal period, BXMX wrote call options on equity indices as per its stated strategy, with the notional amount of
these options averaging 99% of the Fund’s assets.
During the current fiscal period, DIAX, SPXX, QQQX and JCE, each wrote call options on equity indices as per
its stated dynamic overwriting strategy with the notional amounts of these options ranging from approximately 35-75% of each Fund’s assets. DIAX, SPXX and QQQX also purchased put and call options as part
of their overwrite strategy.
The average notional amount of outstanding options purchased during the current fiscal period, was as follows:
|
|
|
|
|
| Fund |
|
Average Notional Amount of Purchased
Options Contracts Outstanding* |
|
| |
|
| DIAX |
|
|
$8,979,000 |
|
| SPXX |
|
|
2,115,000 |
|
| QQQX |
|
|
7,269,000 |
|
| JCE |
|
|
743,900 |
|
| |
|
| * |
The average notional amount is calculated based on the outstanding notional amount of contracts at the beginning of the
current fiscal period and at the end of each fiscal quarter within the current fiscal period. |
The average notional amount of outstanding options
written during the current fiscal period, was as follows:
79
Notes to Financial Statements (continued)
|
|
|
| Fund |
|
Average Notional Amount of Written Options
Contracts Outstanding* |
| |
| BXMX |
|
$(1,392,310,500) |
| DIAX |
|
(288,541,000) |
| SPXX |
|
(138,619,500) |
| QQQX |
|
(551,705,200) |
| JCE |
|
(56,520,000) |
| |
| * |
The average notional amount is calculated based on the outstanding notional amount of contracts at the beginning of the
current fiscal period and at the end of each fiscal quarter within the current fiscal period. |
As of the end of the reporting period, the
following Funds have invested in derivative contracts which are reflected in the Statement of Assets and Liabilities as follows:
|
|
|
|
|
|
|
|
|
|
|
|
|
| |
|
|
|
Asset Derivatives |
|
|
|
Liability Derivatives |
|
|
|
|
|
|
|
|
|
| Derivative Instrument |
|
Risk Exposure |
|
Location |
|
Value |
|
|
|
Location |
|
Value |
| |
|
|
|
|
| BXMX |
|
|
|
|
|
|
|
|
|
|
|
|
| Options Written |
|
Equity |
|
– |
|
$– |
|
|
|
Options written, at
value |
|
$ (29,372,135) |
| |
|
|
|
|
|
|
|
| DIAX |
|
|
|
|
|
|
|
|
|
|
|
|
| Options Purchased |
|
Equity |
|
Long–term
investments, at
value |
|
4,463 |
|
|
|
– |
|
|
| Options Written |
|
Equity |
|
– |
|
– |
|
|
|
Options written, at
value |
|
(6,326,250) |
| |
|
|
|
|
|
|
|
| SPXX |
|
|
|
|
|
|
|
|
|
|
|
|
| Options Purchased |
|
Equity |
|
Long–term
investments, at
value |
|
2,168 |
|
|
|
– |
|
|
| Options Written |
|
Equity |
|
– |
|
– |
|
|
|
Options written, at
value |
|
(3,161,320) |
| |
|
|
|
|
|
|
|
| QQQX |
|
|
|
|
|
|
|
|
|
|
|
|
| Options Purchased |
|
Equity |
|
Long–term
investments, at
value |
|
8,925 |
|
|
|
– |
|
|
| Options Written |
|
Equity |
|
– |
|
– |
|
|
|
Options written, at
value |
|
(14,640,925) |
| |
|
|
|
|
|
|
|
| JCE |
|
|
|
|
|
|
|
|
|
|
|
|
| Options Purchased |
|
Equity |
|
Long–term
investments, at
value |
|
1,020 |
|
|
|
– |
|
|
| Options Written |
|
Equity |
|
– |
|
– |
|
|
|
Options written, at
value |
|
(514,200) |
| |
During the current fiscal period, the effect of derivative contracts on the Funds’ Statement of Operations was as follows:
80
|
|
|
|
|
|
|
|
|
|
|
|
|
|
|
| Derivative Instrument |
|
Risk Exposure |
|
|
|
|
Net Realized Gain
(Loss) |
|
|
Change in
Unrealized Appreciation
(Depreciation) |
|
| |
|
|
|
|
|
|
| BXMX |
|
|
|
|
|
|
|
|
|
|
|
|
|
|
| Written options |
|
Equity |
|
|
|
|
|
|
$(64,188,719) |
|
|
|
$(26,901,319) |
|
| |
|
|
|
|
|
|
| DIAX |
|
|
|
|
|
|
|
|
|
|
|
|
|
|
| Purchased options |
|
Equity |
|
|
|
|
|
|
(83,569) |
|
|
|
8,193 |
|
| Written options |
|
Equity |
|
|
|
|
|
|
(36,025,816) |
|
|
|
(4,664,741) |
|
| |
|
|
|
|
|
|
| SPXX |
|
|
|
|
|
|
|
|
|
|
|
|
|
|
| Purchased options |
|
Equity |
|
|
|
|
|
|
(39,347) |
|
|
|
4,229 |
|
| Written options |
|
Equity |
|
|
|
|
|
|
(17,718,688) |
|
|
|
(2,252,036) |
|
| |
|
|
|
|
|
|
| QQQX |
|
|
|
|
|
|
|
|
|
|
|
|
|
|
| Purchased options |
|
Equity |
|
|
|
|
|
|
(78,401) |
|
|
|
(1,077) |
|
| Written options |
|
Equity |
|
|
|
|
|
|
(127,634,999) |
|
|
|
(13,045,299) |
|
| |
|
|
|
|
|
|
| JCE |
|
|
|
|
|
|
|
|
|
|
|
|
|
|
| Purchased options |
|
Equity |
|
|
|
|
|
|
– |
|
|
|
(2,119) |
|
| Written options |
|
Equity |
|
|
|
|
|
|
(3,443,165) |
|
|
|
(651,805) |
|
| |
|
Market and Counterparty Credit Risk: In the normal course of business each Fund may invest in financial instruments and enter into
financial transactions where risk of potential loss exists due to changes in the market (market risk) or failure of the other party to the transaction to perform (counterparty credit risk). The potential loss could exceed the value of the financial
assets recorded on the financial statements. Financial assets, which potentially expose each Fund to counterparty credit risk, consist principally of cash due from counterparties on forward, option and swap transactions, when applicable. The extent
of each Fund’s exposure to counterparty credit risk in respect to these financial assets approximates their carrying value as recorded on the Statement of Assets and Liabilities.
Each Fund helps manage counterparty credit risk by entering into agreements only with counterparties the Adviser believes have the financial resources to honor their
obligations and by having the Adviser monitor the financial stability of the counterparties. Additionally, counterparties may be required to pledge collateral daily (based on the daily valuation of the financial asset) on behalf of each Fund with a
value approximately equal to the amount of any unrealized gain above a pre-determined threshold. Reciprocally, when each Fund has an unrealized loss, the Funds have instructed the custodian to pledge assets of the Funds as collateral with a value
approximately equal to the amount of the unrealized loss above a pre-determined threshold. Collateral pledges are monitored and subsequently adjusted if and when the valuations fluctuate, either up or down, by at least the pre-determined threshold
amount.
Common Shares Equity Shelf Programs and Offering Costs: The following Funds have filed a registration statement with the Securities and Exchange Commission
(“SEC”) authorizing each Fund to issue additional common shares through one or more equity shelf programs (“Shelf Offering”), which became effective with the SEC during prior fiscal periods.
Under this Shelf Offering, the Funds, subject to market conditions, may raise additional equity capital by issuing additional common shares from time to time in varying
amounts and by different offering methods at a net price at or above each Fund’s NAV per common share. In the event the Fund’s Shelf Offering registration statement is no longer current, the Fund may not issue additional common shares
until a post-effective amendment to the registration statement has been filed with the SEC.
Additional authorized common shares, common shares sold and offering
proceeds, net of offering costs under each Fund’s Shelf Offering during the Funds’ current and prior fiscal period were as follows:
|
|
|
|
|
|
|
|
|
|
|
|
|
|
|
|
|
| |
|
SPXX |
|
|
QQQX |
|
|
|
|
|
|
| |
|
Year Ended
12/31/23 |
|
|
Year Ended
12/31/22 |
|
|
Year Ended
12/31/23 |
|
|
Year Ended
12/31/22 |
|
| |
|
| Maximum aggregate offering |
|
|
$4,993,317 |
|
|
|
$4,993,317 |
|
|
|
Unlimited |
|
|
|
$– |
|
| Common shares sold |
|
|
– |
|
|
|
639,749 |
|
|
|
297,524 |
|
|
|
3,280,964 |
|
| Offering proceeds, net of offering costs |
|
|
$(7,370) |
|
|
|
$10,181,265 |
|
|
|
$7,390,865 |
|
|
|
$81,420,803 |
|
| |
|
81
Notes to Financial Statements (continued)
Costs incurred by the Funds in connection with their initial shelf registrations are recorded as a prepaid expense
and recognized as “Deferred offering costs” on the Statement of Assets and Liabilities. These costs are amortized pro rata as common shares are sold and are recognized as a component of “Proceeds from shelf offering, net of offering
costs” on the Statement of Changes in Net Assets. Any deferred offering costs remaining after the effectiveness of the initial shelf registration will be expensed. Costs incurred by the Fund to keep the shelf registration current are expensed
as incurred and recognized as a component of “Other expenses” on the Statement of Operations.
Common Share Transactions: Transactions
in common shares for the Funds during the Funds’ current and prior fiscal period, where applicable, were as follows:
|
|
|
|
|
|
|
|
|
|
|
|
|
|
|
|
|
| |
|
BXMX |
|
|
SPXX |
|
|
|
|
|
|
|
|
|
|
| |
|
Year Ended
12/31/23 |
|
|
Year Ended
12/31/22 |
|
|
Year Ended
12/31/23 |
|
|
Year Ended
12/31/22 |
|
| |
|
| Common Shares: |
|
|
|
|
|
|
|
|
|
|
|
|
|
|
|
|
| Sold through shelf offering |
|
|
– |
|
|
|
– |
|
|
|
– |
|
|
|
639,749 |
|
| Issued to shareholders due to reinvestment of distributions |
|
|
78,449 |
|
|
|
– |
|
|
|
8,862 |
|
|
|
14,838 |
|
| |
|
| Total |
|
|
78,449 |
|
|
|
– |
|
|
|
8,862 |
|
|
|
654,587 |
|
| |
|
| Weighted average common share: |
|
|
|
|
|
|
|
|
|
|
|
|
|
|
|
|
| Premium to NAV per shelf offering common share sold |
|
|
–% |
|
|
|
–% |
|
|
|
–% |
|
|
|
1.77% |
|
| |
|
|
|
|
| |
|
QQQX |
|
|
JCE |
|
|
|
|
|
|
|
|
|
|
| |
|
Year Ended
12/31/23 |
|
|
Year Ended
12/31/22 |
|
|
Year Ended
12/31/23 |
|
|
Year Ended
12/31/22 |
|
| |
|
| Common Shares: |
|
|
|
|
|
|
|
|
|
|
|
|
|
|
|
|
| Sold through shelf offering |
|
|
297,524 |
|
|
|
3,280,964 |
|
|
|
– |
|
|
|
– |
|
| Issued to shareholders due to reinvestment of distributions |
|
|
91,486 |
|
|
|
109,290 |
|
|
|
11,591 |
|
|
|
25,025 |
|
| |
|
| Total |
|
|
389,010 |
|
|
|
3,390,254 |
|
|
|
11,591 |
|
|
|
25,025 |
|
| |
|
| Weighted average common share: |
|
|
|
|
|
|
|
|
|
|
|
|
|
|
|
|
| Premium to NAV per shelf offering common share sold |
|
|
3.84% |
|
|
|
2.37% |
|
|
|
–% |
|
|
|
–% |
|
| |
|
| 7. |
Income Tax Information |
Each Fund is a separate taxpayer for federal income tax purposes. Each Fund intends to distribute substantially all of its net investment income and net capital gains to
shareholders and otherwise comply with the requirements of Subchapter M of the Internal Revenue Code applicable to regulated investment companies. Therefore, no federal income tax provision is required.
Each Fund files income tax returns in U.S. federal and applicable state and local jurisdictions. A Fund’s federal income tax returns are generally subject to
examination for a period of three fiscal years after being filed. State and local tax returns may be subject to examination for an additional period of time depending on the jurisdiction. Management has analyzed each Fund’s tax positions taken
for all open tax years and has concluded that no provision for income tax is required in the Fund’s financial statements.
Differences between amounts for
financial statement and federal income tax purposes are primarily due to timing differences in recognizing gains and losses on investment transactions. Temporary differences do not require reclassification. As of year end, permanent differences that
resulted in reclassifications among the components of net assets relate primarily to distribution reallocations, foreign currency transactions, investments in partnerships, net operating losses, and return of capital and long–term capital gain
distributions received from portfolio investments. Temporary and permanent differences have no impact on a Fund’s net assets.
As of year end, the aggregate
cost and the net unrealized appreciation/(depreciation) of all investments for federal income tax purposes were as follows:
|
|
|
|
|
|
|
|
|
|
|
|
|
|
|
|
|
| Fund |
|
Tax Cost |
|
|
Gross Unrealized
Appreciation |
|
|
Gross
Unrealized
(Depreciation) |
|
|
Net
Unrealized Appreciation
(Depreciation) |
|
| BXMX |
|
$ |
506,844,858 |
|
|
$ |
976,451,217 |
|
|
$ |
(3,861,721 |
) |
|
$ |
972,589,496 |
|
| DIAX |
|
|
215,858,378 |
|
|
|
380,448,871 |
|
|
|
(5,307,801 |
) |
|
|
375,141,070 |
|
| SPXX |
|
|
120,730,003 |
|
|
|
178,308,645 |
|
|
|
(3,661,327 |
) |
|
|
174,647,318 |
|
| QQQX |
|
|
418,598,485 |
|
|
|
801,271,236 |
|
|
|
(12,474,394 |
) |
|
|
788,796,842 |
|
| JCE |
|
|
168,644,323 |
|
|
|
47,574,646 |
|
|
|
(2,493,329 |
) |
|
|
45,081,317 |
|
82
For purposes of this disclosure, tax cost generally includes the cost of portfolio investments as well as up-front fees
or premiums exchanged on derivatives and any amounts unrealized for income statement reporting but realized income and/or capital gains for tax reporting, if applicable.
As of year end, the components of accumulated earnings on a tax basis were as follows:
|
|
|
|
|
|
|
|
|
|
|
|
|
|
|
|
|
|
|
|
|
|
|
|
|
|
|
|
|
| Fund |
|
Undistributed
Ordinary Income |
|
|
Undistributed
Long-Term Capital Gains |
|
|
Unrealized
Appreciation (Depreciation) |
|
|
Capital Loss
Carryforwards |
|
|
Late-Year Loss
Deferrals |
|
|
Other
Book-to-Tax
Differences |
|
|
Total |
|
|
|
|
|
|
|
|
|
| BXMX |
|
$ |
– |
|
|
$ |
– |
|
|
$ |
972,589,753 |
|
|
$ |
(19,889,938 |
) |
|
$ |
– |
|
|
$ |
– |
|
|
$ |
952,699,815 |
|
|
|
|
|
|
|
|
|
| DIAX |
|
|
– |
|
|
|
– |
|
|
|
375,141,070 |
|
|
|
– |
|
|
|
– |
|
|
|
– |
|
|
|
375,141,070 |
|
|
|
|
|
|
|
|
|
| SPXX |
|
|
– |
|
|
|
– |
|
|
|
174,647,318 |
|
|
|
– |
|
|
|
– |
|
|
|
– |
|
|
|
174,647,318 |
|
|
|
|
|
|
|
|
|
| QQQX |
|
|
– |
|
|
|
– |
|
|
|
788,796,842 |
|
|
|
– |
|
|
|
– |
|
|
|
– |
|
|
|
788,796,842 |
|
|
|
|
|
|
|
|
|
| JCE |
|
|
– |
|
|
|
– |
|
|
|
45,081,317 |
|
|
|
– |
|
|
|
– |
|
|
|
(41,345 |
) |
|
|
45,039,972 |
|
The tax character of
distributions paid was as follows:
|
|
|
|
|
|
|
|
|
|
|
|
|
|
|
|
|
|
|
|
|
|
|
|
|
| |
|
12/31/23 |
|
|
12/31/22 |
|
| Fund |
|
Ordinary
Income |
|
|
Long-Term
Capital Gains |
|
|
Return
of Capital |
|
|
Ordinary
Income |
|
|
Long-Term
Capital Gains |
|
|
Return
of Capital |
|
|
|
|
|
|
|
|
| BXMX |
|
$ |
30,129,140 |
|
|
$ |
41,451,927 |
|
|
$ |
26,959,293 |
|
|
$ |
37,065,603 |
|
|
$ |
61,400,545 |
|
|
$ |
– |
|
|
|
|
|
|
|
|
| DIAX |
|
|
7,202,799 |
|
|
|
3,462,843 |
|
|
|
31,039,934 |
|
|
|
17,416,496 |
|
|
|
22,929,386 |
|
|
|
1,359,694 |
|
|
|
|
|
|
|
|
| SPXX |
|
|
2,037,532 |
|
|
|
11,285,738 |
|
|
|
7,797,715 |
|
|
|
2,223,255 |
|
|
|
18,532,859 |
|
|
|
– |
|
|
|
|
|
|
|
|
| QQQX |
|
|
5,025,099 |
|
|
|
54,256,301 |
|
|
|
22,507,046 |
|
|
|
18,109,243 |
|
|
|
75,075,333 |
|
|
|
– |
|
|
|
|
|
|
|
|
| JCE |
|
|
1,015,219 |
|
|
|
279,670 |
|
|
|
19,292,910 |
|
|
|
27,672,785 |
|
|
|
4,996,444 |
|
|
|
4,773,720 |
|
As of year end, the Funds had
capital loss carryforwards, which will not expire:
|
|
|
|
|
|
|
|
|
|
|
|
|
| Fund |
|
Short-Term |
|
|
Long-Term |
|
|
Total |
|
|
|
|
|
| BXMX |
|
$ |
19,889,938 |
|
|
$ |
– |
|
|
$ |
19,889,938 |
|
|
|
|
|
| DIAX |
|
|
– |
|
|
|
– |
|
|
|
– |
|
|
|
|
|
| SPXX |
|
|
– |
|
|
|
– |
|
|
|
– |
|
|
|
|
|
| QQQX |
|
|
– |
|
|
|
– |
|
|
|
– |
|
|
|
|
|
| JCE |
|
|
– |
|
|
|
– |
|
|
|
– |
|
As of year end, the Funds utilized
the following capital loss carryforwards:
|
|
|
|
|
| Fund |
|
Utilized |
|
|
|
| BXMX |
|
$ |
– |
|
|
|
| DIAX |
|
|
– |
|
|
|
| SPXX |
|
|
– |
|
|
|
| QQQX |
|
|
– |
|
|
|
| JCE |
|
|
1,485,191 |
|
| 8. |
Management Fees and Other Transactions with Affiliates |
The management fee compensates the Adviser for overall investment advisory and administrative services and general office facilities. Gateway and NAM are compensated for
their services to the Funds from the management fees paid to the Adviser.
Each Fund’s management fee consists of two components – a fund-level fee, based
only on the amount of assets within each individual Fund, and a complex-level fee, based on the aggregate amount of all eligible fund assets managed by the Adviser. This pricing structure enables Fund shareholders to benefit from growth in the
assets within their respective Fund as well as from growth in the amount of complex-wide assets managed by the Adviser.
The annual fund-level fee, payable monthly,
for each Fund is calculated according to the following schedules:
83
Notes to Financial Statements (continued)
|
|
|
|
|
|
|
|
|
|
|
|
|
|
|
|
|
|
|
|
|
| Average Daily Managed Assets* |
|
BXMX |
|
|
DIAX |
|
|
SPXX |
|
|
QQQX |
|
|
JCE |
|
| For the first $500 million |
|
|
0.7000 |
% |
|
|
0.7000 |
% |
|
|
0.6600 |
% |
|
|
0.6900 |
% |
|
|
0.7500 |
% |
| For the next $500 million |
|
|
0.6750 |
|
|
|
0.6750 |
|
|
|
0.6350 |
|
|
|
0.6650 |
|
|
|
0.7250 |
|
| For the next $500 million |
|
|
0.6500 |
|
|
|
0.6500 |
|
|
|
0.6100 |
|
|
|
0.6400 |
|
|
|
0.7000 |
|
| For the next $500 million |
|
|
0.6250 |
|
|
|
0.6250 |
|
|
|
0.5850 |
|
|
|
0.6150 |
|
|
|
0.6750 |
|
| For managed assets over $2 billion |
|
|
0.6000 |
|
|
|
0.6000 |
|
|
|
0.5600 |
|
|
|
0.5900 |
|
|
|
0.6500 |
|
The annual complex-level fee, payable monthly, for each Fund is calculated by multiplying the current complex-wide fee rate, determined
according to the following schedule by the Funds’ daily managed assets:
|
|
|
|
|
| Complex-Level Eligible Asset Breakpoint Level* |
|
Effective Complex-Level Fee Rate at Breakpoint Level |
|
| $55 billion |
|
|
0.2000 |
% |
| $56 billion |
|
|
0.1996 |
|
| $57 billion |
|
|
0.1989 |
|
| $60 billion |
|
|
0.1961 |
|
| $63 billion |
|
|
0.1931 |
|
| $66 billion |
|
|
0.1900 |
|
| $71 billion |
|
|
0.1851 |
|
| $76 billion |
|
|
0.1806 |
|
| $80 billion |
|
|
0.1773 |
|
| $91 billion |
|
|
0.1691 |
|
| $125 billion |
|
|
0.1599 |
|
| $200 billion |
|
|
0.1505 |
|
| $250 billion |
|
|
0.1469 |
|
| $300 billion |
|
|
0.1445 |
|
| * |
For the complex-level fees, managed assets include closed-end fund assets managed by the Adviser that are attributable to
certain types of leverage. For these purposes, leverage includes the funds’ use of preferred stock and borrowings and certain investments in the residual interest certificates (also called inverse floating rate securities) in tender option bond
(TOB) trusts, including the portion of assets held by a TOB trust that has been effectively financed by the trust’s issuance of floating rate securities, subject to an agreement by the Adviser as to certain funds to limit the amount of such
assets for determining managed assets in certain circumstances. The complex-level fee is calculated based upon the aggregate daily managed assets of all Nuveen open-end and closed-end funds that constitute “eligible assets.” Eligible
assets do not include assets attributable to investments in other Nuveen funds or assets in excess of a determined amount (originally $2 billion) added to the Nuveen fund complex in connection with the Adviser’s assumption of the management of
the former First American Funds effective January 1, 2011, but do not include certain assets of certain Nuveen funds that were reorganized into funds advised by an affiliate of the Adviser during the 2019 calendar year. As of December 31,
2023, the complex-level fee for each Fund was as follows: |
|
|
|
|
|
| Fund |
|
Complex-Level Fee |
|
|
|
| BXMX |
|
|
0.1602 |
% |
|
|
| DIAX |
|
|
0.1602 |
% |
|
|
| SPXX |
|
|
0.1602 |
% |
|
|
| QQQX |
|
|
0.1602 |
% |
|
|
| JCE |
|
|
0.1602 |
% |
Other Transactions with Affiliates: Each Fund is permitted to purchase or sell securities from or to certain other funds or
accounts managed by the Sub-Adviser (“Affiliated Entity”) under specified conditions outlined in procedures adopted by the Board (“cross-trade”). These procedures have been designed to ensure that any cross-trade of securities by
the Fund from or to an Affiliated Entity by virtue of having a common investment adviser (or affiliated investment adviser), common officer and/or common trustee complies with Rule 17a-7 under the 1940 Act. These transactions are effected at the
current market price (as provided by an independent pricing service) without incurring broker commissions.
During the current fiscal period, the Funds engaged in
cross-trades pursuant to these procedures as follows:
|
|
|
|
|
|
|
|
|
|
|
|
|
| Fund |
|
Purchases |
|
|
Sales |
|
|
Realized
Gain (Loss) |
|
| |
|
|
|
|
|
| BXMX |
|
$ |
– |
|
|
$ |
– |
|
|
$ |
– |
|
|
|
|
|
| DIAX |
|
|
– |
|
|
|
– |
|
|
|
– |
|
84
|
|
|
|
|
|
|
|
|
|
|
|
|
| Fund |
|
Purchases |
|
|
Sales |
|
|
Realized
Gain (Loss) |
|
| |
|
|
|
|
|
| SPXX |
|
$ |
5,245,386 |
|
|
$ |
58,461 |
|
|
$ |
34,356 |
|
|
|
|
|
| QQQX |
|
|
4,846,802 |
|
|
|
8,688,318 |
|
|
|
1,693,080 |
|
|
|
|
|
| JCE |
|
|
16,546,672 |
|
|
|
4,996,295 |
|
|
|
325,382 |
|
| 9. |
Inter-Fund Borrowing and Lending |
Inter-Fund Borrowing and Lending: The SEC has granted an exemptive order permitting registered open-end and closed-end Nuveen funds to participate in an
inter-fund lending facility whereby the Nuveen funds may directly lend to and borrow money from each other for temporary purposes (e.g., to satisfy redemption requests or when a sale of securities “fails,” resulting in an unanticipated
cash shortfall) (the “Inter-Fund Program”). The closed-end Nuveen funds, including the Funds covered by this shareholder report, will participate only as lenders, and not as borrowers, in the Inter-Fund Program because such closed-end
funds rarely, if ever, need to borrow cash to meet redemptions. The Inter-Fund Program is subject to a number of conditions, including, among other things, the requirements that (1) no fund may borrow or lend money through the Inter-Fund
Program unless it receives a more favorable interest rate than is typically available from a bank or other financial institution for a comparable transaction; (2) no fund may borrow on an unsecured basis through the Inter-Fund Program unless
the fund’s outstanding borrowings from all sources immediately after the inter-fund borrowing total 10% or less of its total assets; provided that if the borrowing fund has a secured borrowing outstanding from any other lender, including but
not limited to another fund, the inter-fund loan must be secured on at least an equal priority basis with at least an equivalent percentage of collateral to loan value; (3) if a fund’s total outstanding borrowings immediately after an
inter-fund borrowing would be greater than 10% of its total assets, the fund may borrow through the inter-fund loan on a secured basis only; (4) no fund may lend money if the loan would cause its aggregate outstanding loans through the
Inter-Fund Program to exceed 15% of its net assets at the time of the loan; (5) a fund’s inter-fund loans to any one fund shall not exceed 5% of the lending fund’s net assets; (6) the duration of inter-fund loans will be limited
to the time required to receive payment for securities sold, but in no event more than seven days; and (7) each inter-fund loan may be called on one business day’s notice by a lending fund and may be repaid on any day by a borrowing fund.
In addition, a Nuveen fund may participate in the Inter-Fund Program only if and to the extent that such participation is consistent with the fund’s investment objective and investment policies. The Board is responsible for overseeing the
Inter-Fund Program.
The limitations detailed above and the other conditions of the SEC exemptive order permitting the Inter-Fund Program are designed to minimize the
risks associated with Inter-Fund Program for both the lending fund and the borrowing fund. However, no borrowing or lending activity is without risk. When a fund borrows money from another fund, there is a risk that the loan could be called on one
day’s notice or not renewed, in which case the fund may have to borrow from a bank at a higher rate or take other actions to payoff such loan if an inter-fund loan is not available from another fund. Any delay in repayment to a lending
fund could result in a lost investment opportunity or additional borrowing costs.
During the current reporting period, none of the Funds covered by this shareholder
report have entered into any inter-fund loan activity.
85
[This page intentionally left blank.]
86
Shareholder Update
(Unaudited)
CURRENT
INVESTMENT OBJECTIVES, INVESTMENT POLICIES AND PRINCIPAL RISKS OF THE FUNDS
NUVEEN S&P 500 BUY-WRITE INCOME FUND (BXMX)
Investment Objective
The Fund’s investment objective is to seek attractive
total return with less volatility than the S&P 500 Index.
Investment Policies
Under normal circumstances, the Fund will invest at least 80% of its Assets (as defined below) in a diversified equity portfolio made up of securities comprising the
S&P 500 Index (or securities that have economic characteristics that are similar to those securities comprising the S&P 500 Index) that seeks to substantially replicate price movements of the S&P 500 Index and is
designed to support the Fund’s option strategy.
Under normal circumstances, the Fund expects to invest substantially all (at least 90%) of its Managed Assets
(as defined below) in its equity portfolio or otherwise in pursuit of its investment objective.
The Fund employs a constant “buy-write” option strategy
whereby the Fund’s sub-adviser sells (writes) index call options on a continuous basis on substantially the full value of the Fund’s equity portfolio. The Fund targets a constant overwrite level (i.e., the ratio of the notional
value of index call options sold by the Fund to the market value of the Fund’s equity portfolio) of 100% of the value of its equity portfolio. The Fund’s use of a buy-write strategy, which is also commonly referred to as a buy-write income
strategy, is intended to produce cash flow for the Fund in the form of premiums on the options written. In exchange for this cash flow (the income component of a buy-write strategy), the Fund’s total return may be reduced relative to the
S&P 500 Index in rising markets and may be enhanced relative to the S&P 500 Index in flat or declining markets, in each case consistent with the Fund’s investment objective to seek attractive total return with less volatility than the
S&P 500 Index.
“Assets” means net assets of the Fund plus the amount of any borrowings for investment purposes. “Managed Assets” mean the
total assets of the Fund, minus the sum of its accrued liabilities (other than Fund liabilities incurred for the express purpose of creating leverage). Total assets for this purpose shall include assets attributable to the Fund’s use of
leverage (whether or not those assets are reflected in the Fund’s financial statements for purposes of generally accepted accounting principles), and derivatives will be valued at their market value.
Under normal market conditions:
| |
· |
|
As a fundamental policy, the Fund may not concentrate (i.e., invest more than 25% of its total assets) in securities of
issuers in any one industry, except that the Fund will be concentrated in an industry or group of industries to the extent the S&P 500 Index is concentrated in an industry or group of industries (Industry Concentration Policy).
|
| |
· |
|
The Fund may invest no more than 10% of its Managed Assets in short-term, high quality fixed-income securities.
|
| |
· |
|
The Fund may invest up to 20% of its Managed Assets in securities of non-U.S. issuers that are U.S. dollar
denominated, which may include securities of issuers located, or conducting their business, in emerging market countries. |
The foregoing policies
apply only at the time of any new investment.
Approving Changes in Investment Policies
The Board of Trustees of the Fund may change the policies described above without a shareholder vote. However, with respect to the Fund’s policy of investing at
least 80% of its Assets in its equity portfolio, such policy may not be changed without 60 days’ prior written notice to Common Shareholders.
However, the
Fund’s fundamental Industry Concentration Policy may not be changed without the approval of the holders of a majority of the outstanding common shares. A “majority of the outstanding” shares means (i) 67% or more of the shares
present at a meeting, if the holders of more than 50% of the shares are present or represented by proxy or (ii) more than 50% of the shares, whichever is less.
Portfolio Contents
The Fund expects to invest in a portfolio of individual
common stocks designed to replicate the risk and return profile, and thereby substantially replicate price movements, of the S&P 500 Index. The Fund may also invest in other investment companies, including exchange-traded fund
(“ETFs”), that provide similar exposure to individual common stocks consistent with the Fund’s investment objective. Common stock generally represents an equity ownership interest in an issuer, without preference over and with a lower
priority than any other class of securities, including such issuer’s debt securities, preferred stock and other senior equity securities. Common stocks usually carry voting rights and earn dividends. Common stocks fluctuate in price in response
to many factors including historical and prospective earnings of the issuer, the value of its assets, general economic conditions, interest rates, investor perceptions and market liquidity, as such the company may or may not pay dividends. Dividends
on common stocks are declared at the discretion of the company’s board. In addition, common stock generally has the greatest appreciation and depreciation potential because increases and decreases in earnings are usually reflected in a
company’s stock price.
In carrying out its option strategy, the Fund may write index call options on the S&P 500 Index and other broad-based indices and
may, if the Fund’s sub-adviser deems conditions appropriate, write call options on a variety of other equity market indices. As the seller of an index call option, the Fund receives a premium from the purchaser. The purchaser of the index call
option has the right to any appreciation in the value of the index over
87
Shareholder Update (Unaudited) (continued)
the exercise price upon the exercise of the call option or the expiration date. If, at expiration, the purchaser
exercises the index option sold by the Fund, the Fund will pay the purchaser the difference between the cash value of the index and the exercise price of the index option. The premium, the exercise price and the market value of the index determine
the gain or loss realized by the Fund as the seller of the index call option.
The Fund may invest in U.S. Government securities. U.S. Government securities include
(1) U.S. Treasury obligations, which differ in their interest rates, maturities and times of issuance: U.S. Treasury bills (maturities of one year or less), U.S. Treasury notes (maturities of one year to ten years) and U.S. Treasury bonds
(generally maturities of greater than ten years) and (2) obligations issued or guaranteed by U.S. Government agencies and instrumentalities that are supported by any of the following: (i) the full faith and credit of the U.S. Treasury,
(ii) the right of the issuer to borrow an amount limited to a specific line of credit from the U.S. Treasury, (iii) discretionary authority of the U.S. Government to purchase certain obligations of the U.S. Government agency or
instrumentality or (iv) the credit of the agency or instrumentality.
The Fund also may invest in any other security or agreement collateralized or otherwise
secured by U.S. Government securities. Agencies and instrumentalities of the U.S. Government include but are not limited to: Federal Land Banks, Federal Financing Banks, Banks for Cooperatives, Federal Intermediate Credit Banks, Farm Credit Banks,
Federal Home Loan Banks, Federal Home Loan Mortgage Corporation, Federal National Mortgage Association, Government National Mortgage Association, Student Loan Marketing Association, U.S. Postal Service, Small Business Administration, Tennessee
Valley Authority and any other enterprise established or sponsored by the U.S. Government. Because the U.S. Government generally is not obligated to provide support to its instrumentalities, the Fund will invest in obligations issued by these
instrumentalities only if its sub-adviser determines that the credit risk with respect to such obligations is minimal.
The Fund may invest in commercial paper.
Commercial paper represents short-term unsecured promissory notes issued in bearer form by corporations such as banks or bank holding companies and finance companies.
The Fund may enter into repurchase agreements (the purchase of a security coupled with an agreement to resell that security at a higher price) with respect to its
permitted investments. The Fund’s repurchase agreements will provide that the value of the collateral underlying the repurchase agreement will always be at least equal to the repurchase price, including any accrued interest earned on the
agreement, and will be marked-to-market daily.
The Fund may invest in securities of non-U.S. issuers that are U.S. dollar-denominated, which may include securities
of issuers located, or conducting their business, in emerging market countries. The Fund will classify an issuer of a security as being a U.S. or non-U.S. issuer based on the determination of an unaffiliated, recognized financial data provider. Such
determinations are based on a number of criteria, such as the issuer’s country of domicile, the primary exchange on which the security predominately trades, the location from which the majority of the issuer’s revenue comes, and the
issuer’s reporting currency. Furthermore, a country is considered to be an “emerging market” if it has a relatively low gross national product per capita compared to the world’s major economies and the potential for rapid
economic growth. The Fund considers a country an emerging market country based on the determination of an international organization, such as the IMF, or an unaffiliated, recognized financial data provider.
The Fund may buy and sell securities on a when-issued or delayed delivery basis, making payment or taking delivery at a later date, normally within 15 to 45 days of the
trade date.
The Fund may invest in illiquid securities (i.e., securities that are not readily marketable), including, but not limited to, restricted securities
(securities the disposition of which is restricted under the federal securities laws), securities that may be resold only pursuant to Rule 144A under the Securities Act of 1933, as amended (the “1933 Act”), and repurchase agreements with
maturities in excess of seven days.
The Fund may enter into certain derivative instruments in pursuit of its investment objective, including to seek to enhance
return, to hedge certain risks of its investments in securities or as a substitute for a position in the underlying asset. Such instruments include financial futures contracts and options thereon, swaps (with varying terms, including interest rate
swaps and credit default swaps), options on interest rates, options on indices, options on swaps, options on currencies and other fixed-income derivative instruments that may have the economic effect of leverage.
The Fund may also invest in securities of other open- or closed-end investment companies (including ETFs) that invest primarily in securities of the types in
which the Fund may invest directly, to the extent permitted by the Investment Company Act of 1940 Act, as amended (the “1940 Act”), the rules and regulations issued thereunder and applicable exemptive orders issued by the Securities and
Exchange Commission (“SEC”).
The Fund may lend securities representing up to one-third of the value of its total assets to broker-dealers, banks,
and other institutions to generate additional income. When the Fund loans its portfolio securities, it will receive, at the inception of each loan, cash collateral equal to at least 102% of the value of the loaned securities. Under the Fund’s
securities lending agreement, the securities lending agent will generally bear the risk that a borrower may default on its obligation to return loaned securities. The Fund, however, will be responsible for the risks associated with the investment of
cash collateral. The Fund may lose money on its investment of cash collateral or may fail to earn sufficient income on its investment to meet its obligations to the borrower.
Use of Leverage
As a non-fundamental policy, the Fund will not
leverage its capital structure by issuing senior securities such as the issuance of preferred shares of beneficial interest or debt instruments. However, the Fund may borrow for temporary or emergency purposes and may enter into certain derivatives
transactions that have the economic effect of leverage.
88
Temporary Defensive Periods
During temporary defensive periods the Fund may deviate from its investment objective and policies, and in order to keep the Fund’s cash fully invested, the Fund may
invest any portion of its Managed Assets in investment grade debt securities, including obligations issued or guaranteed by the U.S. government, its agencies and instrumentalities. The Fund may not achieve its investment objectives during such
periods.
89
Shareholder Update (Unaudited) (continued)
NUVEEN DOW 30SM DYNAMIC OVERWRITE FUND (DIAX)
Investment Objective
The Fund’s investment objective is to seek
attractive total return with less volatility than the Dow Jones Industrial Average (the “DJIA”).
Investment Policies
Under normal circumstances, the Fund will invest at least 80% of its Assets (as defined below) in the thirty stocks included in the DJIA in approximately the amount such
stocks are weighted in the DJIA and/or in other securities or financial instruments with economic characteristics that are similar to the thirty stocks included in the DJIA that are intended to correlate with the price movements of the DJIA.
Under normal circumstances, the Fund expects to invest substantially all (at least 90%) of its Managed Assets (as defined below) in its equity portfolio or otherwise in
pursuit of its investment objective.
The Fund’s sub-adviser constructs the Fund’s equity portfolio by purchasing the common stock of each company included
in the DJIA in approximately the amounts stocks are weighted in the DJIA. The Fund will periodically rebalance its holdings of DJIA stocks in order to more closely approximate each stock’s weighting in the DJIA. The Fund’s sub-adviser will
consider the tax consequences of certain transactions within the Fund’s equity portfolio and intends to manage the portfolio in a tax-efficient manner by taking, for example, capital losses when possible to offset realized capital gains. The
Fund’s sub-adviser will rebalance and adjust the Fund’s equity portfolio as necessary for tracking and tax management purposes.
The Fund employs a dynamic
options “overwrite” strategy whereby the Fund’s sub-adviser sells (writes) call options on a varying percentage of the market value of the Fund’s equity portfolio based on its market outlook. Pursuant to this option strategy,
under normal circumstances, the Fund sells (writes) index call options, call options on custom baskets of securities, and call options on individual securities. In addition to a primary emphasis on writing call options to reduce downside risk and
volatility of the Fund’s equity portfolio, the Fund’s option strategy as a secondary emphasis seeks additional return opportunities by capitalizing on inefficiencies in the options market through a variety of means including the use of
call spreads, purchasing call options, and selling put options.
The Fund targets an overwrite level (i.e., the ratio of the notional value of call options sold by
the Fund to the market value of the Fund’s equity portfolio) of 55% of the value of its equity portfolio over time, and the overwrite level will vary, based on market conditions, between 35% to 75% of the value of its equity portfolio.
“Assets” means net assets of the Fund plus the amount of any borrowings for investment purposes. “Managed Assets” mean the total assets of the Fund,
minus the sum of its accrued liabilities (other than Fund liabilities incurred for the express purpose of creating leverage). Total assets for this purpose shall include assets attributable to the Fund’s use of leverage (whether or not those
assets are reflected in the Fund’s financial statements for purposes of generally accepted accounting principles), and derivatives will be valued at their market value.
Under normal market conditions:
| |
· |
|
As a fundamental policy, the Fund may not concentrate (i.e., invest more than 25% of its total assets) in securities of
issuers in any one industry, except that if 25% or more of the securities in the DIJA are issued by companies in one industry, the Fund will concentrate in that industry unless the Fund would need to avoid concentration in order to implement its
investment strategy as it relates to avoiding the adverse tax treatment associated with straddle positions (Industry Concentration Policy). |
| |
· |
|
The Fund may invest no more than 10% of its Managed Assets in short-term, high quality fixed-income securities.
|
| |
· |
|
The Fund may invest up to 20% of its Managed Assets in securities of non-U.S. issuers that are U.S. dollar
denominated, which may include securities of issuers located, or conducting their business, in emerging market countries. |
The foregoing policies
apply only at the time of any new investment.
Approving Changes in Investment Policies
The Board of Trustees of the Fund may change the policies described above without a shareholder vote. However, with respect to the Fund’s policy of investing at
least 80% of its Assets in its equity portfolio, such policy may not be changed without 60 days’ prior written notice to shareholders.
However, the Fund’s
fundamental Industry Concentration Policy may not be changed without the approval of the holders of a majority of the outstanding common shares. A “majority of the outstanding” shares means (i) 67% or more of the shares present at a
meeting, if the holders of more than 50% of the shares are present or represented by proxy or (ii) more than 50% of the shares, whichever is less.
Portfolio
Contents
The Fund will invest in the thirty common stocks included in the DJIA in approximately the amount such stocks are weighted in the DJIA. The Fund may
also invest in other securities or financial instruments with economic characteristics that are similar to the thirty stocks included in the DJIA that are intended to correlate with the price movements of the DJIA. The Fund may also invest in other
investment companies, including ETFs,
90
that provide similar exposure to individual common stocks consistent with the Fund’s investment objective. Common
stock generally represents an equity ownership interest in an issuer, without preference over and with a lower priority than any other class of securities, including such issuer’s debt securities, preferred stock and other senior equity
securities. Common stocks usually carry voting rights and earn dividends. Common stocks fluctuate in price in response to many factors including historical and prospective earnings of the issuer, the value of its assets, general economic conditions,
interest rates, investor perceptions and market liquidity, as such the company may or may not pay dividends. Dividends on common stocks are declared at the discretion of the company’s board. In addition, common stock generally has the greatest
appreciation and depreciation potential because increases and decreases in earnings are usually reflected in a company’s stock price.
As part of its option
strategy, the Fund sells (writes) index call options, call options on custom baskets of securities, and covered or uncovered call options on individual securities. An option contract is a contract that gives the holder of the option, in return for a
premium, the right to buy from (in the case of a call) or sell to (in the case of a put) the writer of the option the reference instrument underlying the option (or the cash value of the index) at a specified exercise price at any time during the
term of the option. The writer of an option on a security has the obligation upon exercise of the option to deliver the reference instrument (or the cash) upon payment of the exercise price or to pay the exercise price upon delivery of the reference
instrument (or the cash). Upon exercise of an index option, the writer of an option on an index is obligated to pay the difference between the cash value of the index and the exercise price multiplied by the specified multiplier for the index
option. Options may be “covered,” meaning that the party required to deliver the reference instrument if the option is exercised owns that instrument (or has set aside sufficient assets to meet its obligation to deliver the instrument).
Options may be listed on an exchange or traded in the over-the-counter (“OTC”) market. In general, exchange-traded options have standardized exercise prices and expiration dates and may require the parties to post margin against their
obligations, and the performance of the parties’ obligations in connection with such options is guaranteed by the exchange or a related clearing corporation. OTC options have more flexible terms negotiated between the buyer and the seller but
are subject to counterparty risk. The ability of the Fund to transact business with any one or any number of counterparties, the lack of any independent evaluation of the counterparties or their financial capabilities, and the absence of a
regulated market to facilitate settlement, may increase the potential for losses to the Fund. OTC options also involve greater liquidity risk. This risk may be increased in times of financial stress, if the trading market for OTC
derivative contracts becomes limited.
In carrying out its option strategy, the Fund may write index call options on the DJIA and other broad-based indices and may,
if the Fund’s sub-adviser deems conditions appropriate, write call options on a variety of other equity market indices. As the seller of an index call option, the Fund receives a premium from the purchaser. The purchaser of the index call
option has the right to any appreciation in the value of the index over the exercise price upon the exercise of the call option or the expiration date. If, at expiration, the purchaser exercises the index option sold by the Fund, the Fund will pay
the purchaser the difference between the cash value of the index and the exercise price of the index option. The premium, the exercise price and the market value of the index determine the gain or loss realized by the Fund as the seller of the index
call option.
The Fund may also write call options on custom baskets of securities. A custom basket call option is an OTC option with a counterparty whose value is
linked to the market value of a portfolio of underlying securities and is collateralized by a portion of the Fund’s equity portfolio. In designing the custom basket call options, the Fund’s sub-adviser will primarily select assets not held
by the Fund. In order to minimize the difference between the returns of the underlying securities in the custom basket (commonly referred to as a tracking error), the Fund’s sub-adviser will use optimization calculations when selecting the
individual securities for inclusion in the custom basket.
The Fund may also write single name call options, both covered and “naked” or uncovered, on
individual stocks. A call option written by the Fund on an individual security is “covered” if the Fund owns the security underlying the call or has an absolute and immediate right to acquire that security without additional cash
consideration. The Fund, in effect, sells the potential appreciation in the value of the security subject to the call option in exchange for the premium. The Fund may execute a closing purchase transaction with respect to an option it has sold and
sell another option (with either a different exercise price or expiration date or both). The Fund’s objective in entering into such a closing transaction will be to optimize net index option premiums. The cost of a closing transaction may
reduce the net option premiums realized from the sale of the option. This reduction could be offset, at least in part, by appreciation in the value of the underlying security held in the Fund’s equity portfolio, and by the opportunity to
realize additional premium income from selling a new option.
The Fund may also purchase call options. A call option entitles the purchaser, in return for the premium
paid, to purchase specified securities at a specified price during the option period. Because the premium paid for a call option is typically a small fraction of the price of the underlying security, a given amount of funds will purchase call
options covering a much larger quantity of such security than could be purchased directly. By purchasing call options, the Fund could benefit from any significant increase in the price of the underlying security to a greater extent than if it had
invested the same amount in the security directly.
The Fund may also use call spreads as part of its option strategy. A call spread involves the sale of a call
option and the corresponding purchase of a call option on the same underlying instrument with the same expiration date but with different exercise prices. The call spreads utilized by the Fund generally will generate less net option premium than
writing calls, but limit the overall risk of the strategy by capping the Fund’s liability from the written call while simultaneously allowing for additional upside above the strike price of the purchased call.
The Fund may also use put options as part of its option strategy. A put option gives the purchaser of the option the right (but not the obligation) to sell, and the
writer of the option the obligation to buy, the underlying instrument (or the cash value of the index) at a stated price (the “exercise price”) at any time before the option expires. The purchase price for a put option is the
“premium” paid by the purchaser for the right to sell. When the Fund sells a put option on an underlying instrument and the underlying instrument decreases in value, the purchaser of the put option has the right to exercise the option,
obligating the Fund to purchase the underlying instrument at an exercise price that is higher than the prevailing market price. The Fund collects option premium income when it sells the put option. If the underlying instrument increases in value,
the purchaser of the put option is unlikely to exercise the option since the prevailing market price will be higher than the exercise price. Accordingly, the Fund retains all put premium income collected during market advances.
91
Shareholder Update (Unaudited) (continued)
The Fund may invest in U.S. Government securities. U.S. Government securities include (1) U.S. Treasury
obligations, which differ in their interest rates, maturities and times of issuance: U.S. Treasury bills (maturities of one year or less), U.S. Treasury notes (maturities of one year to ten years) and U.S. Treasury bonds (generally maturities of
greater than ten years) and (2) obligations issued or guaranteed by U.S. Government agencies and instrumentalities that are supported by any of the following: (i) the full faith and credit of the U.S. Treasury, (ii) the right of the
issuer to borrow an amount limited to a specific line of credit from the U.S. Treasury, (iii) discretionary authority of the U.S. Government to purchase certain obligations of the U.S. Government agency or instrumentality or (iv) the
credit of the agency or instrumentality.
The Fund also may invest in any other security or agreement collateralized or otherwise secured by U.S. Government
securities. Agencies and instrumentalities of the U.S. Government include but are not limited to: Federal Land Banks, Federal Financing Banks, Banks for Cooperatives, Federal Intermediate Credit Banks, Farm Credit Banks, Federal Home Loan Banks,
Federal Home Loan Mortgage Corporation, Federal National Mortgage Association, Government National Mortgage Association, Student Loan Marketing Association, U.S. Postal Service, Small Business Administration, Tennessee Valley Authority and any other
enterprise established or sponsored by the U.S. Government. Because the U.S. Government generally is not obligated to provide support to its instrumentalities, the Fund will invest in obligations issued by these instrumentalities only if its
sub-adviser determines that the credit risk with respect to such obligations is minimal.
The Fund may invest in commercial paper. Commercial paper represents
short-term unsecured promissory notes issued in bearer form by corporations such as banks or bank holding companies and finance companies.
The Fund may enter into
repurchase agreements (the purchase of a security coupled with an agreement to resell that security at a higher price) with respect to its permitted investments. The Fund’s repurchase agreements will provide that the value of the collateral
underlying the repurchase agreement will always be at least equal to the repurchase price, including any accrued interest earned on the agreement, and will be marked-to-market daily.
The Fund may invest in securities of non-U.S. issuers that are U.S. dollar-denominated, which may include securities of issuers located, or conducting their business, in
emerging market countries. The Fund will classify an issuer of a security as being a U.S. or non-U.S. issuer based on the determination of an unaffiliated, recognized financial data provider. Such determinations are based on a number of criteria,
such as the issuer’s country of domicile, the primary exchange on which the security predominately trades, the location from which the majority of the issuer’s revenue comes, and the issuer’s reporting currency. Furthermore, a country
is considered to be an “emerging market” if it has a relatively low gross national product per capita compared to the world’s major economies and the potential for rapid economic growth. The Fund considers a country an emerging market
country based on the determination of an international organization, such as the IMF, or an unaffiliated, recognized financial data provider.
The Fund may buy and
sell securities on a when-issued or delayed delivery basis, making payment or taking delivery at a later date, normally within 15 to 45 days of the trade date.
The
Fund may invest in illiquid securities (i.e., securities that are not readily marketable), including, but not limited to, restricted securities (securities the disposition of which is restricted under the federal securities laws), securities that
may be resold only pursuant to Rule 144A under the 1933 Act, and repurchase agreements with maturities in excess of seven days.
The Fund may enter into certain
derivative instruments in pursuit of its investment objective, including to seek to enhance return, to hedge certain risks of its investments in securities or as a substitute for a position in the underlying asset. Such instruments include financial
futures contracts and options thereon, swaps (with varying terms, including interest rate swaps and credit default swaps), options on interest rates, options on indices, options on swaps, options on currencies and other fixed-income derivative
instruments that may have the economic effect of leverage.
The Fund may also invest in securities of other open- or closed-end investment companies
(including ETFs) that invest primarily in securities of the types in which the Fund may invest directly, to the extent permitted by the 1940 Act, the rules and regulations issued thereunder and applicable exemptive orders issued by the SEC.
The Fund may lend securities representing up to one-third of the value of its total assets to broker-dealers, banks, and other institutions to generate
additional income. When the Fund loans its portfolio securities, it will receive, at the inception of each loan, cash collateral equal to at least 102% of the value of the loaned securities. Under the Fund’s securities lending agreement, the
securities lending agent will generally bear the risk that a borrower may default on its obligation to return loaned securities. The Fund, however, will be responsible for the risks associated with the investment of cash collateral. The Fund may
lose money on its investment of cash collateral or may fail to earn sufficient income on its investment to meet its obligations to the borrower.
Use of Leverage
As a non-fundamental policy, the Fund will not leverage its capital structure by issuing senior securities such as the issuance of preferred shares of
beneficial interest or debt instruments. However, the Fund may borrow for temporary or emergency purposes and may enter into certain derivatives transactions that have the economic effect of leverage.
Temporary Defensive Periods
During temporary defensive periods the Fund may
deviate from its investment objective and policies, and in order to keep the Fund’s cash fully invested, the Fund may invest any portion of its Managed Assets in investment grade debt securities, including obligations issued or guaranteed by
the U.S. government, its agencies and instrumentalities. The Fund may not achieve its investment objective during such periods.
92
NUVEEN S&P 500 DYNAMIC OVERWRITE FUND (SPXX)
Investment Objective
The Fund’s investment objective is to seek attractive
total return with less volatility than the S&P 500 Index.
Investment Policies
Under normal circumstances, the Fund will invest at least 80% of its Assets (as defined below) in a diversified equity portfolio made up of securities comprising the
S&P 500 Index (or securities that have economic characteristics that are similar to those securities comprising the S&P 500 Index) that seeks to substantially replicate price movements of the S&P 500 Index and is designed to support
the Fund’s option strategy.
Under normal circumstances, the Fund expects to invest substantially all (at least 90%) of its Managed Assets (as defined below) in
its equity portfolio or otherwise in pursuit of its investment objective.
The Fund’s sub-adviser uses a multi-factor quantitative model, which will consider
opportunities to engage in tax-loss harvesting (i.e., periodically selling positions that have depreciated in value to realize capital losses that can be used to offset capital gains realized by the Fund) and other tax management considerations to
improve after-tax shareholder outcomes, to construct the Fund’s equity portfolio.
The Fund employs a dynamic options “overwrite” strategy whereby the
Fund’s sub-adviser sells (writes) call options on a varying percentage of the market value of the Fund’s equity portfolio based on its market outlook. Pursuant to this option strategy, under normal circumstances, the Fund sells (writes)
index call options, call options on custom baskets of securities, and call options on individual securities. In addition to a primary emphasis on writing call options to reduce downside risk and volatility of the Fund’s equity portfolio, the
Fund’s option strategy as a secondary emphasis seeks additional return opportunities by capitalizing on inefficiencies in the options market through a variety of means including the use of call spreads and selling put option
The Fund targets an overwrite level (i.e., the ratio of the notional value of call options sold by the Fund to the market value of the Fund’s equity portfolio) of
55% of the value of its equity portfolio over time, and the overwrite level will vary, based on market conditions, between 35% to 75% of the value of its equity portfolio.
“Assets” means net assets of the Fund plus the amount of any borrowings for investment purposes. “Managed Assets” mean the total assets of the Fund,
minus the sum of its accrued liabilities (other than Fund liabilities incurred for the express purpose of creating leverage). Total assets for this purpose shall include assets attributable to the Fund’s use of leverage (whether or not those
assets are reflected in the Fund’s financial statements for purposes of generally accepted accounting principles), and derivatives will be valued at their market value.
Under normal market conditions:
| |
· |
|
As a fundamental policy, the Fund may not concentrate (i.e., invest more than 25% of its total assets) in securities of
issuers in any one industry, except that the Fund will be concentrated in an industry or group of industries to the extent the S&P 500 Index is concentrated in an industry or group of industries unless the Fund would need to avoid concentration
in order to implement its investment strategy as it relates to avoiding the adverse tax treatment associated with straddle positions (Industry Concentration Policy). |
| |
· |
|
The Fund may invest no more than 10% of its Managed Assets in short-term, high quality fixed-income securities.
|
| |
· |
|
The Fund may invest up to 20% of its Managed Assets in securities of non-U.S. issuers that are U.S. dollar
denominated, which may include securities of issuers located, or conducting their business, in emerging market countries. |
The foregoing policies
apply only at the time of any new investment.
Approving Changes in Investment Policies
The Board of Trustees of the Fund may change the policies described above without a shareholder vote. However, with respect to the Fund’s policy of investing at
least 80% of its Assets in its equity portfolio, such policies may not be changed without 60 days’ prior written notice to shareholders.
However, the
Fund’s fundamental Industry Concentration Policy may not be changed without the approval of the holders of a majority of the outstanding common shares. A “majority of the outstanding” shares means (i) 67% or more of the shares
present at a meeting, if the holders of more than 50% of the shares are present or represented by proxy or (ii) more than 50% of the shares, whichever is less.
Portfolio Contents
The Fund will invest in a portfolio of individual common
stocks designed to replicate the risk and return profile, and thereby substantially replicate price movements of the S&P 500 Index. The Fund may also invest in other investment companies, including ETFs, that provide similar exposure to
individual common stocks consistent with the Fund’s investment objective. Common stock generally represents an equity ownership interest in an issuer, without preference over and with a lower priority than any other class of securities,
including such issuer’s debt securities, preferred stock and other senior equity securities. Common stocks usually carry voting rights and earn dividends. Common stocks fluctuate in price in response to
93
Shareholder Update (Unaudited) (continued)
many factors including historical and prospective earnings of the issuer, the value of its assets, general economic
conditions, interest rates, investor perceptions and market liquidity, as such the company may or may not pay dividends. Dividends on common stocks are declared at the discretion of the company’s board. In addition, common stock generally has
the greatest appreciation and depreciation potential because increases and decreases in earnings are usually reflected in a company’s stock price.
As part of
its option strategy, the Fund sells (writes) index call options, call options on custom baskets of securities, and covered or uncovered call options on individual securities. An option contract is a contract that gives the holder of the option, in
return for a premium, the right to buy from (in the case of a call) or sell to (in the case of a put) the writer of the option the reference instrument underlying the option (or the cash value of the index) at a specified exercise price at any time
during the term of the option. The writer of an option on a security has the obligation upon exercise of the option to deliver the reference instrument (or the cash) upon payment of the exercise price or to pay the exercise price upon delivery of
the reference instrument (or the cash). Upon exercise of an index option, the writer of an option on an index is obligated to pay the difference between the cash value of the index and the exercise price multiplied by the specified multiplier for
the index option. Options may be “covered,” meaning that the party required to deliver the reference instrument if the option is exercised owns that instrument (or has set aside sufficient assets to meet its obligation to deliver the
instrument). Options may be listed on an exchange or traded in the OTC market. In general, exchange-traded options have standardized exercise prices and expiration dates and may require the parties to post margin against their obligations, and the
performance of the parties’ obligations in connection with such options is guaranteed by the exchange or a related clearing corporation. OTC options have more flexible terms negotiated between the buyer and the seller but are subject to
counterparty risk. The ability of the Fund to transact business with any one or any number of counterparties, the lack of any independent evaluation of the counterparties or their financial capabilities, and the absence of a regulated market to
facilitate settlement, may increase the potential for losses to the Fund. OTC options also involve greater liquidity risk. This risk may be increased in times of financial stress, if the trading market for OTC derivative contracts becomes
limited.
In carrying out its option strategy, the Fund may write index call options on the S&P 500 Index and other broad-based indices and may, if the
Fund’s sub-adviser deems conditions appropriate, write call options on a variety of other equity market indices. As the seller of an index call option, the Fund receives a premium from the purchaser. The purchaser of the index call option has
the right to any appreciation in the value of the index over the exercise price upon the exercise of the call option or the expiration date. If, at expiration, the purchaser exercises the index option sold by the Fund, the Fund will pay the
purchaser the difference between the cash value of the index and the exercise price of the index option. The premium, the exercise price and the market value of the index determine the gain or loss realized by the Fund as the seller of the index
call option.
The Fund may also write call options on custom baskets of securities. A custom basket call option is an OTC option with a counterparty whose value is
linked to the market value of a portfolio of underlying securities and is collateralized by a portion of the Fund’s equity portfolio. In designing the custom basket call options, the Fund’s sub-adviser will primarily select assets not held
by the Fund. In order to minimize the difference between the returns of the underlying securities in the custom basket (commonly referred to as a tracking error), the Fund’s sub-adviser will use optimization calculations when selecting the
individual securities for inclusion in the custom basket.
The Fund may also write single name call options, both covered and “naked” or uncovered, on
individual stocks. A call option written by the Fund on an individual security is “covered” if the Fund owns the security underlying the call or has an absolute and immediate right to acquire that security without additional cash
consideration. The Fund, in effect, sells the potential appreciation in the value of the security subject to the call option in exchange for the premium. The Fund may execute a closing purchase transaction with respect to an option it has sold and
sell another option (with either a different exercise price or expiration date or both). The Fund’s objective in entering into such a closing transaction will be to optimize net index option premiums. The cost of a closing transaction may
reduce the net option premiums realized from the sale of the option. This reduction could be offset, at least in part, by appreciation in the value of the underlying security held in the Fund’s equity portfolio, and by the opportunity to
realize additional premium income from selling a new option.
The Fund may also use call spreads as part of its option strategy. A call spread involves the sale of a
call option and the corresponding purchase of a call option on the same underlying instrument with the same expiration date but with different exercise prices. The call spreads utilized by the Fund generally will generate less net option premium
than writing calls, but limit the overall risk of the strategy by capping the Fund’s liability from the written call while simultaneously allowing for additional upside above the strike price of the purchased call.
The Fund may also use put options as part of its option strategy. A put option gives the purchaser of the option the right (but not the obligation) to sell, and the
writer of the option the obligation to buy, the underlying instrument (or the cash value of the index) at a stated price (the “exercise price”) at any time before the option expires. The purchase price for a put option is the
“premium” paid by the purchaser for the right to sell. When the Fund sells a put option on an underlying instrument and the underlying instrument decreases in value, the purchaser of the put option has the right to exercise the option,
obligating the Fund to purchase the underlying instrument at an exercise price that is higher than the prevailing market price. The Fund collects option premium income when it sells the put option. If the underlying instrument increases in value,
the purchaser of the put option is unlikely to exercise the option since the prevailing market price will be higher than the exercise price. Accordingly, the Fund retains all put premium income collected during market advances.
The Fund may invest in U.S. Government securities. U.S. Government securities include (1) U.S. Treasury obligations, which differ in their interest rates, maturities
and times of issuance: U.S. Treasury bills (maturities of one year or less), U.S. Treasury notes (maturities of one year to ten years) and U.S. Treasury bonds (generally maturities of greater than ten years) and (2) obligations issued or
guaranteed by U.S. Government agencies and instrumentalities that are supported by any of the following: (i) the full faith and credit of the U.S. Treasury, (ii) the right of the issuer to borrow an amount limited to a specific line of
credit from the U.S. Treasury, (iii) discretionary authority of the U.S. Government to purchase certain obligations of the U.S. Government agency or instrumentality or (iv) the credit of the agency or instrumentality.
The Fund also may invest in any other security or agreement collateralized or otherwise secured by U.S. Government securities. Agencies and instrumentalities of the U.S.
Government include but are not limited to: Federal Land Banks, Federal Financing Banks, Banks for Cooperatives, Federal Intermediate Credit Banks, Farm Credit Banks, Federal Home Loan Banks, Federal Home Loan Mortgage Corporation, Federal National
Mortgage Association, Government National Mortgage Association, Student Loan Marketing Association, U.S. Postal Service, Small Business
94
Administration, Tennessee Valley Authority and any other enterprise established or sponsored by the U.S. Government.
Because the U.S. Government generally is not obligated to provide support to its instrumentalities, the Fund will invest in obligations issued by these instrumentalities only if its sub-adviser determines that the credit risk with respect to such
obligations is minimal.
The Fund may invest in commercial paper. Commercial paper represents short-term unsecured promissory notes issued in bearer form by
corporations such as banks or bank holding companies and finance companies.
The Fund may enter into repurchase agreements (the purchase of a security coupled with an
agreement to resell that security at a higher price) with respect to its permitted investments. The Fund’s repurchase agreements will provide that the value of the collateral underlying the repurchase agreement will always be at least equal to
the repurchase price, including any accrued interest earned on the agreement, and will be marked-to-market daily.
The Fund may invest in securities of non-U.S.
issuers that are U.S. dollar-denominated, which may include securities of issuers located, or conducting their business, in emerging market countries. The Fund will classify an issuer of a security as being a U.S. or non-U.S. issuer based on the
determination of an unaffiliated, recognized financial data provider. Such determinations are based on a number of criteria, such as the issuer’s country of domicile, the primary exchange on which the security predominately trades, the location
from which the majority of the issuer’s revenue comes, and the issuer’s reporting currency. Furthermore, a country is considered to be an “emerging market” if it has a relatively low gross national product per capita compared to
the world’s major economies and the potential for rapid economic growth. The Fund considers a country an emerging market country based on the determination of an international organization, such as the IMF, or an unaffiliated, recognized
financial data provider.
The Fund may buy and sell securities on a when-issued or delayed delivery basis, making payment or taking delivery at a later date, normally
within 15 to 45 days of the trade date.
The Fund may invest in illiquid securities (i.e., securities that are not readily marketable), including, but not limited to,
restricted securities (securities the disposition of which is restricted under the federal securities laws), securities that may be resold only pursuant to Rule 144A under the 1933 Act, and repurchase agreements with maturities in excess of seven
days.
The Fund may enter into certain derivative instruments in pursuit of its investment objective, including to seek to enhance return, to hedge certain risks of
its investments in securities or as a substitute for a position in the underlying asset. Such instruments include financial futures contracts and options thereon, swaps (with varying terms, including interest rate swaps and credit default swaps),
options on interest rates, options on indices, options on swaps, options on currencies and other fixed-income derivative instruments that may have the economic effect of leverage.
The Fund may also invest in securities of other open- or closed-end investment companies (including ETFs) that invest primarily in securities of the types in
which the Fund may invest directly, to the extent permitted by the 1940 Act, the rules and regulations issued thereunder and applicable exemptive orders issued by the SEC.
The Fund may lend securities representing up to one-third of the value of its total assets to broker-dealers, banks, and other institutions to generate
additional income. When the Fund loans its portfolio securities, it will receive, at the inception of each loan, cash collateral equal to at least 102% of the value of the loaned securities. Under the Fund’s securities lending agreement, the
securities lending agent will generally bear the risk that a borrower may default on its obligation to return loaned securities. The Fund, however, will be responsible for the risks associated with the investment of cash collateral. The Fund may
lose money on its investment of cash collateral or may fail to earn sufficient income on its investment to meet its obligations to the borrower.
Use of Leverage
As a non-fundamental policy, the Fund will not leverage its capital structure by issuing senior securities such as the issuance of preferred shares of
beneficial interest or debt instruments. However, the Fund may borrow for temporary or emergency purposes and may enter into certain derivatives transactions that have the economic effect of leverage.
Temporary Defensive Periods
During temporary defensive periods the Fund may
deviate from its investment objective and policies, and in order to keep the Fund’s cash fully invested, the Fund may invest any portion of its Managed Assets in investment grade debt securities, including obligations issued or guaranteed by
the U.S. government, its agencies and instrumentalities. The Fund may not achieve its investment objective during such periods.
95
Shareholder Update (Unaudited) (continued)
NUVEEN NASDAQ 100 DYNAMIC OVERWRITE FUND (QQQX)
Investment Objective
The Fund’s investment objective is to seek attractive
total return with less volatility than the Nasdaq 100 Index.
Investment Policies
Under normal circumstances, the Fund will invest at least 80% of its Assets (as defined below) in an equity portfolio made up of securities comprising the Nasdaq 100
Index (or securities that have economic characteristics that are similar to those securities comprising the Nasdaq 100 Index) that seeks to substantially replicate price movements of the Nasdaq 100 Index and is designed to support the Fund’s
option strategy.
Under normal circumstances, the Fund expects to invest substantially all (at least 90%) of its Managed Assets (as defined below) in its equity
portfolio or otherwise in pursuit of its investment objective.
The Fund’s sub-adviser uses a multi-factor quantitative model, which will consider opportunities
to engage in tax-loss harvesting (i.e., periodically selling positions that have depreciated in value to realize capital losses that can be used to offset capital gains realized by the Fund) and other tax management considerations to improve
after-tax shareholder outcomes, to construct the Fund’s equity portfolio.
The Fund employs a dynamic options “overwrite” strategy whereby the
Fund’s sub-adviser sells (writes) call options on a varying percentage of the market value of the Fund’s equity portfolio based on its market outlook. Pursuant to this option strategy, under normal circumstances, the Fund sells (writes)
index call options, call options on custom baskets of securities, and call options on individual securities. In addition to a primary emphasis on writing call options to reduce downside risk and volatility of the Fund’s equity portfolio, the
Fund’s option strategy as a secondary emphasis seeks additional return opportunities by capitalizing on inefficiencies in the options market through a variety of means including the use of call spreads and selling put options.
The Fund targets an overwrite level (i.e., the ratio of the notional value of call options sold by the Fund to the market value of the Fund’s equity portfolio) of
55% of the value of its equity portfolio over time, and the overwrite level will vary, based on market conditions, between 35% to 75% of the value of its equity portfolio.
“Assets” means net assets of the Fund plus the amount of any borrowings for investment purposes. “Managed Assets” mean the total assets of the Fund,
minus the sum of its accrued liabilities (other than Fund liabilities incurred for the express purpose of creating leverage). Total assets for this purpose shall include assets attributable to the Fund’s use of leverage (whether or not those
assets are reflected in the Fund’s financial statements for purposes of generally accepted accounting principles), and derivatives will be valued at their market value.
Under normal market conditions:
| |
· |
|
As a fundamental policy, the Fund may not concentrate (i.e., invest more than 25% of its total assets) in securities of
issuers in any one industry, except that if 25% or more of the securities in the Nasdaq 100 Index are issued by companies in one industry, the Fund will concentrate in that industry unless the Fund would need to avoid concentration in order to
implement its investment strategy as it relates to avoiding the adverse tax treatment associated with straddle positions (Industry Concentration Policy). |
| |
· |
|
The Fund may invest no more than 10% of its Managed Assets in short-term, high quality fixed-income securities.
|
| |
· |
|
The Fund may invest up to 20% of its Managed Assets in securities of non-U.S. issuers that are U.S. dollar
denominated, which may include securities of issuers located, or conducting their business, in emerging market countries. |
The foregoing policies
apply only at the time of any new investment.
Approving Changes in Investment Policies
The Board of Trustees of the Fund may change the policies described above without a shareholder vote. However, with respect to the Fund’s policy of investing at
least 80% of its Assets in the equity portfolio, such policy may not be changed without 60 days’ prior written notice to shareholders.
However, the Fund’s
fundamental Industry Concentration Policy may not be changed without the approval of the holders of a majority of the outstanding common shares. A “majority of the outstanding” shares means (i) 67% or more of the shares present at a
meeting, if the holders of more than 50% of the shares are present or represented by proxy or (ii) more than 50% of the shares, whichever is less.
Portfolio
Contents
The Fund will invest in a portfolio of individual common stocks designed to replicate the risk and return profile, and thereby substantially replicate
price movements of the Nasdaq 100 Index. The Fund may also invest in other investment companies, including ETFs, that provide similar exposure to individual common stocks consistent with the Fund’s investment objective. Common stock generally
represents an equity ownership interest in an issuer, without preference over and with a lower priority than any other class of securities, including such issuer’s debt securities, preferred stock and other senior equity securities. Common
stocks usually carry voting rights and earn dividends. Common stocks fluctuate in price in response to
96
many factors including historical and prospective earnings of the issuer, the value of its assets, general economic
conditions, interest rates, investor perceptions and market liquidity, as such the company may or may not pay dividends. Dividends on common stocks are declared at the discretion of the company’s board. In addition, common stock generally has
the greatest appreciation and depreciation potential because increases and decreases in earnings are usually reflected in a company’s stock price.
As part of
its option strategy, the Fund sells (writes) index call options, call options on custom baskets of securities, and covered or uncovered call options on individual securities. An option contract is a contract that gives the holder of the option, in
return for a premium, the right to buy from (in the case of a call) or sell to (in the case of a put) the writer of the option the reference instrument underlying the option (or the cash value of the index) at a specified exercise price at any time
during the term of the option. The writer of an option on a security has the obligation upon exercise of the option to deliver the reference instrument (or the cash) upon payment of the exercise price or to pay the exercise price upon delivery of
the reference instrument (or the cash). Upon exercise of an index option, the writer of an option on an index is obligated to pay the difference between the cash value of the index and the exercise price multiplied by the specified multiplier for
the index option. Options may be “covered,” meaning that the party required to deliver the reference instrument if the option is exercised owns that instrument (or has set aside sufficient assets to meet its obligation to deliver the
instrument). Options may be listed on an exchange or traded in the OTC market. In general, exchange-traded options have standardized exercise prices and expiration dates and may require the parties to post margin against their obligations, and the
performance of the parties’ obligations in connection with such options is guaranteed by the exchange or a related clearing corporation. OTC options have more flexible terms negotiated between the buyer and the seller but are subject to
counterparty risk. The ability of the Fund to transact business with any one or any number of counterparties, the lack of any independent evaluation of the counterparties or their financial capabilities, and the absence of a regulated market to
facilitate settlement, may increase the potential for losses to the Fund. OTC options also involve greater liquidity risk. This risk may be increased in times of financial stress, if the trading market for OTC derivative contracts becomes
limited.
In carrying out its option strategy, the Fund may write index call options on the Nasdaq 100 Index and other broad-based indices and may, if the Fund’s
sub-adviser deems conditions appropriate, write call options on a variety of other equity market indices. As the seller of an index call option, the Fund receives a premium from the purchaser. The purchaser of the index call option has the right to
any appreciation in the value of the index over the exercise price upon the exercise of the call option or the expiration date. If, at expiration, the purchaser exercises the index option sold by the Fund, the Fund will pay the purchaser the
difference between the cash value of the index and the exercise price of the index option. The premium, the exercise price and the market value of the index determine the gain or loss realized by the Fund as the seller of the index call option.
The Fund may also write call options on custom baskets of securities. A custom basket call option is an OTC option with a counterparty whose value is linked to the market
value of a portfolio of underlying securities and is collateralized by a portion of the Fund’s equity portfolio. In designing the custom basket call options, the Fund’s sub-adviser will primarily select assets not held by the Fund. In
order to minimize the difference between the returns of the underlying securities in the custom basket (commonly referred to as a tracking error), the Fund’s sub-adviser will use optimization calculations when selecting the individual
securities for inclusion in the custom basket.
The Fund may also write single name call options, both covered and “naked” or uncovered, on individual
stocks. A call option written by the Fund on an individual security is “covered” if the Fund owns the security underlying the call or has an absolute and immediate right to acquire that security without additional cash consideration. The
Fund, in effect, sells the potential appreciation in the value of the security subject to the call option in exchange for the premium. The Fund may execute a closing purchase transaction with respect to an option it has sold and sell another option
(with either a different exercise price or expiration date or both). The Fund’s objective in entering into such a closing transaction will be to optimize net index option premiums. The cost of a closing transaction may reduce the net option
premiums realized from the sale of the option. This reduction could be offset, at least in part, by appreciation in the value of the underlying security held in the Fund’s equity portfolio, and by the opportunity to realize additional premium
income from selling a new option.
The Fund may also use call spreads as part of its option strategy. A call spread involves the sale of a call option and the
corresponding purchase of a call option on the same underlying instrument with the same expiration date but with different exercise prices. The call spreads utilized by the Fund generally will generate less net option premium than writing calls, but
limit the overall risk of the strategy by capping the Fund’s liability from the written call while simultaneously allowing for additional upside above the strike price of the purchased call.
The Fund may also use put options as part of its option strategy. A put option gives the purchaser of the option the right (but not the obligation) to sell, and the
writer of the option the obligation to buy, the underlying instrument (or the cash value of the index) at a stated price (the “exercise price”) at any time before the option expires. The purchase price for a put option is the
“premium” paid by the purchaser for the right to sell. When the Fund sells a put option on an underlying instrument and the underlying instrument decreases in value, the purchaser of the put option has the right to exercise the option,
obligating the Fund to purchase the underlying instrument at an exercise price that is higher than the prevailing market price. The Fund collects option premium income when it sells the put option. If the underlying instrument increases in value,
the purchaser of the put option is unlikely to exercise the option since the prevailing market price will be higher than the exercise price. Accordingly, the Fund retains all put premium income collected during market advances.
The Fund may invest in U.S. Government securities. U.S. Government securities include (1) U.S. Treasury obligations, which differ in their interest rates, maturities
and times of issuance: U.S. Treasury bills (maturities of one year or less), U.S. Treasury notes (maturities of one year to ten years) and U.S. Treasury bonds (generally maturities of greater than ten years) and (2) obligations issued or
guaranteed by U.S. Government agencies and instrumentalities that are supported by any of the following: (i) the full faith and credit of the U.S. Treasury, (ii) the right of the issuer to borrow an amount limited to a specific line of
credit from the U.S. Treasury, (iii) discretionary authority of the U.S. Government to purchase certain obligations of the U.S. Government agency or instrumentality or (iv) the credit of the agency or instrumentality.
The Fund also may invest in any other security or agreement collateralized or otherwise secured by U.S. Government securities. Agencies and instrumentalities of the U.S.
Government include but are not limited to: Federal Land Banks, Federal Financing Banks, Banks for Cooperatives, Federal Intermediate Credit Banks, Farm Credit Banks, Federal Home Loan Banks, Federal Home Loan Mortgage Corporation, Federal National
Mortgage Association, Government National Mortgage Association, Student Loan Marketing Association, U.S. Postal Service, Small Business
97
Shareholder Update (Unaudited) (continued)
Administration, Tennessee Valley Authority and any other enterprise established or sponsored by the U.S. Government.
Because the U.S. Government generally is not obligated to provide support to its instrumentalities, the Fund will invest in obligations issued by these instrumentalities only if its sub-adviser determines that the credit risk with respect to such
obligations is minimal.
The Fund may invest in commercial paper. Commercial paper represents short-term unsecured promissory notes issued in bearer form by
corporations such as banks or bank holding companies and finance companies.
The Fund may enter into repurchase agreements (the purchase of a security coupled with an
agreement to resell that security at a higher price) with respect to its permitted investments. The Fund’s repurchase agreements will provide that the value of the collateral underlying the repurchase agreement will always be at least equal to
the repurchase price, including any accrued interest earned on the agreement, and will be marked-to-market daily.
The Fund may invest in securities of non-U.S.
issuers that are U.S. dollar-denominated, which may include securities of issuers located, or conducting their business, in emerging market countries. The Fund will classify an issuer of a security as being a U.S. or non-U.S. issuer based on the
determination of an unaffiliated, recognized financial data provider. Such determinations are based on a number of criteria, such as the issuer’s country of domicile, the primary exchange on which the security predominately trades, the location
from which the majority of the issuer’s revenue comes, and the issuer’s reporting currency. Furthermore, a country is considered to be an “emerging market” if it has a relatively low gross national product per capita compared to
the world’s major economies and the potential for rapid economic growth. The Fund considers a country an emerging market country based on the determination of an international organization, such as the IMF, or an unaffiliated, recognized
financial data provider.
The Fund may buy and sell securities on a when-issued or delayed delivery basis, making payment or taking delivery at a later date, normally
within 15 to 45 days of the trade date.
The Fund may invest in illiquid securities (i.e., securities that are not readily marketable), including, but not limited to,
restricted securities (securities the disposition of which is restricted under the federal securities laws), securities that may be resold only pursuant to Rule 144A under the 1933 Act, and repurchase agreements with maturities in excess of seven
days.
The Fund may enter into certain derivative instruments in pursuit of its investment objective, including to seek to enhance return, to hedge certain risks of
its investments in securities or as a substitute for a position in the underlying asset. Such instruments include financial futures contracts and options thereon, swaps (with varying terms, including interest rate swaps and credit default swaps),
options on interest rates, options on indices, options on swaps, options on currencies and other fixed-income derivative instruments that may have the economic effect of leverage.
The Fund may also invest in securities of other open- or closed-end investment companies (including ETFs) that invest primarily in securities of the types in
which the Fund may invest directly, to the extent permitted by the 1940 Act, the rules and regulations issued thereunder and applicable exemptive orders issued by the SEC.
The Fund may lend securities representing up to one-third of the value of its total assets to broker-dealers, banks, and other institutions to generate
additional income. When the Fund loans its portfolio securities, it will receive, at the inception of each loan, cash collateral equal to at least 102% of the value of the loaned securities. Under the Fund’s securities lending agreement, the
securities lending agent will generally bear the risk that a borrower may default on its obligation to return loaned securities. The Fund, however, will be responsible for the risks associated with the investment of cash collateral. The Fund may
lose money on its investment of cash collateral or may fail to earn sufficient income on its investment to meet its obligations to the borrower.
Use of Leverage
As a non-fundamental policy, the Fund will not leverage its capital structure by issuing senior securities such as the issuance of preferred shares of
beneficial interest or debt instruments. However, the Fund may borrow for temporary or emergency purposes and may enter into certain derivatives transactions that have the economic effect of leverage.
Temporary Defensive Periods
During temporary defensive periods the Fund may
deviate from its investment objective and policies, and in order to keep the Fund’s cash fully invested, the Fund may invest any portion of its Managed Assets in investment grade debt securities, including obligations issued or guaranteed by
the U.S. government, its agencies and instrumentalities. The Fund may not achieve its investment objective during such periods.
98
NUVEEN CORE EQUITY ALPHA FUND (JCE)
Investment Objective
The Fund’s investment objective is to provide an
attractive level of total return. The Fund seeks to achieve its investment objective primarily through long term capital appreciation and secondarily through income and gains.
Investment Policies
Under normal circumstances, the Fund will invest at least
80% of its Assets (as defined below) in the Equity Portfolio (as defined below).
The Fund invests in a portfolio of actively managed large capitalization U.S. common
stocks, using the sub-adviser’s proprietary quantitative process designed to provide the potential for long-term outperformance (the “Equity Portfolio”). Additionally, the Fund seeks to reduce the volatility of its returns relative to
the returns of the Equity Portfolio over extended periods by writing (selling) index call options and/or call options on custom baskets of securities (the “Options Strategy”).
“Assets” means net assets of the Fund plus the amount of any borrowings for investment purposes. “Managed Assets” mean the total assets of the Fund,
minus the sum of its accrued liabilities (other than Fund liabilities incurred for the express purpose of creating leverage). Total assets for this purpose shall include assets attributable to the Fund’s use of leverage (whether or not those
assets are reflected in the Fund’s financial statements for purposes of generally accepted accounting principles), and derivatives will be valued at their market value.
Under normal market conditions:
| |
· |
|
The notional value of the call options written by the Fund under its Options Strategy may be up to 50% of the value of the
Fund’s Managed Assets. |
| |
· |
|
The Fund intends to limit the overlap between the stocks held in the Equity Portfolio and the stocks underlying the
Fund’s call options to less than 70% (generally based on the value of such components). |
| |
· |
|
The Fund may invest up to 10% of is Managed Assets in securities of other open- or closed-end investment companies
(including ETFs) that invest primarily in securities of the types in which the Fund may invest directly. In addition, the Fund may invest a portion of its Managed Assets in pooled investment vehicles (other than investment companies) that invest
primarily in securities of the types in which the Fund may invest directly. |
The foregoing policies apply only at the time of any new investment.
Approving Changes in Investment Policies
The Board of Trustees of the Fund
may change the policies described above without a shareholder vote. However, with respect to the Fund’s policy of investing at least 80% of its Assets in the Equity Portfolio, such policy may not be changed without 60 days’ prior written
notice to shareholders.
Portfolio Contents
The Fund generally invests in a
portfolio of common stocks. Common stock generally represents an equity ownership interest in an issuer, without preference over and with a lower priority than any other class of securities, including such issuer’s debt securities, preferred
stock and other senior equity securities. Common stocks usually carry voting rights and earn dividends. Common stocks fluctuate in price in response to many factors including historical and prospective earnings of the issuer, the value of its
assets, general economic conditions, interest rates, investor perceptions and market liquidity, as such the company may or may not pay dividends. Dividends on common stocks are declared at the discretion of the company’s board. In addition,
common stock generally has the greatest appreciation and depreciation potential because increases and decreases in earnings are usually reflected in a company’s stock price.
The Fund implements its Option Strategy by writing (selling) index call options and call options on custom baskets of securities.
An option contract is a contract that gives the holder of the option, in return for a premium, the right to buy from (in the case of a call) or sell to (in the case of a
put) the writer of the option the reference instrument underlying the option (or the cash value of the index) at a specified exercise price at any time during the term of the option. The writer of an option on a security has the obligation upon
exercise of the option to deliver the reference instrument (or the cash) upon payment of the exercise price or to pay the exercise price upon delivery of the reference instrument (or the cash). Upon exercise of an index option, the writer of an
option on an index is obligated to pay the difference between the cash value of the index and the exercise price multiplied by the specified multiplier for the index option. Options may be “covered,” meaning that the party required to
deliver the reference instrument if the option is exercised owns that instrument (or has set aside sufficient assets to meet its obligation to deliver the instrument). Options may be listed on an exchange or traded in the OTC market. In
general, exchange-traded options have standardized exercise prices and expiration dates and may require the parties to post margin against their obligations, and the performance of the parties’ obligations in connection with such options is
guaranteed by the exchange or a related clearing corporation. OTC options have more flexible terms negotiated between the buyer and the seller, but generally are subject to counterparty risk. The ability of the Fund to transact business with
any one or any
99
Shareholder Update (Unaudited) (continued)
number of counterparties, the lack of any independent evaluation of the counterparties or their financial capabilities,
and the absence of a regulated market to facilitate settlement, may increase the potential for losses to the Fund. OTC options also involve greater liquidity risk. This risk may be increased in times of financial stress, if the trading
market for OTC derivative contracts becomes limited. The staff of the SEC takes the position that certain purchased OTC options, and assets used as cover for certain written OTC options, are illiquid.
The Fund writes index call options on broad-based indices and may, if the sub-adviser deems conditions appropriate, write call options on a variety of other equity market
indices. As the seller of an index call option, the Fund receives a premium from the purchaser. The purchaser of the index call option has the right to any appreciation in the value of the index over the exercise price upon the exercise of the call
option or the expiration date. If, at expiration, the purchaser exercises the index option sold by the Fund, the Fund will pay the purchaser the difference between the cash value of the index and the exercise price of the index option. The premium,
the exercise price and the market value of the index determine the gain or loss realized by the Fund as the seller of the index call option.
The Fund may also write
call options on custom baskets of securities. A custom basket call option is an OTC option with a counterparty whose value is linked to the market value of a portfolio of underlying securities and is collateralized by a portion of the Fund’s
Equity Portfolio. In order to minimize the difference between the returns of the underlying securities in the custom basket (commonly referred to as a tracking error), the sub-adviser will use optimization calculations when selecting the individual
securities for inclusion in the custom basket.
In addition to the use of call options as described above, the Fund may enter into certain derivative instruments in
pursuit of its investment objective, including to seek to enhance return, to hedge certain risks of its investments or as a substitute for a position in the underlying asset. Such instruments include options, futures contracts, index futures and
total return swaps. In addition, the Fund may invest in other types of derivative instruments that are currently non-principal investments, including forward contracts, interest rate swaps, caps, collars and floors, credit default swaps, and swap
options.
The Fund may enter into repurchase agreements (the purchase of a security coupled with an agreement to resell that security at a higher price) with respect
to its permitted investments. The Fund’s repurchase agreements will provide that the value of the collateral underlying the repurchase agreement will always be at least equal to the repurchase price, including any accrued interest earned on the
agreement, and will be marked-to-market daily.
The Fund may invest in illiquid securities (i.e., securities that are not readily marketable), including,
but not limited to, restricted securities (securities the disposition of which is restricted under the federal securities laws), securities that may be resold only pursuant to Rule 144A under the 1933 Act, and repurchase agreements with maturities
in excess of seven days.
The Fund may buy and sell securities on a when-issued or delayed delivery basis, making payment or taking delivery at a later date, normally
within 15 to 45 days of the trade date.
The Fund may lend securities representing up to one-third of the value of its total assets to broker-dealers,
banks, and other institutions to generate additional income. When the Fund loans its portfolio securities, it will receive, at the inception of each loan, cash collateral equal to at least 102% of the value of the loaned securities. Under the
Fund’s securities lending agreement, the securities lending agent will generally bear the risk that a borrower may default on its obligation to return loaned securities. The Fund, however, will be responsible for the risks associated with the
investment of cash collateral. The Fund may lose money on its investment of cash collateral or may fail to earn sufficient income on its investment to meet its obligations to the borrower.
Use of Leverage
As a non-fundamental policy, the Fund will not
leverage its capital structure by issuing senior securities such as the issuance of preferred shares of beneficial interest or debt instruments. The Fund may, however, borrow up to 7.5% of its Managed Assets for cash management purposes. In
addition, the Fund may borrow for temporary or emergency purposes and may enter into certain derivatives transactions that have the economic effect of leverage by creating additional investment exposure.
Temporary Defensive Periods
During temporary defensive periods the Fund may
deviate from its investment objective and policies, and in order to keep the Fund’s cash fully invested, the Fund may invest up to 100% of its Managed Assets in investment grade debt securities, including obligations issued or guaranteed by the
U.S. government, its agencies and instrumentalities. The Fund may not achieve its investment objective during such periods.
100
PRINCIPAL RISKS OF THE FUNDS
The factors that are most likely to have a material effect on a particular Fund’s portfolio as a whole are called “principal risks.” Each Fund is subject
to the principal risks indicated below, whether through direct investment or derivative positions. Each Fund may be subject to additional risks other than those identified and described below because the types of investments made by a Fund can
change over time.
|
|
|
|
|
|
|
|
|
|
|
| Risk |
|
BXMX |
|
DIAX |
|
SPXX |
|
QQQX |
|
JCE |
| |
|
|
|
|
|
| Portfolio Level Risks |
|
|
|
|
|
|
|
|
|
|
| Call Option Risk |
|
X |
|
X |
|
X |
|
X |
|
X |
| Call Spreads Risk |
|
X |
|
X |
|
X |
|
X |
|
- |
| Common Stock Risk |
|
X |
|
X |
|
X |
|
X |
|
X |
| Concentration Risk |
|
X |
|
X |
|
X |
|
X |
|
- |
| Counterparty Risk |
|
X |
|
X |
|
X |
|
X |
|
X |
| Deflation Risk |
|
X |
|
X |
|
X |
|
X |
|
X |
| Derivatives Risk |
|
X |
|
X |
|
X |
|
X |
|
X |
| Dividend Income Risk |
|
X |
|
X |
|
X |
|
X |
|
X |
| Frequent Trading Risk |
|
- |
|
- |
|
- |
|
- |
|
X |
| Financial Services Sector Risk |
|
- |
|
X |
|
X |
|
- |
|
X |
| Hedging Risk |
|
X |
|
X |
|
X |
|
X |
|
X |
| Illiquid Investments Risk |
|
X |
|
X |
|
X |
|
X |
|
- |
| Inflation Risk |
|
X |
|
X |
|
X |
|
X |
|
X |
| Information Technology Sector Risk |
|
X |
|
- |
|
X |
|
- |
|
- |
| Large -Cap Company Risk |
|
X |
|
X |
|
X |
|
X |
|
X |
| Non-U.S. Securities Risk |
|
X |
|
X |
|
X |
|
X |
|
- |
| Option Strategy Risk |
|
X |
|
X |
|
X |
|
X |
|
X |
| Other Investment Companies Risk |
|
X |
|
X |
|
X |
|
X |
|
X |
| Put Option Risk |
|
X |
|
X |
|
X |
|
X |
|
- |
| Quantitative Analysis Risk |
|
- |
|
- |
|
- |
|
- |
|
X |
| Swap Transactions Risk |
|
X |
|
X |
|
X |
|
X |
|
X |
| Technology Company Investment Risk |
|
- |
|
- |
|
- |
|
X |
|
- |
| Valuation Risk |
|
X |
|
X |
|
X |
|
X |
|
X |
|
|
|
|
|
|
| Risk |
|
BXMX |
|
DIAX |
|
SPXX |
|
QQQX |
|
JCE |
| |
|
|
|
|
|
| Fund Level and Other Risks |
|
|
|
|
|
|
|
|
|
|
| Anti-Takeover Provisions |
|
X |
|
X |
|
X |
|
X |
|
X |
| Borrowing Risk |
|
X |
|
X |
|
X |
|
X |
|
X |
| Cybersecurity Risk |
|
X |
|
X |
|
X |
|
X |
|
X |
| Global Economic Risk |
|
X |
|
X |
|
X |
|
X |
|
X |
| Investment and Market Risk |
|
X |
|
X |
|
X |
|
X |
|
X |
| Legislation and Regulatory Risk |
|
X |
|
X |
|
X |
|
X |
|
X |
| Market Discount from Net Asset Value |
|
X |
|
X |
|
X |
|
X |
|
X |
| Non-Diversified Status Risk |
|
- |
|
X |
|
- |
|
X |
|
- |
| Not an Index Fund |
|
X |
|
X |
|
X |
|
X |
|
- |
| Recent Market Conditions |
|
X |
|
X |
|
X |
|
X |
|
X |
| Fund Tax Risk |
|
X |
|
X |
|
X |
|
X |
|
X |
101
Shareholder Update (Unaudited) (continued)
Portfolio Level Risks:
Call Option Risk. As the writer of a call option, the Fund foregoes, during the option’s life, the opportunity to profit from increases in the market value of
the instrument underlying the call option above the sum of the premium and the strike price of the option, but will retain the risk of loss should the market value of the instrument underlying the call option decline. The purchaser of the call
option has the right to any appreciation in the value of the underlying instrument over the exercise price upon the exercise of the call option or the expiration date. As the Fund increases the option overlay percentage, its ability to benefit from
capital appreciation becomes more limited and the risk of NAV erosion increases. If the Fund experiences NAV erosion, which itself may have a negative effect on the market price of the Fund’s shares, the Fund will have a reduced asset base over
which to write call options, which may eventually lead to reduced distributions to shareholders.
In addition, because the exercise of index options is settled in
cash, sellers of index call options, such as the Fund, cannot provide in advance for their potential settlement obligations by acquiring and holding the underlying securities. The Fund bears a risk that the value of the securities held by the Fund
will vary from the value of the underlying index and relative to the written index call option positions. Accordingly, the Fund may incur losses on the index call options that it has sold that exceed gains on the Fund’s equity portfolio. The
value of index options written by the Fund, which will be priced daily, will be affected by changes in the value of and dividend rates of the underlying common stocks in the index, changes in the actual or perceived volatility of the stock market
and the remaining time to the options’ expiration. The value of the index options also may be adversely affected if the market for the index options becomes less liquid or smaller.
Call Spreads Risk. The Fund may enter into call spreads. A call spread involves the sale of a call option and the corresponding purchase of a call option on the
same underlying instrument with the same expiration date but with different strike prices. The Fund may not be able to enter into (or close out of) these transactions, at times or in the quantities desired by the sub-adviser. The Fund also may not
be able to enter into (or close out of) these transactions because of, among other things, the lack of market participants that are willing to take contrary positions to that of the Fund.
Common Stock Risk. Common stocks have experienced significantly more volatility in returns and may significantly underperform relative to fixed-income securities
during certain periods. An adverse event, such as an unfavorable earnings report, may depress the value of a particular common stock held by the Fund. Also, the price of common stocks is sensitive to general movements in the stock market, and a drop
in the stock market may depress the price of common stocks to which the Fund has exposure. Common stock prices fluctuate for several reasons, including changes in investors’ perceptions of the financial condition of an issuer, the general
condition of the relevant stock market or the current and expected future conditions of the broader economy, or when political or economic events affecting the issuer in particular or the stock market in general occur. In addition, common stock
prices may be particularly sensitive to rising interest rates, as the cost of capital rises and borrowing costs increase.
Concentration Risk. The Fund’s
investments are concentrated in issuers of one or a few specific economic sectors, so the Fund may be subject to more risks than if it were broadly diversified across the economy.
Counterparty Risk. The Fund will be subject to credit risk with respect to the counterparties to the derivative transactions entered into by the Fund. Changes in
the credit quality of the companies that serve as the Fund’s counterparties with respect to derivatives transactions may affect the value of those instruments. Because certain derivative transactions in which the Fund may engage may be traded
between counterparties based on contractual relationships, the Fund is subject to the risk that a counterparty will not perform its obligations under the related contracts. If a counterparty becomes bankrupt or otherwise becomes unable to perform
its obligations due to financial difficulties the Fund may sustain losses (including the full amount of its investment), may be unable to liquidate a derivatives position or may experience significant delays in obtaining any recovery in bankruptcy
or other reorganization proceedings. By entering into derivatives transactions, the Fund assumes the risk that its counterparties could experience such financial hardships. Although the Fund intends to enter into transactions only with
counterparties that the sub-adviser believes to be creditworthy, there can be no assurance that a counterparty will not default and that the Fund will not sustain a loss on a transaction. In the event of a counterparty’s bankruptcy or
insolvency, any collateral posted by the Fund in connection with a derivatives transaction may be subject to the conflicting claims of that counterparty’s creditors, and the Fund may be exposed to the risk of a court treating the Fund as a
general unsecured creditor of the counterparty, rather than as the owner of the collateral.
Deflation Risk. Deflation risk is the risk that prices throughout
the economy decline over time. Deflation may have an adverse effect on the creditworthiness of issuers and may make issuer default more likely, which may result in a decline in the value of the Fund’s portfolio.
Derivatives Risk. The use of derivatives involves additional risks and transaction costs which could leave the Fund in a worse position than if it had not used
these instruments. Derivative instruments can be used to acquire or to transfer the risk and returns of a security or other asset without buying or selling the security or asset. These instruments may entail investment exposures that are greater
than their cost would suggest. As a result, a small investment in derivatives can result in losses that greatly exceed the original investment. Derivatives can be highly volatile, illiquid and difficult to value. An over-the-counter derivative
transaction between the Fund and a counterparty that is not cleared through a central counterparty also involves the risk that a loss may be sustained as a result of the failure of the counterparty to the contract to make required payments. The
payment obligation for a cleared derivative transaction is guaranteed by a central counterparty, which exposes the Fund to the creditworthiness of the central counterparty. The use of certain derivatives involves leverage, which can cause the
Fund’s portfolio to be more volatile than if the portfolio had not been leveraged. Leverage can significantly magnify the effect of price movements of the reference asset, disproportionately increasing the Fund’s losses and reducing the
Fund’s opportunities for gains when the reference asset changes in unexpected ways. In some instances, such leverage could result in losses that exceed the original amount invested.
It is possible that regulatory or other developments in the derivatives market, including changes in government regulation could adversely impact the Fund’s ability
to invest in certain derivatives successfully use derivative instruments.
102
Dividend Income Risk. A portion of the net investment income paid by the Fund to its shareholders is derived from
dividends it receives from the common stocks held in the Fund’s equity portfolio. Dividends paid on securities held by the Fund can vary significantly over the short-term and long-term. Dividends on common stocks are not fixed, but are declared
at the discretion of an issuer’s board of directors. There is no guarantee that the issuers of common stocks in which the Fund invests will declare dividends in the future or that if declared they will remain at current levels or increase over
time.
Frequent Trading Risk. In pursuing its investment objective, the Fund may engage in trading that results in a high portfolio turnover rate, which may
vary greatly from year to year, as well as within a given year. A higher portfolio turnover rate may result in correspondingly greater transactional expenses that are borne by the Fund. Such expenses may include bid-ask spreads, dealer mark-ups, and
other transactional costs on the sale of securities and reinvestment in other securities, and may result in the realization of taxable capital gains (including short-term gains, which are generally taxed for federal income tax purposes to
shareholders as ordinary income when distributed). These costs, which are not reflected in annual fund operating expenses or in the example thereunder, may affect the Fund’s performance.
Hedging Risk. The Fund’s use of derivatives or other transactions to reduce risk involves costs and will be subject to the investment adviser’s and/or
the sub-adviser’s ability to predict correctly changes in the relationships of such hedge instruments to the Fund’s portfolio holdings or other factors. No assurance can be given that the investment adviser’s and/or the
sub-adviser’s judgment in this respect will be correct, and no assurance can be given that the Fund will enter into hedging or other transactions at times or under circumstances in which it may be advisable to do so. Hedging activities may
reduce the Fund’s opportunities for gain by offsetting the positive effects of favorable price movements and may result in net losses.
Illiquid
Investments Risk. Illiquid investments are investments that are not readily marketable. These investments may include restricted investments, including Rule 144A securities, which cannot be resold to the public without an effective registration
statement under the 1933 Act, or, if they are unregistered may be sold only in a privately negotiated transaction or pursuant to an available exemption from registration. The Fund may not be able to readily dispose of such investments at prices that
approximate those at which the Fund could sell the investments if they were more widely traded and, as a result of such illiquidity, the Fund may have to sell other investments or engage in borrowing transactions if necessary to raise cash to meet
its obligations. Limited liquidity can also affect the market price of investments, thereby adversely affecting the Fund’s NAV and ability to make dividend distributions. The financial markets in general have in recent years experienced periods
of extreme secondary market supply and demand imbalance, resulting in a loss of liquidity during which market prices were suddenly and substantially below traditional measures of intrinsic value. During such periods, some investments could be sold
only at arbitrary prices and with substantial losses. Periods of such market dislocation may occur again at any time.
Inflation Risk. Inflation risk is the
risk that the value of assets or income from investments will be worth less in the future as inflation decreases the value of money. As inflation increases, the real value of the common shares and distributions can decline. Currently, inflation
rates are elevated relative to normal market conditions and could increase.
Information Technology Sector Risk. The Fund currently invests a significant
portion of its assets in the information technology sector, although this may change over time. The information technology sector can be significantly affected by changes in, among other things, the supply and
demand for specific products and services, the pace of technological development and product obsolescence, market competition, government regulation, and patent and intellectual property rights.
Large-Cap Company Risk. While large-cap companies may be less volatile than those of mid-and small-cap companies, they still involve risk. To the extent the Fund
invests in large-capitalization securities, the Fund may underperform funds that invest primarily in securities of smaller capitalization companies during periods when the securities of such companies are in favor. Large-capitalization companies may
be unable to respond as quickly as smaller capitalization companies to competitive challenges or to changes in business, product, financial or other market conditions.
Non-U.S. Securities Risk. Investments in securities of non-U.S. issuers involve special risks, including: less publicly available information about non-U.S.
issuers or markets due to less rigorous disclosure or accounting standards or regulatory practices; many non-U.S. markets are smaller, less liquid and more volatile; the economies of non-U.S. countries may grow at slower rates than expected or may
experience a downturn or recession; the impact of economic, political, social or diplomatic events; possible seizure of a company’s assets; restrictions imposed by foreign countries limiting the ability of foreign issuers to make payments of
principal and/or interest due to blockages of foreign currency exchanges or otherwise; and withholding and other non-U.S. taxes may decrease the Fund’s return. These risks are more pronounced to the extent that the Fund invests a significant
amount of its assets in issuers located in one region.
Option Strategy Risk. The value of call options sold (written) by the Fund will fluctuate. The Fund may
not participate in any appreciation of its portfolio as fully as it would if the Fund did not sell call options. In addition, the Fund will continue to bear the risk of declines in the value of its portfolio. In employing the Fund’s option
strategy, the sub-adviser seeks to reduce downside risk and volatility of the Fund’s equity portfolio. This strategy may not protect against market declines and may limit the Fund’s participation in market gains, particularly during
periods when market values are increasing. This strategy may increase the Fund’s portfolio transaction costs, which could result in losses or reduce gains, and may not be successful.
Other Investment Companies Risk. The Fund may invest in the securities of other investment companies, including ETFs. Investing in an investment company exposes
the Fund to all of the risks of that investment company’s investments. The Fund, as a holder of the securities of other investment companies, will bear its pro rata portion of the other investment companies’ expenses, including advisory
fees. These expenses are in addition to the direct expenses of the Fund’s own operations. As a result, the cost of investing in investment company shares may exceed the costs of investing directly in its underlying investments. In addition,
securities of other investment companies may be leveraged. As a result, the Fund may be indirectly exposed to leverage through an investment in such securities and therefore magnify the Fund’s leverage risk.
103
Shareholder Update (Unaudited) (continued)
With respect to ETF’s, an ETF that is based on a specific index may not be able to replicate and maintain exactly
the composition and relative weighting of securities in the index. The value of an ETF based on a specific index is subject to change as the values of its respective component assets fluctuate according to market volatility. ETFs typically rely on a
limited pool of authorized participants to create and redeem shares, and an active trading market for ETF shares may not develop or be maintained. The market value of shares of ETFs and closed-end funds may differ from their NAV.
Put Option Risk. By writing put options, the Fund takes on the risk of declines in the value of the underlying instrument, including the possibility of a loss up
to the entire strike price of each option it sells but without the corresponding opportunity to benefit from potential increases in the value of the underlying instrument. When the Fund writes a put option, it assumes the risk that it must purchase
the underlying instrument at a strike price that may be higher than the market price of the instrument. If there is a broad market decline and the Fund is not able to close out its written put options, it may result in substantial losses to the
Fund. The Fund will receive a premium from writing options, but the premium received may not be sufficient to offset any losses sustained from exercised put options.
Quantitative Analysis Risk. The risk that stocks selected using quantitative modeling and analysis could perform differently from the market as a whole and the
risk that such quantitative analysis and modeling may not adequately take into account certain factors, may contain design flaws or inaccurate assumptions and may rely on inaccurate data inputs, which may result in losses to the Fund.
Swap Transactions Risk. The Fund may enter into derivative instruments such as swap contracts, credit default swaps, interest rate swaps and forward contracts.
Like most derivative instruments, the use of swaps is a highly specialized activity that involves investment techniques and risks different from those associated with ordinary portfolio securities transactions. In addition, the use of swaps requires
an understanding by the investment adviser and/or the sub-adviser of not only the referenced asset, rate or index, but also of the swap itself. If the investment adviser and/ or the sub-adviser is incorrect in its forecasts of default risks, market
spreads or other applicable factors or events, the investment performance of the Fund would diminish compared with what it would have been if these techniques were not used.
Technology Company Investment Risk. A substantial portion of the securities represented in the applicable index are in the technology sector. As a result, the Fund
may invest a substantial portion of its assets in technology companies. The market prices of technology-related stocks tend to exhibit a greater degree of market risk and price volatility than other types of investments. These stocks may fall in and
out of favor with investors rapidly, which may cause sudden selling and dramatically lower market prices. Technology stocks also may be affected adversely by changes in technology, consumer and business purchasing patterns, government regulation
and/or obsolete products or services.
Valuation Risk. The securities in which the Fund invests typically are valued by a pricing service utilizing a range of
market-based inputs and assumptions, including readily available market quotations obtained from broker-dealers making markets in such instruments, cash flows and transactions for comparable instruments. There is no assurance that the Fund will be
able to sell a portfolio security at the price established by the pricing service, which could result in a loss to the Fund. Pricing services generally price securities assuming orderly transactions of an institutional “round lot” size,
but some trades may occur in smaller, “odd lot” sizes, often at lower prices than institutional round lot trades. Different pricing services may incorporate different assumptions and inputs into their valuation methodologies, potentially
resulting in different values for the same securities. As a result, if the Fund were to change pricing services, or if the Fund’s pricing service were to change its valuation methodology, there could be a material impact, either positive or
negative, on the Fund’s NAV.
Fund Level and Other Risks:
Anti-Takeover Provisions. The Fund’s organizational documents include provisions that could limit the ability of other entities or persons to acquire control
of the Fund or convert the Fund to open-end status.
Borrowing Risk. The Fund may borrow for temporary or emergency purposes. Borrowing may exaggerate changes
in the NAV of the Fund’s shares and may affect the Fund’s net income. When the Fund borrows money, it must pay interest and other fees, which will reduce the Fund’s returns if such costs exceed the returns on the portfolio securities
purchased or retained with such borrowings. Any such borrowings are intended to be temporary. However, under certain market circumstances, such borrowings might be outstanding for longer periods of time.
Cybersecurity Risk. The Fund and its service providers are susceptible to operational and information security risk resulting from cyber incidents. Cyber incidents
refer to both intentional attacks and unintentional events including: processing errors, human errors, technical errors including computer glitches and system malfunctions, inadequate or failed internal or external processes, market-wide
technical-related disruptions, unauthorized access to digital systems (through “hacking” or malicious software coding), computer viruses, and cyber-attacks which shut down, disable, slow or otherwise disrupt operations, business processes
or website access or functionality (including denial of service attacks). Cyber incidents could adversely impact the Fund and cause the Fund to incur financial loss and expense, as well as face exposure to regulatory penalties, reputational damage,
and additional compliance costs associated with corrective measures. In addition, substantial costs may be incurred in order to prevent any cyber incidents in the future. Furthermore, the Fund cannot control the cybersecurity plans and systems put
in place by its service providers or any other third parties whose operations may affect the Fund.
Global Economic Risk. National and regional economies and
financial markets are becoming increasingly interconnected, which increases the possibilities that conditions in one country, region or market might adversely impact issuers in a different country, region or market. Changes in legal, political,
regulatory, tax and economic conditions may cause fluctuations in markets and assets prices around the world, which could negatively impact the value of the Fund’s investments. Major economic or political disruptions, particularly in large
economies like China’s, may have global negative economic and market repercussions. Additionally, instability in various countries, such as Afghanistan and Syria, war, natural and environmental disasters and the spread of infectious illnesses
or other public health emergencies , terrorist attacks in the United States and around the world, growing social and political discord in the United States, the European debt crisis, the response of the international community—through economic
sanctions and otherwise—to international events, further downgrade of U.S. government securities, changes in the U.S. president or political shifts in Congress and other similar events may adversely affect the global economy and the markets and
issuers in which the Fund invests. Recent examples of such events include Hamas’ attack on Israel in October 2023 and the ensuing conflict, the outbreak of a novel coronavirus known
104
as COVID-19 that was first detected in China in December 2019 and heightened concerns regarding North Korea’s
nuclear weapons and long-range ballistic missile programs. In addition, Russia’s invasion of Ukraine in February 2022 has resulted in sanctions imposed by several nations, such as the United States, United Kingdom, European Union and Canada.
The current sanctions and potential further sanctions may negatively impact certain sectors of Russia’s economy, but also may negatively impact the value of the Fund’s investments that do not have direct exposure to Russia. These events
could reduce consumer demand or economic output, result in market closure, travel restrictions or quarantines, and generally have a significant impact on the global economy. These events could also impair the information technology and other
operational systems upon which the Fund’s service providers, including the Fund’s sub-adviser, rely, and could otherwise disrupt the ability of employees of the Fund’s service providers to perform essential tasks on behalf of the
Fund.
The Fund does not know and cannot predict how long the securities markets may be affected by these events and the future impact of these and similar events on
the global economy and securities markets is uncertain. The Fund may be adversely affected by abrogation of international agreements and national laws which have created the market instruments in which the Fund may invest, failure of the designated
national and international authorities to enforce compliance with the same laws and agreements, failure of local, national and international organizations to carry out the duties prescribed to them under the relevant agreements, revisions of these
laws and agreements which dilute their effectiveness or conflicting interpretation of provisions of the same laws and agreements.
Governmental and quasi-governmental
authorities and regulators throughout the world have in the past responded to major economic disruptions with a variety of significant fiscal and monetary policy changes, including but not limited to, direct capital infusions into companies, new
monetary programs and dramatically lower interest rates. An unexpected or quick reversal of these policies, or the ineffectiveness of these policies, could increase volatility in securities markets, which could adversely affect the Fund’s
investments.
Investment and Market Risk. An investment in common shares is subject to investment risk, including the possible loss of the entire principal
amount that you invest. Common shares frequently trade at a discount to their NAV. An investment in common shares represents an indirect investment in the securities owned by the Fund. Common shares at any point in time may be worth less than your
original investment, even after taking into account the reinvestment of Fund dividends and distributions.
Legislation and Regulatory Risk. At any time after
the date of this report, legislation or additional regulations may be enacted that could negatively affect the assets of the Fund, securities held by the Fund or the issuers of such securities. Fund shareholders may incur increased costs resulting
from such legislation or additional regulation. There can be no assurance that future legislation, regulation or deregulation will not have a material adverse effect on the Fund or will not impair the ability of the Fund to achieve its investment
objectives.
Market Discount from Net Asset Value. Shares of closed-end investment companies like the Fund frequently trade at prices lower than their NAV.
This characteristic is a risk separate and distinct from the risk that the Fund’s NAV could decrease as a result of investment activities. Whether investors will realize gains or losses upon the sale of the common shares will depend not upon
the Fund’s NAV but entirely upon whether the market price of the common shares at the time of sale is above or below the investor’s purchase price for the common shares. Furthermore, management may have difficulty meeting the Fund’s
investment objectives and managing its portfolio when the underlying securities are redeemed or sold during periods of market turmoil and as investors’ perceptions regarding closed-end funds or their underlying investments change. Because the
market price of the common shares will be determined by factors such as relative supply of and demand for the common shares in the market, general market and economic circumstances, and other factors beyond the control of the Fund, the Fund cannot
predict whether the common shares will trade at, below or above NAV. The common shares are designed primarily for long-term investors, and you should not view the Fund as a vehicle for short-term trading purposes.
Non-Diversified Status Risk. Because the Fund is classified as “non-diversified” under the 1940 Act, it can invest a greater portion of its assets
in obligations of a single issuer than a “diversified” fund. As a result, the Fund will be more susceptible than a diversified fund to fluctuations in the prices of securities of a single issuer.
Not an Index Fund. The Fund is not, nor is it intended to be, an index fund. As a result, the performance of the Fund will differ from the performance of the index
as a whole for various reasons, including the fact that the Fund will write call options on a portion of its equity portfolio and the weightings of the securities included in the Fund’s equity portfolio may be different than the weightings of
the common stocks in the index. The Fund, by writing call options on its equity portfolio, will give up the opportunity to benefit from potential increases in the value of the Fund’s equity portfolio above the exercise prices of the options,
but will continue to bear the risk of declines in the value of the Fund’s equity portfolio.
Recent Market Conditions. Periods of unusually high financial
market volatility and restrictive credit conditions, at times limited to a particular sector or geographic area, have occurred in the past and may be expected to recur in the future. Some countries, including the United States, have adopted or have
signaled protectionist trade measures, relaxation of the financial industry regulations that followed the financial crisis, and/ or reductions to corporate taxes. The scope of these policy changes is still developing, but the equity and debt markets
may react strongly to expectations of change, which could increase volatility, particularly if a resulting policy runs counter to the market’s expectations. The outcome of such changes cannot be foreseen at the present time. In addition,
geopolitical and other risks, including environmental and public health risks, may add to instability in the world economy and markets generally. As a result of increasingly interconnected global economies and financial markets, the value and
liquidity of the Fund’s investments may be negatively affected by events impacting a country or region, regardless of whether the Fund invests in issuers located in or with significant exposure to such country or region.
Ukraine has experienced ongoing military conflict, most recently in February 2022 when Russia invaded Ukraine; this conflict may expand and military attacks could occur
elsewhere in Europe. Europe has also been struggling with mass migration from the Middle East and Africa. The ultimate effects of these events and other socio-political or geographical issues are not known but could profoundly affect global
economies and markets. Additionally, in October 2023 armed conflict broke out between Israel and the militant group Hamas after Hamas infiltrated Israel’s southern border
105
Shareholder Update (Unaudited) (continued)
from the Gaza Strip. Israel has since declared war against Hamas and it’s possible that this conflict could
escalate into a greater regional conflict. The ultimate effects of these events and other socio-political or geographical issues are not known but could profoundly affect global economies and markets.
The ongoing trade war between China and the United States, including the imposition of tariffs by each country on the other country’s products, has created a tense
political environment. These actions may trigger a significant reduction in international trade, the oversupply of certain manufactured goods, substantial price reductions of goods and possible failure of individual companies and/or large segments
of China’s export industry, which could have a negative impact on the Fund’s performance. U.S. companies that source material and goods from China and those that make large amounts of sales in China would be particularly vulnerable to an
escalation of trade tensions. Uncertainty regarding the outcome of the trade tensions and the potential for a trade war could cause the U.S. dollar to decline against safe haven currencies, such as the Japanese yen and the euro. Events such as these
and their consequences are difficult to predict and it is unclear whether further tariffs may be imposed or other escalating actions may be taken in the future.
The
U.S. Federal Reserve (the “Fed”) has in the past raised interest rates and has signaled an intention to continue to do so or maintain higher interest rates until current inflation levels re-align with the Fed’s long-term inflation
target. Changing interest rate environments impact the various sectors of the economy in different ways. For example, in March 2023, the Federal Deposit Insurance Corporation (“FDIC”) was appointed receiver for each of Silicon Valley Bank
and Signature Bank, the second- and third-largest bank failures in U.S. history, which failures may be attributable, in part, to rising interest rates. Bank failures may have a destabilizing impact on the broader banking industry or markets
generally.
The impact of these developments in the near- and long-term is unknown and could have additional adverse effects on economies, financial markets and asset
valuations around the world.
Fund Tax Risk. The Fund has elected to be treated and intends to qualify each year as a Regulated Investment Company
(“RIC”) under the Internal Revenue Code of 1986, as amended (the “Code”). As a RIC, the Fund is not expected to be subject to U.S. federal income tax to the extent that it distributes its investment company taxable income and net
capital gains. To qualify for the special tax treatment available to a RIC, the Fund must comply with certain investment, distribution, and diversification requirements. Under certain circumstances, the Fund may be forced to sell certain assets when
it is not advantageous in order to meet these requirements, which may reduce the Fund’s overall return. If the Fund fails to meet any of these requirements, subject to the opportunity to cure such failures under applicable provisions of the
Code, the Fund’s income would be subject to a double level of U.S. federal income tax. The Fund’s income, including its net capital gain, would first be subject to U.S. federal income tax at regular corporate rates, even if such income
were distributed to shareholders and, second, all distributions by the Fund from earnings and profits, including distributions of net capital gain (if any), would be taxable to shareholders as dividends.
106
DIVIDEND REINVESTMENT PLAN
Nuveen Closed-End Funds Automatic Reinvestment Plan
Your Nuveen Closed-End
Fund allows you to conveniently reinvest distributions in additional Fund shares. By choosing to reinvest, you’ll be able to invest money regularly and automatically, and watch your investment grow through the power of compounding. Just like
distributions in cash, there may be times when income or capital gains taxes may be payable on distributions that are reinvested. It is important to note that an automatic reinvestment plan does not ensure a profit, nor does it protect you against
loss in a declining market.
Easy and convenient
To make recordkeeping
easy and convenient, each quarter you’ll receive a statement showing your total distributions, the date of investment, the shares acquired and the price per share, and the total number of shares you own.
How shares are purchased
The shares you acquire by reinvesting will either be
purchased on the open market or newly issued by the Fund. If the shares are trading at or above NAV at the time of valuation, the Fund will issue new shares at the greater of the NAV or 95% of the then-current market price. If the shares are trading
at less than NAV, shares for your account will be purchased on the open market. If Computershare Trust Company, N.A. (the “Plan Agent”) begins purchasing Fund shares on the open market while shares are trading below NAV, but the
Fund’s shares subsequently trade at or above their NAV before the Plan Agent is able to complete its purchases, the Plan Agent may cease open-market purchases and may invest the uninvested portion of the distribution in newly-issued Fund shares
at a price equal to the greater of the shares’ NAV or 95% of the shares’ market value on the last business day immediately prior to the purchase date. Distributions received to purchase shares in the open market will normally be invested
shortly after the distribution payment date. No interest will be paid on distributions awaiting reinvestment. Because the market price of the shares may increase before purchases are completed, the average purchase price per share may exceed the
market price at the time of valuation, resulting in the acquisition of fewer shares than if the distribution had been paid in shares issued by the Fund. A pro rata portion of any applicable brokerage commissions on open market purchases will be paid
by Dividend Reinvestment Plan (the “Plan”) participants. These commissions usually will be lower than those charged on individual transactions.
Flexible
You may change your distribution option or withdraw from the Plan at
any time, should your needs or situation change. You can reinvest whether your shares are registered in your name, or in the name of a brokerage firm, bank, or other nominee. Ask your investment adviser if his or her firm will participate on your
behalf. Participants whose shares are registered in the name of one firm may not be able to transfer the shares to another firm and continue to participate in the Plan. The Fund reserves the right to amend or terminate the Plan at any time. Although
the Fund reserves the right to amend the Plan to include a service charge payable by the participants, there is no direct service charge to participants in the Plan at this time.
Call today to start reinvesting distributions
For more information on the
Nuveen Automatic Reinvestment Plan or to enroll in or withdraw from the Plan, speak with your financial professional or call us at (800) 257-8787.
107
Shareholder Update (Unaudited) (continued)
CHANGES OCCURRING DURING THE FISCAL YEAR
The following information in this annual report is a summary of certain changes during the most recent fiscal year. This information may not reflect all of the changes
that have occurred since you purchased shares of a Fund.
During the most recent fiscal year, there have been no changes required to be reported in connection with:
(i) the Funds’ investment objectives and principal investment policies that have not been approved by shareholders, (ii) the principal risks of the Fund, (iii) the portfolio managers of the Funds; (iv) a Fund’s charter
or by-laws that would delay or prevent a change of control of the Fund that have not been approved by shareholders, except as follows:
Amended
and Restated Bylaws
On October 5, 2020, the Nuveen S&P 500 Buy-Write Income Fund, Nuveen Dow
30SM Dynamic Overwrite Fund, Nuveen S&P 500 Dynamic Overwrite Fund, Nuveen Nasdaq 100 Dynamic Overwrite Fund, and Nuveen Core Equity Alpha Fund (each a “Fund” and collectively the
“Funds”) and certain other closed-end funds in the Nuveen fund complex amended their by-laws. Among other things, the amended by-laws included provisions pursuant to which, in summary, a shareholder who obtains beneficial ownership of
common shares in a Control Share Acquisition (as defined in the by-laws) shall have the same voting rights as other common shareholders only to the extent authorized by the other disinterested shareholders (the “Control Share By-Law”). On
January 14, 2021, a shareholder of certain Nuveen closed-end funds filed a civil complaint in the U.S. District Court for the Southern District of New York (the “District Court”) against certain Nuveen funds and their trustees,
seeking a declaration that such funds’ Control Share By-Laws violate the 1940 Act, rescission of such fund’s Control Share By-Laws and a permanent injunction against such funds applying the Control Share By-Laws. On February 18, 2022,
the District Court granted judgment in favor of the plaintiff’s claim for rescission of such funds’ Control Share By-Laws and the plaintiff’s declaratory judgment claim, and declared that such funds’ Control Share By-Laws violate
Section 18(i) of the 1940 Act. Following review of the judgment of the District Court, on February 22, 2022, the Board amended the Funds’ bylaws to provide that the Funds’ Control Share By-Law shall be of no force and effect for
so long as the judgment of the District Court is effective and that if the judgment of the District Court is reversed, overturned, vacated, stayed, or otherwise nullified, the Fund’s Control Share By-Law will be automatically reinstated and
apply to any beneficial owner of common shares acquired in a Control Share Acquisition, regardless of whether such Control Share Acquisition occurs before or after such reinstatement, for the duration of the stay or upon issuance of the mandate
reversing, overturning, vacating or otherwise nullifying the judgment of the District Court. On February 25, 2022, the Board and the Funds appealed the District Court’s decision to the U.S. Court of Appeals for the Second Circuit. On
November 30, 2023, the U.S. Court of Appeals for the Second Circuit upheld the opinion of the District Court.
Portfolio Managers
Nuveen S&P 500 Buy-Write Income Fund (“BXMX”)
Effective June 30, 2023, Mitchell Trotta has been added as a portfolio manager of BXMX. The day-to-day operation of BXMX and the execution of its specific
investment strategies is the primary responsibility of each of BXMX’s portfolio managers. The biography of Mitchell Trotta is presented below:
| |
· |
|
Mitchell Trotta joined Gateway Investment Advisers, LLC in 2016 and is a Portfolio Manager. Mr. Trotta is actively
involved in the management of several mutual funds advised or sub-advised by the firm, in addition to the firm’s separate account strategies. In his role, Mr. Trotta is responsible for trading, providing analytical work supporting
investment management decisions, and implementing the firm’s equity multi-factor model. Prior to joining Gateway, Mr. Trotta served as an associate for PNC Bank in the Asset Management Group. Mr. Trotta earned his BBA in Finance from the
University of Cincinnati and is a CFA® charterholder. |
108
ADDITIONAL DISCLOSURES FOR CERTAIN FUNDS AS OF THE FISCAL YEAR ENDED DECEMBER 31, 2023
NUVEEN S&P 500 DYNAMIC OVERWRITE FUND (SPXX)
NUVEEN NASDAQ 100 DYNAMIC OVERWRITE FUND (QQQX)
NUVEEN CORE EQUITY ALPHA FUND (JCE)
SUMMARY OF FUND EXPENSES
The purpose of the tables and the examples below are to help you understand all fees and expenses that you, as a common shareholder, would bear directly or
indirectly. The tables show the expenses of each Fund as a percentage of the average net assets applicable to Common Shares and not as a percentage of total assets or managed assets.
|
|
|
|
|
|
|
|
|
|
|
|
|
|
|
|
|
|
|
|
|
| Shareholder Transaction Expenses |
|
SPXX |
|
|
|
|
|
QQQX |
|
|
|
|
|
JCE |
|
| |
|
|
|
|
|
|
|
| Maximum Sales Charge (as a percentage of offering price) |
|
|
4.00% (1) |
|
|
|
|
|
|
|
4.00% (1) |
|
|
|
|
|
|
|
1.00% (2) |
|
|
|
|
|
|
|
| Dividend Reinvestment Plan Fees (3) |
|
|
$2.50 |
|
|
|
|
|
|
|
$2.50 |
|
|
|
|
|
|
|
$2.50 |
|
| |
|
| (1) |
A maximum sales charge of 4.00% applies only to offerings pursuant to a syndicated underwriting. The maximum sales charge
for offerings made at-the-market is 1.00%. There is no sales charge for offerings pursuant to a private transaction. |
| (2) |
The maximum sales charge for offerings made at-the-market is 1.00%. If the Common Shares are sold to or through
underwriters in an offering that is not made at-the-market, the applicable Prospectus Supplement will set forth any other applicable sales load and the estimated offering expenses. Fund shareholders will pay all offering expenses involved with an
offering. |
| (3) |
You will be charged a $2.50 service charge and pay brokerage charges if you direct Computershare Inc. and Computershare
Trust Company, N.A., as agent for the common shareholders, to sell your Common Shares held in a dividend reinvestment account. |
|
|
|
|
|
|
|
|
|
|
|
|
|
| |
|
As a Percentage of Net Assets Attributable
to Common
Shares (1) |
|
| Annual Expenses |
|
SPXX |
|
|
QQQX |
|
|
JCE |
|
| |
|
|
|
|
|
| Management Fees |
|
|
0.82% |
|
|
|
0.83% |
|
|
|
0.91% |
|
|
|
|
|
| Acquired Fund Fees and Expenses |
|
|
0.01% |
|
|
|
0.00% (2) |
|
|
|
0.00% (2) |
|
|
|
|
|
| Other Expenses (3) |
|
|
0.12% |
|
|
|
0.09% |
|
|
|
0.11% |
|
| |
|
|
|
|
|
| Total Annual Expenses |
|
|
0.95% |
|
|
|
0.92% |
|
|
|
1.02% |
|
| |
|
| (1) |
Stated as percentages of average net assets attributable to Common Shares for the fiscal year ended December 31,
2023. |
| (2) |
Expenses attributable to the Fund’s investments, if any, in other investment companies are currently estimated not to
exceed 0.01%. |
| (3) |
Other Expenses are based on estimated amounts for the current fiscal year. |
109
Shareholder Update (Unaudited) (continued)
Examples
The following
examples illustrate the expenses, including the applicable transaction fees (referred to as the “Maximum Sales Charge” in the Shareholder Transaction Expenses table above), if any, that a common shareholder would pay on a $1,000 investment
that is held for the time periods provided in the table. Each example assumes that all dividends and other distributions are reinvested in the Fund and that the Fund’s Annual Expenses, as provided above, remain the same. The examples also
assume a 5% annual return. Actual expenses may be greater or less than those assumed. Moreover, the Fund’s actual rate of return may be greater or less than the hypothetical 5% return shown in the examples.
Example # 1 (At-the-Market Transaction)
The following example assumes a
transaction fee of 1.00%, as a percentage of the offering price.
|
|
|
|
|
|
|
|
|
|
|
|
|
|
|
|
|
|
|
|
|
|
|
| |
|
1 Year |
|
|
|
|
3 Years |
|
|
|
|
5 Years |
|
|
|
|
10 Years |
|
| |
|
|
|
|
|
|
|
|
|
| SPXX |
|
|
$20 |
|
|
|
|
|
$40 |
|
|
|
|
|
$62 |
|
|
|
|
|
$125 |
|
| |
|
|
|
|
|
|
|
|
|
| QQQX |
|
|
$19 |
|
|
|
|
|
$39 |
|
|
|
|
|
$60 |
|
|
|
|
|
$122 |
|
| |
|
|
|
|
|
|
|
|
|
| JCE |
|
|
$20 |
|
|
|
|
|
$42 |
|
|
|
|
|
$66 |
|
|
|
|
|
$134 |
|
| |
|
Example # 2 (Underwriting Syndicate Transaction)
The following example assumes a transaction fee of 4.00%, as a percentage of the offering price.
|
|
|
|
|
|
|
|
|
|
|
|
|
|
|
|
|
|
|
|
|
|
|
| |
|
1 Year |
|
|
|
|
3 Years |
|
|
|
|
5 Years |
|
|
|
|
10 Years |
|
| |
|
|
|
|
|
|
|
|
|
| SPXX |
|
|
$49 |
|
|
|
|
|
$69 |
|
|
|
|
|
$90 |
|
|
|
|
|
$152 |
|
| |
|
|
|
|
|
|
|
|
|
| QQQX |
|
|
$49 |
|
|
|
|
|
$68 |
|
|
|
|
|
$89 |
|
|
|
|
|
$149 |
|
| |
|
Example # 3 (Privately Negotiated Transaction)
The following example assumes there is no transaction fee.
|
|
|
|
|
|
|
|
|
|
|
|
|
|
|
|
|
|
|
|
|
|
|
| |
|
1 Year |
|
|
|
|
3 Years |
|
|
|
|
5 Years |
|
|
|
|
10 Years |
|
| |
|
|
|
|
|
|
|
|
|
| SPXX |
|
|
$10 |
|
|
|
|
|
$30 |
|
|
|
|
|
$53 |
|
|
|
|
|
$117 |
|
| |
|
|
|
|
|
|
|
|
|
| QQQX |
|
|
$9 |
|
|
|
|
|
$29 |
|
|
|
|
|
$51 |
|
|
|
|
|
$113 |
|
| |
|
The examples should not be considered a representation of future expenses. Actual expenses may be greater or less than those shown
above.
110
TRADING AND NET ASSET VALUE INFORMATION
The following table shows for the periods indicated: (i) the high and low market prices for the Common Shares of Nuveen S&P 500 Dynamic Overwrite Fund (SPXX) and
Nuveen Core Equity Alpha Fund (JCE) reported as of the end of the day on the New York Stock Exchange (NYSE) and Nuveen Nasdaq 100 Dynamic Overwrite Fund (QQQX) reported as of the end of the day on the Nasdaq Stock Market LLC (Nasdaq), (ii) the
high and low net asset value (NAV) of the Common Shares, and (iii) the high and low of the premium/(discount) to NAV (expressed as a percentage) of shares of the Common Shares.
SPXX
|
|
|
|
|
|
|
|
|
|
|
|
|
|
|
|
|
|
|
|
|
|
|
|
|
| |
|
Market Price |
|
NAV |
|
Premium/(Discount)
to NAV |
|
|
|
|
|
|
|
| Fiscal Quarter End |
|
High |
|
Low |
|
High |
|
Low |
|
High |
|
Low |
|
|
|
|
|
|
|
| December 2023 |
|
|
$15.09 |
|
|
|
$13.60 |
|
|
|
$16.39 |
|
|
|
$14.93 |
|
|
|
(4.00) |
% |
|
|
(9.53) |
% |
|
|
|
|
|
|
|
| September 2023 |
|
|
$15.90 |
|
|
|
$14.56 |
|
|
|
$16.64 |
|
|
|
$15.39 |
|
|
|
(3.08) |
% |
|
|
(8.88) |
% |
|
|
|
|
|
|
|
| June 2023 |
|
|
$15.83 |
|
|
|
$14.83 |
|
|
|
$16.38 |
|
|
|
$15.42 |
|
|
|
0.70 |
% |
|
|
(5.39) |
% |
|
|
|
|
|
|
|
| March 2023 |
|
|
$16.36 |
|
|
|
$14.81 |
|
|
|
$15.79 |
|
|
|
$14.71 |
|
|
|
8.92 |
% |
|
|
(1.84) |
% |
|
|
|
|
|
|
|
| December 2022 |
|
|
$17.87 |
|
|
|
$15.01 |
|
|
|
$15.63 |
|
|
|
$14.04 |
|
|
|
16.12 |
% |
|
|
6.91 |
% |
|
|
|
|
|
|
|
| September 2022 |
|
|
$16.78 |
|
|
|
$15.01 |
|
|
|
$16.68 |
|
|
|
$14.04 |
|
|
|
7.85 |
% |
|
|
(0.97) |
% |
|
|
|
|
|
|
|
| June 2022 |
|
|
$18.18 |
|
|
|
$14.87 |
|
|
|
$18.18 |
|
|
|
$14.91 |
|
|
|
3.06 |
% |
|
|
(5.42) |
% |
|
|
|
|
|
|
|
| March 2022 |
|
|
$18.82 |
|
|
|
$16.48 |
|
|
|
$18.82 |
|
|
|
$16.80 |
|
|
|
0.95 |
% |
|
|
(4.30) |
% |
QQQX
|
|
|
|
|
|
|
|
|
|
|
|
|
|
|
|
|
|
|
|
|
|
|
|
|
| |
|
Market Price |
|
NAV |
|
Premium/(Discount)
to NAV |
|
|
|
|
|
|
|
| Fiscal Quarter End |
|
High |
|
Low |
|
High |
|
Low |
|
High |
|
Low |
|
|
|
|
|
|
|
| December 2023 |
|
|
$23.53 |
|
|
|
$20.33 |
|
|
|
$24.75 |
|
|
|
$22.13 |
|
|
|
(2.13) |
% |
|
|
(9.22) |
% |
|
|
|
|
|
|
|
| September 2023 |
|
|
$25.19 |
|
|
|
$21.72 |
|
|
|
$24.91 |
|
|
|
$22.72 |
|
|
|
3.21 |
% |
|
|
(6.39) |
% |
|
|
|
|
|
|
|
| June 2023 |
|
|
$25.87 |
|
|
|
$22.95 |
|
|
|
$24.54 |
|
|
|
$22.10 |
|
|
|
6.32 |
% |
|
|
1.90 |
% |
|
|
|
|
|
|
|
| March 2023 |
|
|
$23.98 |
|
|
|
$20.43 |
|
|
|
$22.60 |
|
|
|
$19.29 |
|
|
|
10.16 |
% |
|
|
4.18 |
% |
|
|
|
|
|
|
|
| December 2022 |
|
|
$23.42 |
|
|
|
$20.00 |
|
|
|
$21.49 |
|
|
|
$19.18 |
|
|
|
11.19 |
% |
|
|
2.50 |
% |
|
|
|
|
|
|
|
| September 2022 |
|
|
$25.08 |
|
|
|
$20.51 |
|
|
|
$24.52 |
|
|
|
$19.93 |
|
|
|
3.59 |
% |
|
|
0.00 |
% |
|
|
|
|
|
|
|
| June 2022 |
|
|
$28.77 |
|
|
|
$21.14 |
|
|
|
$27.84 |
|
|
|
$21.28 |
|
|
|
4.18 |
% |
|
|
(1.09) |
% |
|
|
|
|
|
|
|
| March 2022 |
|
|
$30.83 |
|
|
|
$24.79 |
|
|
|
$29.97 |
|
|
|
$24.51 |
|
|
|
3.83 |
% |
|
|
(4.97) |
% |
JCE
|
|
|
|
|
|
|
|
|
|
|
|
|
|
|
|
|
|
|
|
|
|
|
|
|
| |
|
Market Price |
|
NAV |
|
Premium/(Discount)
to NAV |
|
|
|
|
|
|
|
| Fiscal Quarter End |
|
High |
|
Low |
|
High |
|
Low |
|
High |
|
Low |
|
|
|
|
|
|
|
| December 2023 |
|
|
$14.02 |
|
|
|
$11.65 |
|
|
|
$13.49 |
|
|
|
$12.01 |
|
|
|
4.41 |
% |
|
|
(3.00) |
% |
|
|
|
|
|
|
|
| September 2023 |
|
|
$13.16 |
|
|
|
$12.12 |
|
|
|
$13.55 |
|
|
|
$12.40 |
|
|
|
(0.08) |
% |
|
|
(4.44) |
% |
|
|
|
|
|
|
|
| June 2023 |
|
|
$12.90 |
|
|
|
$11.82 |
|
|
|
$13.31 |
|
|
|
$12.43 |
|
|
|
(1.51) |
% |
|
|
(6.39) |
% |
|
|
|
|
|
|
|
| March 2023 |
|
|
$13.54 |
|
|
|
$11.82 |
|
|
|
$12.96 |
|
|
|
$11.90 |
|
|
|
12.46 |
% |
|
|
(3.24) |
% |
|
|
|
|
|
|
|
| December 2022 |
|
|
$16.17 |
|
|
|
$12.12 |
|
|
|
$13.07 |
|
|
|
$11.58 |
|
|
|
30.09 |
% |
|
|
(1.70) |
% |
|
|
|
|
|
|
|
| September 2022 |
|
|
$16.13 |
|
|
|
$11.93 |
|
|
|
$15.10 |
|
|
|
$12.33 |
|
|
|
8.16 |
% |
|
|
(4.56) |
% |
|
|
|
|
|
|
|
| June 2022 |
|
|
$17.45 |
|
|
|
$12.62 |
|
|
|
$16.46 |
|
|
|
$13.07 |
|
|
|
6.86 |
% |
|
|
(5.72) |
% |
|
|
|
|
|
|
|
| March 2022 |
|
|
$18.58 |
|
|
|
$14.69 |
|
|
|
$17.44 |
|
|
|
$15.09 |
|
|
|
7.61 |
% |
|
|
(5.69) |
% |
111
Shareholder Update (Unaudited) (continued)
The following table shows, as of December 31, 2023 each Fund’s: (i) NAV per Common Share,
(ii) market price, (iii) percentage of premium/(discount) to NAV per Common Share and, (iv) net assets attributable to Common Shares.
|
|
|
|
|
|
|
|
|
|
|
|
|
|
|
|
|
|
|
|
|
|
|
| December 31, 2023 |
|
SPXX |
|
|
QQQX |
|
|
JCE |
|
| |
|
|
|
|
|
|
|
|
| NAV per Common Share |
|
|
|
|
|
|
$ 16.29 |
|
|
|
|
|
|
|
$ 24.68 |
|
|
|
|
|
$ 13.28 |
|
|
|
|
|
|
|
|
| Market Price |
|
|
|
|
|
|
$ 15.04 |
|
|
|
|
|
|
|
$ 23.15 |
|
|
|
|
|
$ 13.55 |
|
|
|
|
|
|
|
|
| Percentage of Premium/(Discount) to NAV per Common Share |
|
|
|
|
|
|
(7.67)% |
|
|
|
|
|
|
|
(6.20)% |
|
|
|
|
|
2.03% |
|
|
|
|
|
|
|
|
| Net Assets Attributable to Common Shares |
|
|
|
|
|
|
$ 292,557,743 |
|
|
|
|
|
|
|
$ 1,204,825,050 |
|
|
|
|
|
$ 213,669,234 |
|
| |
|
Shares of closed-end investment companies, including those of the Funds, may frequently trade at prices lower than NAV, the Funds’
Board of Trustees (Board) has currently determined that, at least annually, it will consider action that might be taken to reduce or eliminate any material discount from NAV in respect of Common Shares, which may include the repurchase of such
shares in the open market or in private transactions, the making of a tender offer for such shares at NAV, or the conversion of the Fund to an open-end investment company. The Funds cannot assure you that their Board will decide to take any of these
actions, or that share repurchases or tender offers will actually reduce market discount.
UNRESOLVED STAFF COMMENTS
Each Fund believes that there are no material unresolved written comments, received 180 days or more before December 31, 2023, from the Staff of the Securities and
Exchange Commission (SEC) regarding any of its periodic or current reports under the Securities Exchange Act or Investment Company Act of 1940, or its registration statement, if applicable.
112
Important Tax Information
(Unaudited)
As required by the Internal Revenue Code and Treasury Regulations, certain tax information, as detailed below, must be
provided to shareholders. Shareholders are advised to consult their tax advisor with respect to the tax implications of their investment. The amounts listed below may differ from the actual amounts reported on Form 1099-DIV, which will be sent to
shareholders shortly after calendar year end.
Long-Term Capital Gains
As
of year end, each Fund designates the following distribution amounts, or maximum amount allowable, as being from net long-term capital gains pursuant to Section 852(b)(3) of the Internal Revenue Code:
|
|
|
|
|
| Fund |
|
Net Long-Term
Capital Gains |
|
| |
|
| BXMX |
|
|
$41,451,927 |
|
| DIAX |
|
|
3,462,843 |
|
| SPXX |
|
|
11,285,738 |
|
| QQQX |
|
|
54,256,301 |
|
| JCE |
|
|
279,670 |
|
| |
|
Dividends Received Deduction (DRD)
Each Fund
listed below had the following percentage, or maximum amount allowable, of ordinary income distributions eligible for the dividends received deduction for corporate shareholders:
|
|
|
|
|
| Fund |
|
Percentage |
|
| |
|
| BXMX |
|
|
70.5% |
|
| DIAX |
|
|
100.0 |
|
| SPXX |
|
|
100.0 |
|
| QQQX |
|
|
100.0 |
|
| JCE |
|
|
100.0 |
|
| |
|
Qualified Dividend Income (QDI)
Each Fund
listed below had the following percentage, or maximum amount allowable, of ordinary income distributions treated as qualified dividend income for individuals pursuant to Section 1(h)(11) of the Internal Revenue Code:
|
|
|
|
|
| Fund |
|
Percentage |
|
| |
|
| BXMX |
|
|
73.7% |
|
| DIAX |
|
|
100.0 |
|
| SPXX |
|
|
100.0 |
|
| QQQX |
|
|
100.0 |
|
| JCE |
|
|
100.0 |
|
| |
|
Qualified Interest Income (QII)
Each Fund
listed below had the following percentage, or maximum amount allowable, of ordinary income distributions treated as qualified interest income and/or short-term capital gain dividends pursuant to Section 871(k) of the Internal Revenue
Code:
|
|
|
|
|
| Fund |
|
1/1 to Current
Year End Percentage |
|
| |
|
| BXMX |
|
|
4.9% |
|
| DIAX |
|
|
0.2 |
|
| SPXX |
|
|
0.2 |
|
| QQQX |
|
|
– |
|
| JCE |
|
|
0.4 |
|
| |
|
113
Important Tax Information (Unaudited) (continued)
Qualified Business Income (QBI)
Each Fund listed below had the following percentage, or maximum amount allowable, of ordinary income distributions treated as qualified business income for individuals
pursuant to Section 199A of the Internal Revenue Code:
|
|
|
|
|
| Fund |
|
Percentage |
|
| |
|
|
|
| BXMX |
|
|
1.4% |
|
|
|
| DIAX |
|
|
–% |
|
|
|
| SPXX |
|
|
–% |
|
|
|
| QQQX |
|
|
–% |
|
| JCE |
|
|
–% |
|
| |
|
163(j)
Each Fund listed below had the
following percentage, or maximum amount allowable, of ordinary dividends treated as Section 163(j) interest dividends pursuant to Section 163(j) of the Internal Revenue Code:
|
|
|
|
|
| Fund |
|
Percentage |
|
| |
|
|
|
| BXMX |
|
|
1.9% |
|
|
|
| DIAX |
|
|
0.2 |
|
|
|
| SPXX |
|
|
0.2 |
|
|
|
| QQQX |
|
|
– |
|
| JCE |
|
|
0.4 |
|
| |
|
114
Additional Fund Information
(Unaudited)
Board of Trustees
|
|
|
|
|
|
|
|
|
|
|
|
|
|
|
|
|
Michael A. |
|
|
|
|
|
|
|
|
| Joseph A. Boateng* |
|
Jack B. Evans** |
|
Forrester* |
|
William C. Hunter** |
|
Thomas J. Kenny*** |
|
Amy B.R. Lancellotta |
|
Joanne T. Medero |
| Albin F. Moschner |
|
John K. Nelson |
|
Loren M. Starr*** |
|
Matthew Thornton
III |
|
Terence J. Toth |
|
Margaret L. Wolff |
|
Robert L. Young |
* Serves as a consultant effective January 1, 2024.
** Retired from the Funds’ Board of Trustees effective December 31, 2023.
*** Effective January 1, 2024.
|
|
|
|
|
|
|
|
|
| Investment Adviser |
|
Custodian |
|
Legal Counsel |
|
Independent Registered |
|
Transfer Agent and |
| Nuveen Fund Advisors, LLC 333 West Wacker Drive
Chicago, IL 60606 |
|
State Street Bank & Trust Company
One Congress Street |
|
Chapman and Cutler LLP
Chicago, IL 60603 |
|
Public Accounting Firm
PricewaterhouseCoopers
LLP |
|
Shareholder Services
Computershare Trust Company,N.A. |
|
|
Suite 1 Boston, MA 02114-2016 |
|
|
|
One North Wacker Drive
Chicago, IL 60606 |
|
150 Royall Street
Canton, MA 02021 (800) 257-8787 |
Portfolio of Investments Information Each Fund is required to file its complete schedule of portfolio holdings with the
Securities and Exchange Commission (SEC) for the first and third quarters of each fiscal year as an exhibit to its report on Form N-PORT. You may obtain this information on the SEC’s website at http://www.sec.gov.
Nuveen Funds’ Proxy Voting Information You may obtain (i) information regarding how each fund voted proxies relating to
portfolio securities held during the most recent twelve-month period ended June 30, without charge, upon request, by calling Nuveen toll-free at (800) 257-8787 or on Nuveen’s website at www.nuveen.com and (ii) a description of
the policies and procedures that each fund used to determine how to vote proxies relating to portfolio securities without charge, upon request, by calling Nuveen toll-free at (800) 257-8787. You may also obtain this information directly from
the SEC. Visit the SEC on-line at http://www.sec.gov.
CEO Certification Disclosure Each Fund’s Chief Executive Officer (CEO) has submitted to the New York Stock Exchange (NYSE)
the annual CEO certification as required by Section 303A.12(a) of the NYSE Listed Company Manual. Each Fund has filed with the SEC the certification of its CEO and Chief Financial Officer required by Section 302 of the Sarbanes-Oxley Act.
Common Share Repurchases Each Fund intends to repurchase, through its open-market share repurchase program, shares of its own
common stock at such times and in such amounts as is deemed advisable. During the period covered by this report, each Fund repurchased shares of its common stock as shown in the accompanying table. Any future repurchases will be reported to
shareholders in the next annual or semi-annual report.
|
|
|
|
|
|
|
|
|
|
|
|
|
|
|
|
|
|
|
|
|
| |
|
BXMX |
|
|
DIAX |
|
|
SPXX |
|
|
QQQX |
|
|
JCE |
|
| Common shares repurchased |
|
|
0 |
|
|
|
0 |
|
|
|
0 |
|
|
|
0 |
|
|
|
0 |
|
FINRA BrokerCheck: The Financial Industry Regulatory Authority (FINRA) provides information regarding the disciplinary history of
FINRA member firms and associated investment professionals. This information as well as an investor brochure describing FINRA BrokerCheck is available to the public by calling the FINRA BrokerCheck Hotline number at (800) 289-9999 or by
visiting www.FINRA.org.
115
Glossary of Terms Used in this Report
(Unaudited)
19(a) Notice: Section 19(a) of the Investment Company Act of 1940 requires that the payment of any
distribution which is made from a source other than the fund’s net income be accompanied by a written notice that discloses the estimated sources of such payment.
Average Annual Total Return: This is a commonly used method to express an investment’s performance over a particular, usually multi-year time period. It
expresses the return that would have been necessary each year to equal the investment’s actual cumulative performance (including change in NAV or offer price and reinvested dividends and capital gains distributions, if any) over the time period
being considered.
Gross Domestic Product (GDP): The total market value of all final goods and services produced in a country/region in a given year, equal to
total consumer, investment and government spending, plus the value of exports, minus the value of imports.
Net Asset Value (NAV) Per Share: A fund’s Net
Assets is equal to its total assets (securities, cash, accrued earnings and receivables) less its total liabilities. NAV per share is equal to the fund’s Net Assets divided by its number of shares outstanding.
116
Board Members & Officers
(Unaudited)
The management of the Funds, including general supervision of the duties performed for the Funds by the Adviser, is the
responsibility of the Board of Trustees of the Funds. None of the trustees who are not “interested” persons of the Funds (referred to herein as “independent board members”) has ever been a director or employee of, or consultant
to, Nuveen or its affiliates. The names and business addresses of the trustees and officers of the Funds, their principal occupations and other affiliations during the past five years, the number of portfolios each Trustee oversees and other
directorships they hold are set forth below.
|
|
|
|
|
|
|
|
|
|
|
| Name,
Year of Birth & Address |
|
Position(s) Held
with the Funds |
|
Year First
Elected or Appointed
and Term(1) |
|
|
Principal Occupation(s)
Including other Directorships During Past 5 Years |
|
Number of
Portfolios in Fund
Complex Overseen By
Board Member |
|
|
|
|
|
| Independent Trustees: |
|
|
|
|
|
|
|
|
|
|
|
|
|
|
|
| Terence J. Toth 1959
333 W. Wacker Drive Chicago, IL 60606 |
|
Co-Chair and Board Member |
|
|
2008
Class II |
|
|
Formerly, a Co-Founding Partner, Promus Capital (investment advisory firm) (2008-2017); formerly, Director, Quality Control Corporation (manufacturing) (2012-2021); Chair of the Board of the Kehrein Center for the Arts
(philanthropy) (since 2021); member: Catalyst Schools of Chicago Board (since 2008) and Mather Foundation Board (philanthropy) (since 2012), formerly, Chair of its Investment Committee (2017-2022); formerly, Member, Chicago Fellowship Board
(philanthropy) (2005-2016); formerly, Director, Fulcrum IT Services LLC (information technology services firm to government entities) (2010-2019); formerly, Director, LogicMark LLC (health services) (2012-2016); formerly, Director, Legal &
General Investment Management America, Inc. (asset management) (2008-2013); formerly, CEO and President, Northern Trust Global Investments (financial services) (2004-2007); Executive Vice President, Quantitative Management & Securities Lending
(2000-2004); prior thereto, various positions with Northern Trust Company (financial services) (since 1994); formerly, Member, Northern Trust Mutual Funds Board (2005-2007), Northern Trust Global Investments Board (2004-2007), Northern Trust Japan
Board (2004-2007), Northern Trust Securities Inc. Board (2003- 2007) and Northern Trust Hong Kong Board (1997-2004). |
|
211 |
| |
|
|
|
|
| Joseph A. Boateng 1963
730 Third Avenue New York, NY 10017 |
|
Board Member |
|
|
2024
Class II |
|
|
Chief Investment Officer, Casey Family Programs (since 2007). Director of U.S. Pension Plans, Johnson & Johnson (2002-2006); Board Member, Lumina Foundation; and Waterside School;
Emeritus Board Member, Year-Up Puget Sound; Investment Advisory Committee Member, Seattle City Employees’ Retirement System; Investment Committee Member, The Seattle Foundation. |
|
190 |
|
|
|
|
|
| Michael A. Forrester 1967
730 Third Avenue New York, NY 10017 |
|
Board Member |
|
|
2024
Class I |
|
|
Chief Executive Officer (2014–2021) and Chief Operating Officer (2007–2014), Copper Rock Capital Partners, LLC; Trustee, Dexter Southfield School; Member, Governing Council of the Independent Directors Council. |
|
190 |
| |
|
|
|
|
| Thomas J. Kenny 1963
730 Third Avenue New York, NY 10017 |
|
Co-Chair and Board Member |
|
|
2024
Class I |
|
|
Advisory Director (2010–2011), Partner (2004–2010), Managing Director (1999–2004) and Co-Head of Global Cash and Fixed Income Portfolio Management Team (2002–2010),
Goldman Sachs Asset Management; Director and Chair of the Finance and Investment Committee, Aflac Incorporated; Director, ParentSquare. |
|
211 |
|
|
|
|
|
| Amy B. R. Lancellotta 1959
333 W. Wacker Drive Chicago, IL 60606 |
|
Board Member |
|
|
2021
Class II |
|
|
Formerly, Managing Director, Independent Directors Council (IDC) (supports the fund independent director community and is part of the Investment Company Institute (ICI), which represents regulated investment companies)
(2006-2019); formerly, various positions with ICI (1989-2006); President (since 2023) and Member (since 2020) of the Board of Directors, Jewish Coalition Against Domestic Abuse (JCADA). |
|
211 |
117
Board Members & Officers (Unaudited) (continued)
|
|
|
|
|
|
|
|
|
|
|
| Name,
Year of Birth & Address |
|
Position(s) Held
with the Funds |
|
Year First
Elected or Appointed
and Term(1) |
|
|
Principal Occupation(s)
Including other Directorships During Past 5 Years |
|
Number of
Portfolios in Fund
Complex Overseen By
Board Member |
|
|
|
|
|
| Joanne T. Medero 1954
333 W. Wacker Drive Chicago, IL 60606 |
|
Board Member |
|
|
2021
Class III |
|
|
Formerly, Managing Director, Government Relations and Public Policy (2009-2020) and Senior Advisor to the Vice Chairman (2018- 2020), BlackRock, Inc. (global investment management firm);
formerly, Managing Director, Global Head of Government Relations and Public Policy, Barclays Group (IBIM) (investment banking, investment management and wealth management businesses) (2006-2009); formerly, Managing Director, Global General Counsel
and Corporate Secretary, Barclays Global Investors (global investment management firm) (1996-2006); formerly, Partner, Orrick, Herrington & Sutcliffe LLP (law firm) (1993-1995); formerly, General Counsel, Commodity Futures Trading Commission
(government agency overseeing U.S. derivatives markets) (1989-1993); formerly, Deputy Associate Director/Associate Director for Legal and Financial Affairs, Office of Presidential Personnel, The White House (1986-1989); Member of the Board of
Directors, Baltic-American Freedom Foundation (seeks to provide opportunities for citizens of the Baltic states to gain education and professional development through exchanges in the U.S.) (since 2019). |
|
211 |
|
|
|
|
|
| Albin F. Moschner 1952
333 W. Wacker Drive Chicago, IL 60606 |
|
Board Member |
|
|
2016
Class III |
|
|
Founder and Chief Executive Officer, Northcroft Partners, LLC, (management consulting) (since 2012); formerly, Chairman (2019), and Director (2012-2019), USA Technologies, Inc., (provider of solutions and services to facilitate
electronic payment transactions); formerly, Director, Wintrust Financial Corporation (1996-2016); previously, held positions at Leap Wireless International, Inc. (consumer wireless services), including Consultant (2011-2012), Chief Operating Officer
(2008-2011), and Chief Marketing Officer (2004-2008); formerly, President, Verizon Card Services division of Verizon Communications, Inc. (2000-2003); formerly, President, One Point Services at One Point Communications (telecommunication services)
(1999-2000); formerly, Vice Chairman of the Board, Diba, Incorporated (internet technology provider) (1996-1997); formerly, various executive positions (1991-1996) including Chief Executive Officer (1995-1996) of Zenith Electronics Corporation
(consumer electronics). |
|
211 |
| |
|
|
|
|
| John K. Nelson 1962
333 W. Wacker Drive Chicago, IL 60606 |
|
Board Member |
|
|
2013
Class II |
|
|
Member of Board of Directors of Core12 LLC. (private firm which develops branding, marketing and communications strategies for clients) (since 2008); served The President’s Council of
Fordham University (2010-2019) and previously a Director of the Curran Center for Catholic American Studies (2009-2018); formerly, senior external advisor to the Financial Services practice of Deloitte Consulting LLP. (2012-2014); former Chair of
the Board of Trustees of Marian University (2010-2014 as trustee, 2011-2014 as Chair); formerly Chief Executive Officer of ABN AMRO Bank N.V., North America, and Global Head of the Financial Markets Division (2007-2008), with various executive
leadership roles in ABN AMRO Bank N.V. between 1996 and 2007. |
|
211 |
|
|
|
|
|
| Loren M. Starr 1961
730 Third Avenue New York, NY 10017 |
|
Board Member |
|
|
2024
Class III |
|
|
Independent Consultant/Advisor (since 2021). Vice Chair, Senior Managing Director (2020–2021), Chief Financial Officer, Senior Managing Director (2005–2020), Invesco Ltd.; Director, AMG. |
|
210 |
118
|
|
|
|
|
|
|
|
|
|
|
| Name,
Year of Birth & Address |
|
Position(s) Held
with the Funds |
|
Year First
Elected or Appointed
and Term(1) |
|
|
Principal Occupation(s)
Including other Directorships During Past 5 Years |
|
Number of
Portfolios in Fund
Complex Overseen By
Board Member |
|
|
|
|
|
| Matthew Thornton III 1958
333 W. Wacker Drive Chicago, IL 60606 |
|
Board Member |
|
|
2020
Class III |
|
|
Formerly, Executive Vice President and Chief Operating Officer (2018-2019), FedEx Freight Corporation, a subsidiary of FedEx Corporation (FedEx) (provider of transportation, e-commerce and business services through its portfolio of
companies); formerly, Senior Vice President, U.S. Operations (2006-2018), Federal Express Corporation, a subsidiary of FedEx; formerly Member of the Board of Directors (2012-2018), Safe Kids
Worldwide® (a non-profit organization dedicated to preventing childhood injuries). Member of the Board of Directors (since 2014), The Sherwin-Williams Company (develops, manufactures,
distributes and sells paints, coatings and related products); Director (since 2020), Crown Castle International (provider of communications infrastructure). |
|
211 |
| |
|
|
|
|
| Margaret L. Wolff 1955
333 W. Wacker Drive Chicago, IL 60606 |
|
Board Member |
|
|
2016
Class I |
|
|
Formerly, member of the Board of Directors (2013-2017) of Travelers Insurance Company of Canada and The Dominion of Canada General Insurance Company (each, a part of Travelers Canada, the
Canadian operation of The Travelers Companies, Inc.); formerly, Of Counsel, Skadden, Arps, Slate, Meagher & Flom LLP (Mergers & Acquisitions Group) (legal services) (2005- 2014); Member of the Board of Trustees of New York-Presbyterian
Hospital (since 2005); Member (since 2004) formerly, Chair (2015- 2022) of the Board of Trustees of The John A. Hartford Foundation (a philanthropy dedicated to improving the care of older adults); formerly, Member (2005-2015) and Vice Chair
(2011-2015) of the Board of Trustees of Mt. Holyoke College. |
|
211 |
|
|
|
|
|
| Robert L. Young 1963
333 W. Wacker Drive Chicago, IL 60606 |
|
Board Member |
|
|
2017
Class I |
|
|
Formerly, Chief Operating Officer and Director, J.P. Morgan Investment Management Inc. (financial services) (2010-2016); formerly, President and Principal Executive Officer (2013-2016), and Senior Vice President and Chief Operating
Officer (2005-2010), of J.P. Morgan Funds; formerly, Director and various officer positions for J.P. Morgan Investment Management Inc. (formerly, JPMorgan Funds Management, Inc. and formerly, One Group Administrative Services) and JPMorgan
Distribution Services, Inc. (financial services) (formerly, One Group Dealer Services, Inc.) (1999-2017). |
|
211 |
|
|
|
|
|
| Name, Year of Birth
& Address |
|
Position(s) Held with the Funds |
|
|
Year First
Elected or
Appointed(2) |
|
|
Principal Occupation(s)
Including other Directorships During Past 5 Years |
|
|
|
|
|
|
|
| Officers of the Funds: |
|
|
|
|
|
|
|
|
|
|
| |
|
|
|
| David J. Lamb
1963 333 W.
Wacker Drive Chicago, IL 60606 |
|
Chief Administrative Officer |
|
|
2015 |
|
|
Managing Director of Nuveen Fund Advisors, LLC; Senior Managing Director of Nuveen Securities, LLC; Senior Managing Director of Nuveen; has previously held various positions with
Nuveen. |
|
|
|
|
| Brett E. Black 1972
333 W. Wacker Drive Chicago, IL 60606 |
|
Vice President and Chief Compliance Officer |
|
|
2022 |
|
|
Managing Director, Chief Compliance Officer of Nuveen; formerly, Vice President (2014-2022), Chief Compliance Officer and Anti-Money Laundering Compliance Officer (2017-2022) of
BMO Funds, Inc. |
|
|
|
|
| Mark J. Czarniecki 1979
901 Marquette Avenue Minneapolis, MN 55402 |
|
Vice President and Assistant Secretary |
|
|
2013 |
|
|
Managing Director and Assistant Secretary of Nuveen Securities, LLC and Nuveen Fund Advisors, LLC; Managing Director and Associate General Counsel of Nuveen; Managing Director Assistant Secretary and Associate General
Counsel of Nuveen Asset Management, LLC; has previously held various positions with Nuveen; Managing Director, Associate General Counsel and Assistant Secretary of Teachers Advisors, LLC and TIAA-CREF Investment Management,
LLC. |
119
Board Members & Officers (Unaudited) (continued)
|
|
|
|
|
|
|
|
|
| Name,
Year of Birth & Address |
|
Position(s) Held
with the Funds |
|
Year First
Elected or
Appointed(2) |
|
|
Principal Occupation(s)
Including other Directorships
During Past 5 Years |
|
|
|
|
| Jeremy D. Franklin 1983
8500 Andrew Carnegie Blvd. Charlotte, NC 28262 |
|
Vice President and Assistant Secretary |
|
|
2024 |
|
|
Vice President and Assistant Secretary, Nuveen Fund Advisors, LLC; Vice President Associate General Counsel and Assistant Secretary, Nuveen Asset Management, LLC, Teachers Advisors, LLC and TIAA-CREF Investment Management, LLC; Vice
President and Associate General Counsel, Teachers Insurance and Annuity Association of America; Vice President and Assistant Secretary, TIAA-CREF Funds and TIAA-CREF Life Funds; Vice President, Associate General Counsel, and Assistant Secretary,
TIAA Separate Account VA-1 and College Retirement Equities Fund. |
| |
|
|
|
| Diana R. Gonzalez
1978 8500 Andrew Carnegie Blvd.
Charlotte, NC 28262 |
|
Vice President and Assistant Secretary |
|
|
2017 |
|
|
Vice President and Assistant Secretary of Nuveen Fund Advisors, LLC; Vice President, Associate General Counsel and Assistant Secretary of Nuveen Asset Management, LLC,
Teachers Advisors, LLC and TIAA-CREF Investment Management, LLC; Vice President and Associate General Counsel of Nuveen. |
|
|
|
|
| Nathaniel T. Jones 1979
333 W. Wacker Drive Chicago, IL 60606 |
|
Vice President and Treasurer |
|
|
2016 |
|
|
Senior Managing Director of Nuveen; Managing Director of Nuveen Fund Advisors, LLC; has previously held various positions with Nuveen; Chartered Financial Analyst. |
| |
|
|
|
| Brian H. Lawrence 1982
8500 Andrew Carnegie Blvd.
Charlotte, NC 28262 |
|
Vice President and Assistant Secretary |
|
|
2023 |
|
|
Vice President and Associate General Counsel of Nuveen; Vice President, Associate General Counsel and Assistant Secretary of Teachers Advisors, LLC and TIAA-CREF Investment Management, LLC;
formerly Corporate Counsel of Franklin Templeton (2018-2022). |
|
|
|
|
| Tina M. Lazar 1961
333 W. Wacker Drive Chicago, IL 60606 |
|
Vice President |
|
|
2002 |
|
|
Managing Director of Nuveen Securities, LLC. |
| |
|
|
|
| Brian J. Lockhart 1974
333 W. Wacker Drive Chicago, IL 60606 |
|
Vice President |
|
|
2019 |
|
|
Senior Managing Director and Head of Investment Oversight of Nuveen; Managing Director of Nuveen Fund Advisors, LLC; has previously held various positions with Nuveen; Chartered Financial
Analyst and Certified Financial Risk Manager. |
|
|
|
|
| John M. McCann 1975
8500 Andrew Carnegie Blvd. Charlotte, NC 28262 |
|
Vice President and Assistant Secretary |
|
|
2022 |
|
|
Managing Director, General Counsel and Secretary of Nuveen Fund Advisors, LLC; Managing Director, Associate General Counsel and Assistant Secretary of Nuveen Asset Management, LLC; Managing Director and Assistant Secretary of TIAA
SMA Strategies LLC; Managing Director, Associate General Counsel and Assistant Secretary of College Retirement Equities Fund, TIAA Separate Account VA-1, TIAA-CREF Funds, TIAA-CREF Life Funds, Teachers Insurance and Annuity Association of America,
Teacher Advisors LLC, TIAA-CREF Investment Management, LLC, and Nuveen Alternative Advisors LLC; has previously held various positions with Nuveen/TIAA. |
| |
|
|
|
| Kevin J. McCarthy 1966
333 W. Wacker Drive Chicago, IL 60606 |
|
Vice President and Assistant Secretary |
|
|
2007 |
|
|
Executive Vice President, Secretary and General Counsel of Nuveen Investments, Inc.; Executive Vice President and Assistant Secretary of Nuveen Securities, LLC and Nuveen Fund Advisors,
LLC; Executive Vice President and Secretary of Nuveen Asset Management, LLC; Executive Vice President, General Counsel and Secretary of Teachers Advisors, LLC, TIAA-CREF Investment Management, LLC and Nuveen Alternative Investments, LLC; Executive
Vice President, Associate General Counsel and Assistant Secretary of TIAA-CREF Funds and TIAA-CREF Life Funds; has previously held various positions with Nuveen; Vice President and Secretary of Winslow Capital Management, LLC; formerly, Vice
President (2007-2021) and Secretary (2016-2021) of NWQ Investment Management Company, LLC and Santa Barbara Asset Management, LLC. |
|
|
|
|
| Jon Scott Meissner 1973 8500
Andrew Carnegie Blvd. Charlotte, NC 28262 |
|
Vice President and Assistant Secretary |
|
|
2019 |
|
|
Managing Director, Mutual Fund Tax and Expense Administration of Nuveen, TIAA- CREF Funds, TIAA-CREF Life Funds, TIAA Separate Account VA-1 and the CREF Accounts; Managing Director of Nuveen
Fund Advisors, LLC, Teachers Advisors, LLC and TIAA-CREF Investment Management, LLC; has previously held various positions with TIAA. |
|
|
|
|
| James Nelson III 1976
730 Third Avenue New York, NY 10017 |
|
Vice President |
|
|
2024 |
|
|
Senior Managing Director, Global Head of Product, Publics, Nuveen; formerly, Head of North American Product Management & Pricing, Invesco (2018-2023). |
120
|
|
|
|
|
|
|
| Name,
Year of Birth & Address |
|
Position(s) Held with
the Funds |
|
Year First Elected or
Appointed(2) |
|
Principal Occupation(s)
Including other Directorships During Past 5 Years |
| Mary Beth Ramsay 1965 8500
Andrew Carnegie Blvd. Charlotte, NC 28262 |
|
Vice President |
|
2024 |
|
Chief Risk Officer, Nuveen and TIAA Financial Risk; Head of Nuveen Risk & Compliance; Executive Vice President, Teachers Insurance and Annuity Association of America; formerly, Senior
Vice President, Head of Sales and Client Solutions (2019-2022) and U.S. Chief Pricing Actuary (2016-2019), SCOR Global Life Americas; Member of the Board of Directors of Society of Actuaries. |
| William A. Siffermann
1975 333 W. Wacker Drive
Chicago, IL 60606 |
|
Vice President |
|
2017 |
|
Managing Director of Nuveen. |
| E. Scott Wickerham 1973
8500 Andrew Carnegie Blvd. Charlotte, NC 28262 |
|
Vice President and Controller |
|
2019 |
|
Senior Managing Director, Head of Public Investment Finance of Nuveen; Senior Managing Director of Nuveen Fund Advisors, LLC and Nuveen Asset Management, LLC; Principal Financial Officer,
Principal Accounting Officer and Treasurer of the TIAA-CREF Funds, the TIAA-CREF Life Funds, the TIAA Separate Account VA-1 and the CREF Accounts; has previously held various positions with TIAA. |
| Mark L. Winget 1968
333 W. Wacker Drive Chicago, IL 60606 |
|
Vice President and Secretary |
|
2008 |
|
Vice President and Assistant Secretary of Nuveen Securities, LLC and Nuveen Fund Advisors, LLC; Vice President, Associate General Counsel and Assistant Secretary of Teachers Advisors, LLC
and TIAA-CREF Investment Management, LLC and Nuveen Asset Management, LLC; Vice President and Associate General Counsel of Nuveen. |
| Rachael Zufall 1973
8500 Andrew Carnegie Blvd. Charlotte, NC 28262 |
|
Vice President and Assistant Secretary |
|
2022 |
|
Managing Director and Assistant Secretary of Nuveen Fund Advisors, LLC; Managing Director, Associate General Counsel and Assistant Secretary of the CREF Accounts, TIAA Separate Account VA-1, TIAA-CREF Funds and TIAA-CREF Life
Funds; Managing Director, Associate General Counsel and Assistant Secretary of Teacher Advisors, LLC and TIAA-CREF Investment Management, LLC; Managing Director of Nuveen, LLC and of TIAA. |
| (1) |
The Board of Trustees is divided into three classes, Class I, Class II, and Class III, with each being elected to serve
until the third succeeding annual shareholders’ meeting subsequent to its election or thereafter in each case when its respective successors are duly elected or appointed, except two board members are elected by the holders of Preferred Shares,
when applicable, to serve until the next annual shareholders’ meeting subsequent to its election or thereafter in each case when its respective successors are duly elected or appointed. The year first elected or appointed represents the year in
which the board member was first elected or appointed to any fund in the Nuveen complex. |
| (2) |
Officers serve indefinite terms until their successor has been duly elected and qualified, their death or their
resignation or removal. The year first elected or appointed represents the year in which the Officer was first elected or appointed to any fund in the Nuveen Complex. |
121
[This page intentionally left blank.]
[This page intentionally left blank.]

|
| Nuveen:
Serving Investors for Generations
Since 1898, financial advisors and their clients have relied on Nuveen to provide dependable investment solutions through continued adherence to proven,
long-term investing principles. Today, we offer a range of high quality solutions designed to be integral components of a well-diversified core portfolio.
Focused on meeting investor needs. Nuveen is the investment
manager of TIAA. We have grown into one of the world’s premier global asset managers, with specialist knowledge across all major asset classes and particular strength in solutions that provide income for investors and that draw on our expertise
in alternatives and responsible investing. Nuveen is driven not only by the independent investment processes across the firm, but also the insights, risk management, analytics and other tools and resources that a truly world-class platform provides.
As a global asset manager, our mission is to work in partnership with our clients to create solutions which help them secure their financial future.
Find out how we can help you. To learn more about how the
products and services of Nuveen may be able to help you meet your financial goals, talk to your financial advisor, or call us at (800) 257-8787. Please read the information provided carefully before you invest. Investors should consider the
investment objective and policies, risk considerations, charges and expenses of any investment carefully. Where applicable, be sure to obtain a prospectus, which contains this and other relevant information. To obtain a prospectus, please contact
your securities representative or Nuveen, 333 W. Wacker Dr., Chicago, IL 60606. Please read the prospectus carefully before you invest or send money. Learn more
about Nuveen Funds at: www.nuveen.com/closed-end-funds NOT FDIC INSURED MAY
LOSE VALUE NO BANK GUARANTEE |
|
|
|
|
|
| Nuveen Securities, LLC, member FINRA and SIPC | 333 West Wacker Drive
| Chicago, IL 60606 | www.nuveen.com |
|
EAN-A-1223P |
|
3342545-INV-Y-02/25 |
ITEM 2. CODE OF ETHICS.
As of the end of the period covered by this report, the registrant has adopted a code of ethics that applies to the registrant’s principal executive
officer, principal financial officer, principal accounting officer or controller, or persons performing similar functions. There were no amendments to or waivers from the Code during the period covered by this report. The registrant has posted the
code of ethics on its website at www.nuveen.com/fund-governance. (To view the code, click on Code of Conduct.)
ITEM 3. AUDIT COMMITTEE FINANCIAL EXPERT.
The registrant’s Board of Directors or Trustees (“Board”) determined that the registrant has at least one “audit committee financial
expert” (as defined in Item 3 of Form N-CSR) serving on its Audit Committee. The registrant’s audit committee financial experts are Joseph A. Boateng(1), Albin F. Moschner, John K. Nelson, Loren M. Starr(2) and Robert L. Young, who are
“independent” for purposes of Item 3 of Form N-CSR.
Mr. Boateng has served as the Chief Investment Officer for Casey Family Programs since
2007. He was previously Director of U.S. Pension Plans for Johnson & Johnson from 2002-2006. Mr. Boateng is a board member of the Lumina Foundation and Waterside School, an emeritus board member of Year Up Puget Sound, member of the Investment
Advisory Committee and former Chair for the Seattle City Employees’ Retirement System, and an Investment Committee Member for The Seattle Foundation. Mr. Boateng received a B.S. from the University of Ghana and an M.B.A. from the
University of California, Los Angeles.
Mr. Moschner is a consultant in the wireless industry and, in July 2012, founded Northcroft Partners, LLC, a
management consulting firm that provides operational, management and governance solutions. Prior to founding Northcroft Partners, LLC, Mr. Moschner held various positions at Leap Wireless International, Inc., a provider of wireless services, where
he was as a consultant from February 2011 to July 2012, Chief Operating Officer from July 2008 to February 2011, and Chief Marketing Officer from August 2004 to June 2008. Before he joined Leap Wireless International, Inc., Mr.
Moschner was President of the Verizon Card Services division of Verizon Communications, Inc. from 2000 to 2003, and President of One Point Services at One Point Communications from 1999 to 2000. Mr. Moschner also served at Zenith Electronics
Corporation as Director, President and Chief Executive Officer from 1995 to 1996, and as Director, President and Chief Operating Officer from 1994 to 1995.
Mr. Nelson formerly served on the Board of Directors of Core12, LLC from 2008 to 2023, a private firm which develops branding, marketing, and communications
strategies for clients. Mr. Nelson has extensive experience in global banking and markets, having served in several senior executive positions with ABN AMRO Holdings N.V. and its affiliated entities and predecessors, including LaSalle Bank
Corporation from 1996 to 2008, ultimately serving as Chief Executive Officer of ABN AMRO N.V. North America. During his tenure at the bank, he also served as Global Head of its Financial Markets Division, which encompassed the bank’s Currency,
Commodity, Fixed Income, Emerging Markets, and Derivatives businesses. He was a member of the Foreign Exchange Committee of the Federal Reserve Bank of the United States and during his tenure with ABN AMRO served as the bank’s representative on
various committees of The Bank of Canada, European Central Bank, and The Bank of England. Mr. Nelson previously served as a senior, external advisor to the financial services practice of Deloitte Consulting LLP. (2012-2014).
Mr. Starr was Vice Chair, Senior Managing Director from 2020 to 2021, and Chief Financial Officer, Senior Managing Director from 2005 to 2020, for
Invesco Ltd. Mr. Starr is also a Director and member of the Audit Committee for AMG. He is former Chair and member of the Board of Directors, Georgia Leadership Institute for School Improvement (GLISI); former Chair and member of the Board of
Trustees, Georgia Council on Economic Education (GCEE).
Mr. Young has more than 30 years of experience in the investment management industry. From
1997 to 2017, he held various positions with J.P. Morgan Investment Management Inc. (“J.P. Morgan Investment”) and its affiliates (collectively, “J.P. Morgan”). Most recently, he served as Chief Operating Officer and Director of
J.P. Morgan Investment (from 2010 to 2016) and as President and Principal Executive Officer of the J.P. Morgan Funds (from 2013 to 2016). As Chief Operating Officer of J.P. Morgan Investment, Mr. Young led service, administration and business
platform support activities for J.P. Morgan’s domestic retail mutual fund and institutional commingled and separate account businesses, and co-led these activities for J.P. Morgan’s global retail and institutional investment
management businesses. As President of the J.P. Morgan Funds, Mr. Young interacted with various service providers to these funds, facilitated the relationship between such funds and their boards, and was directly involved in establishing board
agendas, addressing regulatory matters, and establishing policies and procedures. Before joining J.P. Morgan, Mr. Young, a former Certified Public Accountant (CPA), was a Senior Manager (Audit) with Deloitte & Touche LLP (formerly,
Touche Ross LLP), where he was employed from 1985 to 1996. During his tenure there, he actively participated in creating, and ultimately led, the firm’s midwestern mutual fund practice.
| (1) |
Mr. Boateng was elected or appointed as a board member of each of the Nuveen Funds except Nuveen Core Equity
Alpha Fund, Nuveen Core Plus Impact Fund, Nuveen Credit Strategies Income Fund, Nuveen Dow 30SM Dynamic Overwrite Fund, Nuveen Floating Rate Income Fund, Nuveen Global High Income Fund, Nuveen Minnesota Quality Municipal Income Fund, Nuveen Missouri
Quality Municipal Income Fund, Nuveen Mortgage and Income Fund, Nuveen Multi-Asset Income Fund, Nuveen Multi-Market Income Fund, Nuveen Municipal Credit Opportunities Fund, Nuveen NASDAQ 100 Dynamic Overwrite Fund, Nuveen Preferred and Income Term
Fund, Nuveen Preferred & Income Opportunities Fund, Nuveen Real Asset Income and Growth Fund, Nuveen Real Estate Income Fund, Nuveen S&P 500 Dynamic Overwrite Fund, Nuveen S&P 500 Buy-Write Income Fund, Nuveen Variable Rate Preferred
& Income Fund, and Nuveen Virginia Quality Municipal Income Fund, for which he serves as a consultant. |
| (2) |
Mr. Starr was elected or appointed as a board member of each of the Nuveen Funds except Nuveen Multi-Market
Income Fund, for which he serves as a consultant. |
ITEM 4. PRINCIPAL ACCOUNTANT FEES AND SERVICES.
The following tables show the amount of fees that PricewaterhouseCoopers LLP, the Fund’s auditor, billed to the Fund during the Fund’s last two full
fiscal years. For engagements with PricewaterhouseCoopers LLP the Audit Committee approved in advance all audit services and non-audit services that PricewaterhouseCoopers LLP provided to the Fund, except for those non-audit services that were
subject to the pre-approval exception under Rule 2-01 of Regulation S-X (the “pre-approval exception”). The pre-approval exception for services provided directly to the Fund waives the pre-approval requirement for services other than
audit, review or attest services if: (A) the aggregate amount of all such services provided constitutes no more than 5% of the total amount of revenues paid by the Fund to its accountant during the fiscal year in which the services are provided; (B)
the Fund did not recognize the services as non-audit services at the time of the engagement; and (C) the services are promptly brought to the Audit Committee’s attention, and the Committee (or its delegate) approves the services before the
audit is completed.
The Audit Committee has delegated certain pre-approval responsibilities to its Chair (or, in his absence, any other member of the
Audit Committee).
SERVICES THAT THE FUND’S AUDITOR BILLED TO THE FUND
|
|
|
|
|
|
|
|
|
|
|
|
|
|
|
|
|
| Fiscal Year Ended |
|
Audit Fees Billed
to Fund 1 |
|
|
Audit-Related Fees
Billed to Fund 2 |
|
|
Tax Fees
Billed to Fund 3 |
|
|
All Other Fees
Billed to Fund 4 |
|
| December 31, 2023 |
|
$ |
42,740 |
|
|
$ |
0 |
|
|
$ |
996 |
|
|
$ |
0 |
|
|
|
|
|
|
|
|
|
|
|
|
|
|
|
|
|
|
| |
|
|
|
|
|
|
|
|
|
|
|
|
|
|
|
|
|
Percentage approved pursuant to pre-approval
exception |
|
|
0 |
% |
|
|
0 |
% |
|
|
0 |
% |
|
|
0 |
% |
|
|
|
|
|
|
|
|
|
|
|
|
|
|
|
|
|
| |
|
|
|
|
|
|
|
|
|
|
|
|
|
|
|
|
| December 31, 2022 |
|
$ |
41,171 |
|
|
$ |
0 |
|
|
$ |
— |
|
|
$ |
0 |
|
|
|
|
|
|
|
|
|
|
|
|
|
|
|
|
|
|
| |
|
|
|
|
|
|
|
|
|
|
|
|
|
|
|
|
| Percentage approved pursuant to pre-approval
exception |
|
|
0 |
% |
|
|
0 |
% |
|
|
0 |
% |
|
|
0 |
% |
|
|
|
|
|
|
|
|
|
|
|
|
|
|
|
|
|
1 “Audit Fees” are the aggregate fees billed for professional services for the audit of the Fund’s annual financial statements and services provided in connection with statutory and
regulatory filings or engagements.
2 “Audit Related Fees” are the aggregate fees billed
for assurance and related services reasonably related to the performance of the audit or review of financial statements that are not reported under “Audit Fees”. These fees include offerings related to the Fund’s common shares and
leverage.
3 “Tax Fees” are the aggregate fees billed for professional services for tax
advice, tax compliance, and tax planning. These fees include: all global withholding tax services; excise and state tax reviews; capital gain, tax equalization and taxable basis calculation performed by the principal accountant.
4 “All Other Fees” are the aggregate fees billed for products and services other than
“Audit Fees”, “Audit-Related Fees” and “Tax Fees”. These fees represent all “Agreed-Upon Procedures” engagements pertaining to the Fund’s use of leverage.
SERVICES THAT THE FUND’S AUDITOR BILLED TO THE
ADVISER AND AFFILIATED FUND SERVICE PROVIDERS
The following tables show the amount of fees billed by PricewaterhouseCoopers LLP to Nuveen Fund Advisors, LLC (formerly Nuveen Fund Advisors, Inc.) (the
“Adviser”), and any entity controlling, controlled by or under common control with the Adviser that provides ongoing services to the Fund (“Affiliated Fund Service Provider”), for engagements directly related to the Fund’s
operations and financial reporting, during the Fund’s last two full fiscal years.
The tables also show the percentage of fees subject to the pre-approval exception. The pre-approval exception for
services provided to the Adviser and any Affiliated Fund Service Provider (other than audit, review or attest services) waives the pre-approval requirement if: (A) the aggregate amount of all such services provided constitutes no more than 5% of the
total amount of revenues paid to PricewaterhouseCoopers LLP by the Fund, the Adviser and Affiliated Fund Service Providers during the fiscal year in which the services are provided that would have to be pre-approved by the Audit Committee; (B) the
Fund did not recognize the services as non-audit services at the time of the engagement; and (C) the services are promptly brought to the Audit Committee’s attention, and the Committee (or its delegate) approves the services before the
Fund’s audit is completed.
|
|
|
|
|
|
|
|
|
|
|
|
|
| Fiscal Year Ended |
|
Audit-Related Fees
Billed to Adviser
and
Affiliated Fund
Service Providers |
|
|
Tax Fees Billed to
Adviser and
Affiliated Fund
Service Providers |
|
|
All Other Fees
Billed to Adviser
and Affiliated Fund
Service
Providers |
|
| December 31, 2023 |
|
$ |
0 |
|
|
$ |
0 |
|
|
$ |
0 |
|
|
|
|
|
|
|
|
|
|
|
|
|
|
| |
|
|
|
|
|
|
|
|
|
|
|
|
| Percentage approved pursuant to pre-approval
exception |
|
|
0 |
% |
|
|
0 |
% |
|
|
0 |
% |
|
|
|
|
|
|
|
|
|
|
|
|
|
| |
|
|
|
|
|
|
|
|
|
|
|
|
| December 31, 2022 |
|
$ |
0 |
|
|
$ |
0 |
|
|
$ |
0 |
|
|
|
|
|
|
|
|
|
|
|
|
|
|
| |
|
|
|
|
|
|
|
|
|
|
|
|
| Percentage approved pursuant to pre-approval
exception |
|
|
0 |
% |
|
|
0 |
% |
|
|
0 |
% |
|
|
|
|
|
|
|
|
|
|
|
|
|
NON-AUDIT SERVICES
The following table shows the amount of fees that PricewaterhouseCoopers LLP billed during the Fund’s last two full fiscal years for non-audit services.
The Audit Committee is required to pre-approve non-audit services that PricewaterhouseCoopers LLP provides to the Adviser and any Affiliated Fund Services Provider, if the engagement related directly to the Fund’s operations and financial
reporting (except for those subject to the pre-approval exception described above). The Audit Committee requested and received information from PricewaterhouseCoopers LLP about any non-audit services that PricewaterhouseCoopers LLP rendered during
the Fund’s last fiscal year to the Adviser and any Affiliated Fund Service Provider. The Committee considered this information in evaluating PricewaterhouseCoopers LLP’s independence.
|
|
|
|
|
|
|
|
|
|
|
|
|
|
|
|
|
| Fiscal Year Ended |
|
Total Non-Audit Fees
Billed to Fund |
|
|
Total Non-Audit Fees
billed to Adviser and
Affiliated
Fund Service
Providers (engagements
related directly to the
operations and financial
reporting of the Fund) |
|
|
Total Non-Audit Fees
billed to Adviser
and
Affiliated Fund Service
Providers (all other
engagements) |
|
|
Total |
|
| December 31, 2023 |
|
$ |
996 |
|
|
$ |
0 |
|
|
$ |
0 |
|
|
$ |
996 |
|
| December 31, 2022 |
|
$ |
0 |
|
|
$ |
0 |
|
|
$ |
0 |
|
|
$ |
0 |
|
“Non-Audit Fees billed to Fund” for both fiscal year ends represent
“Tax Fees” and “All Other Fees” billed to Fund in their respective amounts from the previous table.
Less than 50 percent of the
hours expended on the principal accountant’s engagement to audit the registrant’s financial statements for the most recent fiscal year were attributed to work performed by persons other than the principal accountant’s full-time,
permanent employees.
Audit Committee Pre-Approval Policies and Procedures. Generally, the Audit Committee must approve (i) all non-audit services to be
performed for the Fund by the Fund’s independent accountants and (ii) all audit and non-audit services to be performed by the Fund’s independent accountants for the Affiliated Fund Service Providers with respect to operations and financial
reporting of the Fund Regarding tax and research projects conducted by the independent accountants for the Fund and Affiliated Fund Service Providers (with respect to operations and financial reports of the Fund) such engagements will be (i)
pre-approved by the Audit Committee if they are expected to be for amounts greater than $10,000; (ii) reported to the Audit Committee chair for his verbal approval prior to engagement if they are expected to be for amounts under $10,000 but greater
than $5,000; and (iii) reported to the Audit Committee at the next Audit Committee meeting if they are expected to be for an amount under $5,000.
ITEM 5.
AUDIT COMMITTEE OF LISTED REGISTRANTS.
The registrant’s Board has a separately designated Audit Committee established in accordance with Section
3(a)(58)(A) of the Securities Exchange Act of 1934, as amended (15 U.S.C. 78c(a)(58)(A)). The members of the audit committee are Joseph A. Boateng, Albin F. Moschner, John K. Nelson, Chair, Loren M. Starr, Margaret L. Wolff and Robert L. Young.
ITEM 6. SCHEDULE OF INVESTMENTS.
(a) See Portfolio of
Investments in Item 1.
(b) Not applicable.
ITEM 7. DISCLOSURE OF PROXY VOTING POLICIES AND PROCEDURES FOR CLOSED-END MANAGEMENT INVESTMENT
COMPANIES.
Nuveen Fund Advisors, LLC is the registrant’s investment adviser (also referred to as the “Adviser”).
The Adviser is responsible for the on-going monitoring of the Fund’s investment portfolio, managing the Fund’s business affairs and providing certain clerical, bookkeeping and administrative services. The Adviser has engaged Nuveen
Asset Management, LLC (“Sub-Adviser”) as Sub-Adviser to provide discretionary investment advisory services. As part of these services, the Adviser has delegated to the Sub-Adviser the full responsibility for proxy voting on securities
held in the registrant’s portfolio and related duties in accordance with the Sub-Adviser’s policies and procedures. The Adviser periodically monitors the Sub-Adviser’s voting to ensure that it is carrying out its duties. The
Sub-Adviser’s proxy voting policies and procedures are attached to this filing as an exhibit.
ITEM 8. PORTFOLIO MANAGERS OF CLOSED-END MANAGEMENT INVESTMENT COMPANIES.
Nuveen Fund Advisors, LLC is the registrant’s investment adviser (also referred to as the “Adviser”). The Adviser is responsible for the
selection and on-going monitoring of the Fund’s investment portfolio, managing the Fund’s business affairs and providing certain clerical, bookkeeping and administrative services. The Adviser has engaged Nuveen Asset Management, LLC
(“Nuveen Asset Management” or “Sub-Adviser”) as Sub-Adviser to provide discretionary investment advisory services. The following section provides information on the portfolio managers at the Sub-Adviser:
ITEM 8(a)(1). PORTFOLIO MANAGER BIOGRAPHIES
As of the
date of filing this report, the following individuals at the Sub-Adviser (the “Portfolio Managers”) have primary responsibility for the day-to-day implementation of the registrant’s investment strategies:
David Friar, Managing Director and Portfolio Manager for Nuveen’s multi-asset portfolio management team. He joined the team managing the Equity,
Mid-Cap and Small Cap Index Strategies in 2000 and became part of the enhanced equity index team in 2007. Additionally, he is a member of the investment team responsible for several other quantitative products, including the Equity Option Overwrite
Strategies. David joined the firm in 1999 as a member of the performance measurement group. Before his role in portfolio management, he provided quantitative analysis for equity portfolios and constructed quantitatively driven portfolios for
institutional and taxable clients.
Jim Campagna, CFA, Head of Equity Index Strategies, oversees equity index strategies for Nuveen Equities. He is
responsible for all equity index, social choice, and equity ETF strategies. Prior to joining the firm in 2005, he was a portfolio manager at Mellon Capital Management where he was responsible for several funds and was an index strategy leader for
the MSCI EAFE mandates.
Lei Liao, CFA, is an equity index portfolio manager for Nuveen Quantitative Strategies. He has portfolio management
responsibilities for all equity index, social choice equity, and equity ETF strategies. Prior to joining the firm in 2012, he was a senior equity portfolio manager at Northern Trust Corp.
Darren Tran, CFA, is a senior director for Nuveen Quantitative Strategies. He has portfolio management responsibilities for all equity index, social
choice equity, and equity ETF strategies. Darren joined the firm in 2005 as a foreign currency trader and entered the investment industry in 2000. Prior to joining the firm, he held a position at Morgan Stanley in Corporate Treasury.
ITEM 8(a)(2). OTHER ACCOUNTS MANAGED BY PORTFOLIO MANAGERS
Other Accounts Managed. In addition to managing the registrant, the Portfolio Managers are also primarily responsible for the day-to-day portfolio
management of the following accounts:
|
|
|
|
|
|
|
|
|
|
|
| Portfolio Manager |
|
Type of Account Managed |
|
Number of
Accounts |
|
|
Assets* |
|
| David Friar |
|
Registered Investment Company |
|
|
3 |
|
|
$ |
1.71 billion |
|
|
|
Other Pooled Investment Vehicles |
|
|
0 |
|
|
$ |
0 |
|
|
|
Other Accounts |
|
|
2 |
|
|
$ |
3.01 million |
|
|
|
|
|
| Jim Campagna |
|
Registered Investment Company |
|
|
27 |
|
|
$ |
165 billion |
|
|
|
Other Pooled Investment Vehicles |
|
|
6 |
|
|
$ |
2.83 billion |
|
|
|
Other Accounts |
|
|
7 |
|
|
$ |
1.84 billion |
|
|
|
|
|
| Lei Liao |
|
Registered Investment Company |
|
|
27 |
|
|
$ |
165 billion |
|
|
|
Other Pooled Investment Vehicles |
|
|
6 |
|
|
$ |
2.83 billion |
|
|
|
Other Accounts |
|
|
7 |
|
|
$ |
1.84 billion |
|
|
|
|
|
| Darren Tran |
|
Registered Investment Company |
|
|
17 |
|
|
$ |
159.83 billion |
|
|
|
Other Pooled Investment Vehicles |
|
|
6 |
|
|
$ |
2.83 billion |
|
|
|
Other Accounts |
|
|
7 |
|
|
$ |
1.84 billion |
|
| * |
Assets are as of December 31, 2023. |
POTENTIAL MATERIAL CONFLICTS OF INTEREST
Actual or apparent conflicts of interest may arise when a portfolio manager has day-to-day management responsibilities with respect to more than one account.
More specifically, portfolio managers who manage multiple accounts are presented a number of potential conflicts, including, among others, those discussed below.
The management of multiple accounts may result in a portfolio manager devoting unequal time and attention to the management of each account. Nuveen Asset
Management seeks to manage such competing interests for the time and attention of portfolio managers by having portfolio managers focus on a particular investment discipline. Most accounts managed by a portfolio manager in a particular investment
strategy are managed using the same investment models.
If a portfolio manager identifies a limited investment opportunity which may be suitable for more
than one account, an account may not be able to take full advantage of that opportunity due to an allocation of filled purchase or sale orders across all eligible accounts. To deal with these situations, Nuveen Asset Management has adopted
procedures for allocating limited opportunities across multiple accounts.
With respect to many of its clients’ accounts, Nuveen Asset Management
determines which broker to use to execute transaction orders, consistent with its duty to seek best execution of the transaction. However, with respect to certain other accounts, Nuveen Asset Management may be limited by the client with respect to
the selection of brokers or may be instructed to direct trades through a particular broker. In these cases, Nuveen Asset Management may place separate, non-simultaneous, transactions for a Fund and other accounts which may temporarily affect the
market price of the security or the execution of the transaction, or both, to the detriment of the Fund or the other accounts.
Some clients are subject
to different regulations. As a consequence of this difference in regulatory requirements, some clients may not be permitted to engage in all the investment techniques or transactions or to engage in these transactions to the same extent as the other
accounts managed by a portfolio manager. Finally, the appearance of a conflict of interest may arise where Nuveen Asset Management has an incentive, such as a performance-based management fee, which relates to the management of some accounts, with
respect to which a portfolio manager has day-to-day management responsibilities.
Conflicts of interest may also arise when the Sub-Adviser invests one or
more of its client accounts in different or multiple parts of the same issuer’s capital structure, including investments in public versus private securities, debt versus equity, or senior versus junior/subordinated debt, or otherwise where
there are different or inconsistent rights or benefits. Decisions or actions such as investing, trading, proxy voting, exercising, waiving or amending rights or covenants, workout activity, or serving on a board, committee or other involvement in
governance may result in conflicts of interest between clients holding different securities or investments. Generally, individual portfolio managers will seek to act in a manner that they believe serves the best interest of the accounts they manage.
In cases where a portfolio manager or team faces a conflict among its client accounts, it will seek to act in a manner that it believes best reflects its overall fiduciary duty, which may result in relative advantages or disadvantages for particular
accounts.
Nuveen Asset Management has adopted certain compliance procedures which are designed to address these types of conflicts common among
investment managers. However, there is no guarantee that such procedures will detect each and every situation in which a conflict arises.
Nuveen Asset
Management or its affiliates, including TIAA, sponsor an array of financial products for retirement and other investment goals, and provide services worldwide to a diverse customer base. Accordingly, from time to time, a Fund may be restricted from
purchasing or selling securities, or from engaging in other investment activities because of regulatory, legal or contractual restrictions that arise due to another client account’s investments and/or the internal policies of Nuveen Asset
Management, TIAA or its affiliates designed to comply with such restrictions. As a result, there may be periods, for example, when Nuveen Asset Management will not initiate or recommend certain types of transactions in certain securities or
instruments with respect to which investment limits have been reached.
The investment activities of Nuveen Asset Management or its affiliates may also
limit the investment strategies and rights of the Funds. For example, in certain circumstances where the Funds invest in securities issued by companies that operate in certain regulated industries, in certain emerging or international markets, or
are subject to corporate or regulatory ownership definitions, or invest in certain futures and derivative transactions, there may be limits on the aggregate amount invested by Nuveen Asset Management or its affiliates for the Funds and other client
accounts that may not be exceeded without the grant of a license or other regulatory or corporate consent. If certain aggregate ownership thresholds are reached or certain transactions undertaken, the ability of Nuveen Asset Management, on behalf of
the Funds or other client accounts, to purchase or dispose of investments or exercise rights or undertake business transactions may be restricted by regulation or otherwise impaired. As a result, Nuveen Asset Management, on behalf of the Funds or
other client accounts, may limit purchases, sell existing investments, or otherwise restrict or limit the exercise of rights (including voting rights) when Nuveen Asset Management, in its sole discretion, deems it appropriate in light of potential
regulatory or other restrictions on ownership or other consequences resulting from reaching investment thresholds.
ITEM 8(a)(3). FUND MANAGER
COMPENSATION
As of the most recently completed fiscal year end, the primary Portfolio Managers’ compensation is as follows:
Portfolio manager compensation consists primarily of base salary and variable components consisting of (i) a cash bonus; (ii) a long-term performance award;
and (iii) participation in a profits interest plan.
Base salary. A portfolio manager’s base salary is determined based upon an analysis of
the portfolio manager’s general performance, experience and market levels of base pay for such position.
Cash bonus. A portfolio manager is
eligible to receive an annual cash bonus that is based on three variables: risk-adjusted investment performance relative to benchmark generally measured over the most recent one, three and five year periods (unless the portfolio manager’s
tenure is shorter), ranking versus Morningstar peer funds generally measured over the most recent one, three and five year periods (unless the portfolio manager’s tenure is shorter), and management and peer reviews.
Long-term performance award. A portfolio manager is eligible to receive a long-term performance award that
vests after three years. The amount of the award when granted is based on the same factors used in determining the cash bonus. The value of the award at the completion of the three-year vesting period is adjusted based on the risk-adjusted
investment performance of Fund(s) managed by the portfolio manager during the vesting period and the performance of the TIAA organization as a whole.
Profits interest plan. Portfolio managers are eligible to receive profits interests in Nuveen Asset Management and its affiliate, Teachers Advisors,
LLC, which vest over time and entitle their holders to a percentage of the firms’ annual profits. Profits interests are allocated to each portfolio manager based on such person’s overall contribution to the firms.
There are generally no differences between the methods used to determine compensation with respect to the Fund and the Other Accounts shown in the table
above.
ITEM 8(a)(4). OWNERSHIP OF DIAX SECURITIES AS OF DECEMBER 31, 2023
|
|
|
|
|
|
|
|
|
|
|
|
|
|
|
|
|
|
|
|
|
|
|
|
|
|
|
| Name of Portfolio Manager |
|
None |
|
|
$1 -
$10,000 |
|
|
$10,001-
$50,000 |
|
$50,001-
$100,000 |
|
|
$100,001-
$500,000 |
|
|
$500,001-
$1,000,000 |
|
|
Over $1,000,000 |
|
| David Friar |
|
|
X |
|
|
|
|
|
|
|
|
|
|
|
|
|
|
|
|
|
|
|
|
|
|
|
| Jim Campagna |
|
|
X |
|
|
|
|
|
|
|
|
|
|
|
|
|
|
|
|
|
|
|
|
|
|
|
| Lei Liao |
|
|
X |
|
|
|
|
|
|
|
|
|
|
|
|
|
|
|
|
|
|
|
|
|
|
|
| Darren Tran |
|
|
X |
|
|
|
|
|
|
|
|
|
|
|
|
|
|
|
|
|
|
|
|
|
|
|
ITEM 9. PURCHASES OF EQUITY SECURITIES BY CLOSED-END MANAGEMENT INVESTMENT COMPANY AND AFFILIATED
PURCHASERS.
Not applicable.
ITEM 10. SUBMISSION OF
MATTERS TO A VOTE OF SECURITY HOLDERS.
There have been no material changes to the procedures by which shareholders may recommend nominees to the
registrant’s Board implemented after the registrant last provided disclosure in response to this Item.
ITEM 11. CONTROLS AND PROCEDURES.
| |
(a) |
The registrant’s principal executive and principal financial officers, or persons performing similar
functions, have concluded that the registrant’s disclosure controls and procedures (as defined in Rule 30a-3(c) under the Investment Company Act of 1940, as amended (the “1940 Act”) (17 CFR 270.30a-3(c))) are effective, as of a date
within 90 days of the filing date of this report that includes the disclosure required by this paragraph, based on their evaluation of the controls and procedures required by Rule 30a-3(b) under the 1940 Act (17 CFR 270.30a-3(b)) and Rules 13a-15(b)
or 15d-15 (b) under the Securities Exchange Act of 1934, as amended (the “Exchange Act”) (17 CFR 240.13a-15(b) or 240.15d-15 (b)). |
| |
(b) |
There were no changes in the registrant’s internal control over financial reporting (as defined in Rule
30a-3(d) under the 1940 Act (17 CFR 270.30a-3(d)) that occurred during the period covered by this report that has materially affected, or is reasonably likely to materially affect, the registrant’s internal control over financial reporting.
|
ITEM 12. DISCLOSURE OF SECURITIES LENDING ACTIVITIES FOR CLOSED-END MANAGEMENT INVESTMENT
COMPANIES.
| |
(a) |
The following provides dollar amounts of income and fees/compensation related to securities lending
activities of the Fund during the fiscal year ended December 31, 2023: |
|
|
|
|
|
| Gross income from securities lending activities |
|
$ |
46,433 |
|
| Fees and/or compensation paid for securities lending activities and related
services: |
|
|
|
|
| Fees paid to securities lending agent from a revenue split |
|
|
(219 |
) |
| Fees not included in a revenue split |
|
|
|
|
| Fees paid for any cash collateral management service (including fees deducted from a pooled cash
collateral reinvestment vehicle) that are not included in a revenue split |
|
|
(316 |
) |
| Administrative fees not included in a revenue split |
|
|
— |
|
| Indemnification fees not included in a revenue split |
|
|
— |
|
| Rebate (paid to borrower) |
|
|
(43,405 |
) |
| Other fees not included in a revenue split |
|
|
— |
|
| Aggregate fees/compensation for securities lending activities |
|
|
(43,941 |
) |
| Net income from securities lending activities |
|
$ |
2,492 |
|
| |
(b) |
The Fund may lend securities representing up to one-third of the value of its total assets to broker-dealers,
banks, and other institutions in order to generate additional income. When loaning securities, the Fund retains the benefits of owning the securities, including the economic equivalent of dividends or interest generated by the security. The loans
are continuous, can be recalled at any time, and have no set maturity. When the Fund loans its portfolio securities, it will receive, at the inception of each loan, cash collateral equal to an amount not less than 100% of the market value of the
loaned securities. The actual percentage of the cash collateral will vary depending on the asset type of the loaned securities. The Fund’s custodian, State Street Bank and Trust Company, serves as the securities lending agent to the Fund.
Pursuant to a Securities Lending Authorization Agreement and in accordance with procedures established by the Board of Trustees, State Street Bank and Trust Company effects loans of Fund securities to any firm on a list of approved borrowers,
negotiates loan terms, monitors the value of the loaned securities and collateral, requests additional collateral as necessary, manages reinvestment of collateral in a pooled cash collateral reinvestment vehicle, arranges for the return of loaned
securities to the Fund, and maintains records and prepares reports regarding loans that are made and the income derived therefrom. |
ITEM 13. EXHIBITS.
File the exhibits listed below as part of this Form.
(a)(1)
Any code of ethics, or amendment thereto, that is the subject of the disclosure required by Item 2, to the extent that the registrant intends to satisfy the Item 2 requirements through filing of an exhibit: Not applicable because the code
is posted on registrant’s website at www.nuveen.com/fund-governance and there were no amendments during the period covered by this report. (To view the code, click on Code of Conduct.)
(a)(2) A separate certification for each principal executive officer and principal financial officer of the registrant as required
by Rule 30a-2(a) under the 1940 Act (17 CFR 270.30a-2(a)) in the exact form set forth below: Ex-99.CERT Attached hereto.
(a)(3) Any written
solicitation to purchase securities under Rule 23c-1 under the 1940 Act (17 CFR 270.23c-1) sent or given during the period covered by the report by or on behalf of the registrant to 10 or more persons. Not applicable.
(a)(4) Change in registrant’s independent public accountant. Not applicable.
(b) If the report is filed under Section 13(a) or 15(d) of the Exchange Act, provide the certifications required by Rule 30a-2(b)
under the 1940 Act (17 CFR 270.30a-2(b)); Rule 13a-14(b) or Rule 15d-14(b) under the Exchange Act (17 CFR 240.13a-14(b) or 240.15d-14(b)), and Section 1350 of Chapter 63 of Title 18 of the United States Code (18 U.S.C. 1350) as an exhibit. A
certification furnished pursuant to this paragraph will not be deemed “filed” for purposes of Section 18 of the Exchange Act (15 U.S.C. 78r), or otherwise subject to the liability of that section. Such certification will not be deemed
to be incorporated by reference into any filing under the Securities Act of 1933 or the Exchange Act, except to the extent that the registrant specifically incorporates it by reference. Ex-99.906 CERT attached hereto.
SIGNATURES
Pursuant to the requirements of the Securities Exchange Act of 1934 and the Investment Company Act of 1940, the registrant has duly caused this report to be
signed on its behalf by the undersigned, thereunto duly authorized.
(Registrant) Nuveen Dow 30SM
Dynamic Overwrite Fund
|
|
|
|
|
| By (Signature and Title) |
|
/s/ David J. Lamb |
|
|
|
|
David J. Lamb |
|
|
|
|
Chief Administrative Officer |
|
|
|
|
| Date: March 7, 2024 |
|
|
Pursuant to the requirements of the Securities Exchange Act of 1934 and the Investment Company Act of 1940, this report has
been signed below by the following persons on behalf of the registrant and in the capacities and on the dates indicated.
|
|
|
|
|
| By (Signature and Title) |
|
/s/ David J. Lamb |
|
|
|
|
David J. Lamb |
|
|
|
|
Chief Administrative Officer |
|
|
|
|
(principal executive officer) |
|
|
|
|
| Date: March 7, 2024 |
|
|
|
|
|
| By (Signature and Title) |
|
/s/ E. Scott Wickerham |
|
|
|
|
E. Scott Wickerham |
|
|
|
|
Vice President and Controller |
|
|
|
|
(principal financial officer) |
|
|
|
|
| Date: March 7, 2024 |
|
|
Exhibit 99.CERT
CERTIFICATION
I, David J. Lamb, certify that:
1. I have reviewed this report on Form N-CSR of Nuveen Dow 30SM Dynamic Overwrite
Fund;
2. Based on my knowledge, this report does not contain any untrue statement of a material fact or omit to state a material fact
necessary to make the statements made, in light of the circumstances under which such statements were made, not misleading with respect to the period covered by this report;
3. Based on my knowledge, the financial statements, and other financial information included in this report, fairly present in all material
respects the financial condition, results of operations, changes in net assets, and cash flows (if the financial statements are required to include a statement of cash flows) of the registrant as of, and for, the periods presented in this report;
4. The registrant’s other certifying officer and I are responsible for establishing and maintaining disclosure controls and
procedures (as defined in Rule 30a-3(c) under the Investment Company Act of 1940) and internal control over financial reporting (as defined in Rule 30a-3(d) under the Investment Company Act of 1940) for the registrant and have:
| |
(a) |
designed such disclosure controls and procedures, or caused such disclosure controls and procedures to be
designed under our supervision, to ensure that material information relating to the registrant, including its consolidated subsidiaries, is made known to us by others within those entities, particularly during the period in which this report is
being prepared; |
| |
(b) |
designed such internal control over financial reporting, or caused such internal control over financial
reporting to be designed under our supervision, to provide reasonable assurance regarding the reliability of financial reporting and the preparation of financial statements for external purposes in accordance with generally accepted accounting
principles; |
| |
(c) |
evaluated the effectiveness of the registrant’s disclosure controls and procedures and presented in this
report our conclusions about the effectiveness of the disclosure controls and procedures, as of a date within 90 days prior to the filing date of this report based on such evaluation; and |
| |
(d) |
disclosed in this report any change in the registrant’s internal control over financial reporting that
occurred during the period covered by this report that has materially affected, or is reasonably likely to materially affect, the registrant’s internal control over financial reporting; and |
5. The registrant’s other certifying officer and I have disclosed to the registrant’s auditors and the audit committee of the
registrant’s board of directors (or persons performing the equivalent functions):
| |
(a) |
all significant deficiencies and material weaknesses in the design or operation of internal control over
financial reporting which are reasonably likely to adversely affect the registrant’s ability to record, process, summarize, and report financial information; and |
| |
(b) |
any fraud, whether or not material, that involves management or other employees who have a significant role in
the registrant’s internal control over financial reporting. |
|
|
|
|
|
|
|
| Date: March 7, 2024 |
|
|
|
|
|
/s/ David J. Lamb |
|
|
|
|
|
|
David J. Lamb |
|
|
|
|
|
|
Chief Administrative Officer |
|
|
|
|
|
|
(principal executive officer) |
CERTIFICATION
I, E. Scott Wickerham, certify that:
1.
I have reviewed this report on Form N-CSR of Nuveen Dow 30SM Dynamic Overwrite Fund;
2. Based on my knowledge, this report does not contain any untrue statement of a material fact or omit to state a material fact necessary to
make the statements made, in light of the circumstances under which such statements were made, not misleading with respect to the period covered by this report;
3. Based on my knowledge, the financial statements, and other financial information included in this report, fairly present in all material
respects the financial condition, results of operations, changes in net assets, and cash flows (if the financial statements are required to include a statement of cash flows) of the registrant as of, and for, the periods presented in this report;
4. The registrant’s other certifying officer and I are responsible for establishing and maintaining disclosure controls and
procedures (as defined in Rule 30a-3(c) under the Investment Company Act of 1940) and internal control over financial reporting (as defined in Rule 30a-3(d) under the Investment Company Act of 1940) for the registrant and have:
| |
(a) |
designed such disclosure controls and procedures, or caused such disclosure controls and procedures to be
designed under our supervision, to ensure that material information relating to the registrant, including its consolidated subsidiaries, is made known to us by others within those entities, particularly during the period in which this report is
being prepared; |
| |
(b) |
designed such internal control over financial reporting, or caused such internal control over financial
reporting to be designed under our supervision, to provide reasonable assurance regarding the reliability of financial reporting and the preparation of financial statements for external purposes in accordance with generally accepted accounting
principles; |
| |
(c) |
evaluated the effectiveness of the registrant’s disclosure controls and procedures and presented in this
report our conclusions about the effectiveness of the disclosure controls and procedures, as of a date within 90 days prior to the filing date of this report based on such evaluation; and |
| |
(d) |
disclosed in this report any change in the registrant’s internal control over financial reporting that
occurred during the period covered by this report that has materially affected, or is reasonably likely to materially affect, the registrant’s internal control over financial reporting; and |
5. The registrant’s other certifying officer and I have disclosed to the registrant’s auditors and the audit committee of the
registrant’s board of directors (or persons performing the equivalent functions):
| |
(a) |
all significant deficiencies and material weaknesses in the design or operation of internal control over
financial reporting which are reasonably likely to adversely affect the registrant’s ability to record, process, summarize, and report financial information; and |
| |
(b) |
any fraud, whether or not material, that involves management or other employees who have a significant role in
the registrant’s internal control over financial reporting. |
|
|
|
|
|
|
|
| Date: March 7, 2024 |
|
|
|
|
|
/s/ E. Scott Wickerham |
|
|
|
|
|
|
E. Scott Wickerham |
|
|
|
|
|
|
Vice President and Controller |
|
|
|
|
|
|
(principal financial officer) |
Exhibit 99.906CERT
Certification Pursuant to 18 U.S.C. 1350, as adopted pursuant to Section 906 of the Sarbanes-Oxley Act of 2002; provided by the Chief Executive Officer
and Chief Financial Officer, based on each such officer’s knowledge and belief.
The undersigned officers of Nuveen Dow 30SM Dynamic Overwrite Fund (the “Fund”) certify that, to the best of each such officer’s knowledge and belief:
| |
1. |
The Form N-CSR of the Fund for the period ended December 31, 2023 (the “Report”) fully complies with
the requirements of Section 13(a) or 15(d) of the Securities Exchange Act of 1934; and |
| |
2. |
The information contained in the Report fairly presents, in all material respects, the financial condition and
results of operations of the Fund. |
|
|
|
|
|
|
|
| Date: March 7, 2024 |
|
|
|
|
|
|
|
|
|
|
|
|
|
|
|
|
/s/ David J. Lamb |
|
|
|
|
|
|
David J. Lamb |
|
|
|
|
|
|
Chief Administrative Officer |
|
|
|
|
|
|
(principal executive officer) |
|
|
|
|
|
|
|
|
|
|
/s/ E. Scott Wickerham |
|
|
|
|
|
|
E. Scott Wickerham |
|
|
|
|
|
|
Vice President and Controller |
|
|
|
|
|
|
(principal financial officer) |
|
|
| Nuveen Proxy Voting Policy |
|
|
|
| Policy Purpose and Statement
Proxy voting is the primary means by which shareholders may influence a publicly traded company’s governance and operations and thus create the potential for value
and positive long-term investment performance. When an SEC registered investment adviser has proxy voting authority, the adviser has a fiduciary duty to vote proxies in the best interests of its clients and must not subrogate its clients’
interests to its own. In their capacity as fiduciaries and investment advisers, Nuveen Asset Management, LLC (“NAM”), Teachers Advisors, LLC (“TAL”) and TIAA-CREF Investment Management, LLC (“TCIM”), (each an
“Adviser” and, collectively, the “Advisers”), vote proxies for the Portfolio Companies held by their respective clients, including investment companies and other pooled investment vehicles, institutional and retail separate
accounts, and other clients as applicable. The Advisers have adopted this Policy, the Nuveen Proxy Voting Guidelines, and the Nuveen Proxy Voting Conflicts of Interest Policy for voting the proxies of the Portfolio Companies they manage. The
Advisers leverage the expertise and services of an internal group referred to as Nuveen’s Stewardship Group to administer the Advisers’ proxy voting. The Stewardship Group adheres to the Advisers’ Proxy Voting Guidelines which are
reasonably designed to ensure that the Advisers vote client securities in the best interests of the Advisers’ clients. |
|
Applicability
This Policy applies to employees of Nuveen acting on behalf of Nuveen Asset Management, LLC, (“NAM”),Teachers Advisors, LLC,
(“TAL”) and TIAA-CREF Investment Management, LLC (“TCIM”), each an “Adviser” and, collectively, referred to as the “Advisers”) |
|
|
|
| |
|
Policy Statement
Proxy voting is a key component of a Portfolio Company’s corporate governance program and is the primary method for exercising shareholder rights and influencing
the Portfolio Company’s behavior. Nuveen makes informed voting decisions in compliance with Rule 206(4)-6 (the “Rule”) of the Investment Advisers Act of 1940, as amended (the “Advisers
Act”), and applicable laws and regulations, (e.g., the Employee Retirement Income Security Act of 1974, “ERISA”).
|
Enforcement
As provided in the TIAA Code of Business Conduct, all employees are expected to comply with applicable laws and regulations, as well as the relevant policies, procedures
and compliance manuals that apply to Nuveen’s business activities. Violation of this Policy may result in disciplinary action up to and including termination of employment.
Terms and Definitions
Advisory
Personnel includes the Adviser’s portfolio managers and research analysts.
Proxy Voting Guidelines (the
‘’Guidelines’’) are a set of pre-determined principles setting forth the manner in which the Advisers intend to vote on specific voting categories, and serve to assist clients,
Portfolio Companies, and other interested parties in understanding how the Advisers intend to vote on proxy-related matters. The Guidelines are not exhaustive and do not necessarily dictate how the Advisers will ultimately vote with respect to any
proposal or resolution. While the Guidelines are developed, maintained, and implemented by the Stewardship Group, and reviewed by the Nuveen Proxy Voting Committee, the portfolio managers of the Advisers maintain the ultimate decision-making
authority with respect to how proxies will be voted.
Portfolio Company includes any publicly traded company held in an account that is managed
by an Adviser.
Policy Requirements
Investment advisers, in accordance with the Rule, are required to (i) adopt and implement written policies and procedures that are reasonably designed to ensure
that proxies are voted in the best interest of clients, and address resolution of material conflicts that may arise, (ii) describe their proxy voting procedures to their clients and provide copies on request, and (iii) disclose to clients
how they may obtain information on how the Advisers voted their proxies.
The Nuveen Proxy Voting Committee (the “Committee”), the Advisers, the
Stewardship Group and Nuveen Compliance are subject to the respective requirements outlined below under Roles and Responsibilities.
Although it is the
general policy to vote all applicable proxies received in a timely fashion with respect to securities selected by an Adviser for current clients, the Adviser may refrain from voting in certain circumstances where such voting would be
disadvantageous, materially burdensome or impractical, or otherwise inconsistent with the overall best interest of clients.
Roles
and Responsibilities
Nuveen Proxy Voting Committee
The purpose of the Committee is to establish a governance framework to oversee the proxy voting activities of the Advisers in accordance with the Policy. The
Committee’s voting members will be comprised from Research, the Advisers, and Nuveen’s Stewardship Group. Non-voting members will be comprised from Nuveen Legal, Nuveen Compliance, Nuveen Advisory
Product, and Nuveen Investment Risk. The Committee may invite others on a standing, routine and/or or ad hoc basis to attend Committee meetings. The CCOs of CREF/TC Funds and the Nuveen Funds shall be standing, non-
voting invitees. The Committee has delegated responsibility for the implementation and ongoing administration of the Policy
to the Stewardship Group, subject to the Committee’s ultimate oversight and responsibility as outlined in the Committee’s Proxy Voting Charter.
Advisers
| |
1. |
Advisory Personnel maintain the ultimate decision-making authority with respect to how proxies will be voted, unless
otherwise instructed by a client, and may determine to vote contrary to the Guidelines and/or a vote recommendation of the Stewardship Group if such Advisory Personnel determines it is in the best interest of the Adviser’s clients to do so. The
rationale for all such contrary vote determinations will be documented and maintained. |
| |
2. |
When voting proxies for different groups of client accounts, Advisory Personnel may vote proxies held by the respective
client accounts differently depending on the facts and circumstances specific to such client accounts. The rationale for all such vote determinations will be documented and maintained. |
| |
3. |
Advisory Personnel must comply with the Nuveen Proxy Voting Conflicts of Interest Policy with respect to potential
material conflicts of interest. |
Nuveen Stewardship Group
| |
1. |
Performs day-to-day administration of the
Advisers’ proxy voting processes. |
| |
2. |
Seeks to vote proxies in adherence to the Guidelines, which have been constructed in a manner intended to align with the
best interests of clients. In applying the Guidelines, the Stewardship Group, on behalf of the Advisers, takes into account several factors, including, but not limited to: |
| |
• |
|
Input from Advisory Personnel |
| |
• |
|
Specific Portfolio Company context, including environmental, social and governance practices, and financial performance.
|
| |
3. |
Assists in the development of securities lending recall protocols in cooperation with the Securities Lending Committee.
|
| |
4. |
Performs Form N-PX filings in accordance with regulatory requirements.
|
| |
5. |
Delivers copies of the Advisers’ Policy to clients and prospective clients upon request in a timely manner, as
appropriate. |
| |
6. |
Assists with the disclosure of proxy votes as applicable on corporate websites and elsewhere as required by applicable
regulations. |
| |
7. |
Prepares reports of proxies voted on behalf of the Advisers’ investment company clients to their Boards or
committees thereof, as applicable. |
| |
8. |
Performs an annual vote reconciliation for review by the Committee. |
| |
9. |
Arranges the annual service provider due diligence, including a review of the service provider’s potential conflicts
of interests, and presents the results to the Committee. |
| |
10. |
Facilitates quarterly Committee meetings, including agenda and meeting minute preparation. |
| |
11. |
Complies with the Nuveen Proxy Voting Conflicts of Interest Policy with respect to potential material conflicts of
interest. |
| |
12. |
Creates and retains certain records in accordance with Nuveen’s Record Management program. |
| |
13. |
Oversees the proxy voting service provider with respect to its responsibilities, including making and retaining certain
records as required under applicable regulation. |
Nuveen Compliance
| |
1. |
Seeks to ensure proper disclosure of Advisers’ Policy to clients as required by regulation or otherwise.
|
| |
2. |
Seeks to ensure proper disclosure to clients of how they may obtain information on how the Advisers voted their proxies.
|
3
| |
3. |
Assists the Stewardship Group with arranging the annual service provider due diligence and presenting the results to the
Committee. |
| |
4. |
Monitors for compliance with this Policy and retains records relating to its monitoring activities pursuant to
Nuveen’s Records Management program. |
Nuveen Legal
| |
1. |
Provide legal guidance as requested. |
Governance
Review and
Approval
This Policy will be reviewed at least annually and will be updated sooner if substantive changes are necessary. The Policy Owner, the Committee and
the NEFI Compliance Committee are responsible for the review and approval of this Policy.
Implementation
Nuveen has established the Committee to provide centralized management and oversight of the proxy voting process administered by the Stewardship Group for the Advisers
in accordance with its Proxy Voting Committee Charter and this Policy.
Exceptions
Any request for a proposed exception or variation to this Policy will be submitted to the Committee for approval and reported to the appropriate governance committee(s),
where appropriate.
Related Documents
| |
• |
|
Nuveen Proxy Voting Committee Charter |
| |
• |
|
Nuveen Proxy Voting Guidelines |
| |
• |
|
Nuveen Proxy Voting Conflicts of Interest Policy and Procedures |
| |
• |
|
Nuveen Policy Statement on Responsible Investing |
|
|
|
| |
|
|
| Policy Adoption Date
|
|
February 3, 2020
|
| Effective Date of Current
Policy/Last Date Reviewed |
|
December 18, 2023 |
| Governance |
|
NEFI Compliance Committee |
| Policy Owner |
|
Nuveen Proxy Voting Committee |
| Policy Leader |
|
Nuveen Compliance |
G-3250864P-E1123W
4
Nuveen Dow 30SM Dynamic ... (NYSE:DIAX)
Historical Stock Chart
Von Feb 2025 bis Mär 2025

Nuveen Dow 30SM Dynamic ... (NYSE:DIAX)
Historical Stock Chart
Von Mär 2024 bis Mär 2025

