UNITED STATES
SECURITIES AND EXCHANGE COMMISSION
Washington, D.C. 20549
FORM 6-K
REPORT OF
FOREIGN PRIVATE ISSUER
PURSUANT TO RULE 13a-16 OR
15d-16
UNDER THE SECURITIES EXCHANGE ACT OF 1934
For the month of August, 2023
Commission File Number: 001-41329
Allego N.V.
(Translation of registrant’s name into English)
Westervoortsedijk 73 KB
6827 AV Arnhem, the Netherlands
(Address of principal executive offices)
Indicate by check mark whether
the registrant files or will file annual reports under cover Form 20-F or Form 40-F.
Form
20-F ☒ Form 40-F ☐
Indicate by check mark if the registrant is submitting the Form 6-K in paper as permitted by Regulation S-T Rule 101(b)(1): ☐
Indicate by check mark if the registrant is submitting the Form 6-K in paper as permitted by Regulation S-T Rule 101(b)(7): ☐
The information contained in this Report on Form 6-K included in Exhibit 99.1, except for the quotes of the Chief
Executive Officer and the Chief Financial Officer and the information under the section “2023 Outlook”, is hereby incorporated by reference into Allego N.V.’s (i) Registration Statement on Form
S-8 (File No. 333-272151) and (ii) post-effective Amendment No. 2 to Form F-1 in the Registration Statement on
Form F-3 (Reg. No. 333-264056).
INFORMATION CONTAINED IN THIS FORM 6-K REPORT
The following exhibits are furnished herewith:
SIGNATURES
Pursuant to the requirements of the Securities Exchange Act of 1934, the registrant has duly caused this report to be signed on its behalf by
the undersigned, thereunto duly authorized.
|
|
|
|
|
|
|
| Dated: August 15, 2023 |
|
|
|
ALLEGO N.V. |
|
|
|
|
|
|
|
|
By: |
|
/s/ Mathieu Bonnet |
|
|
|
|
Name: |
|
Mathieu Bonnet |
|
|
|
|
Title: |
|
Chief Executive Officer |
Exhibit 99.1

Allego Reports Solid First-Half 2023 Results
| |
• |
|
First half 2023 revenue increased 34.6% to €68.2 million, compared to €50.7 million in the
prior year period. |
| |
• |
|
First half 2023 charging revenue was up by €27.1 million, or 113.1%, to €51.1 million
compared to €24.0 million for the six months ended June 30, 2022. |
| |
• |
|
First half 2023 net loss was €(38.9) million, compared to €(247.1) million in the prior-year period.
|
| |
• |
|
Operational EBITDA was €11.7 million increasing steadily compared to the prior-year period loss of
€(1.5) million. |
| |
• |
|
Allego entered into a long-term agreement with Esso Deutschland through 2028 to sell compliance credits for a
potential total value of up to €185 million. |
| |
• |
|
In a
first-of-its-kind collaboration, Allego is partnering with gas station brand OIL! Tank & Go in Denmark to equip its 80
stations of which 14 charging sites are expected to be fully operational and added to the Company’s network in the first quarter of 2024. |
ARNHEM, Netherlands – August 15, 2023 – Allego N.V. (“Allego” or the “Company”) (NYSE: ALLG), a
leading pan-European public electric vehicle fast and ultra-fast charging network, today announced its results and key performance metrics for the first half of 2023.
First Half 2023 Ended June 30, 2023
| |
• |
|
Revenue climbed 34.6% to €68.2 million from €50.7 million in the same period of 2022.
|
| |
• |
|
Charging revenue was up by €27.1 million, or 113.1%, to €51.1 million compared to
€24.0 million for the six months ended June 30, 2022. The improvement was driven by a mix of increased utilization rates, premium pricing on ultra-fast and fast chargers, and an increase of 37.9% in energy sold compared with the
previous period. |
| |
• |
|
Services revenue decreased to €17.1 million compared to €26.7 million, completely driven by
the expected phasing out of the Carrefour project compared to the first half of 2022 and before the start-up of new projects in H2 2023. |
| |
• |
|
Gross profit grew to €20.5 million, compared to €2.3 million in the prior-year period. This
increase of €18.2 million was primarily driven by an expansion in gross profit on charging revenue of €21.7 million, partly offset by a decrease of €3.5 million in services revenue gross margin. This shift towards
charging revenue from service revenue is in line with Allego’s business strategy. |
| |
• |
|
First half 2023 net loss was €(38.9) million compared to the prior-year period of €(247.1) million;
Operational EBITDA was €11.7 million, compared to the prior-year period of €(1.5) million. The strong improvement in the first half 2023 net results was primarily driven by a substantial decrease in
non-cash one-time items related to the New York Stock Exchange listing and an improved operational performance on the charging revenue. |
| |
• |
|
As of June 30, 2023, the Company’s network of ultra-fast charging points rose by 107% compared to the
same period in the previous year, demonstrating Allego’s focus on its ultra-fast charging network. |

|
|
|
|
|
|
|
|
|
|
|
|
|
| |
|
Six Months Ended June 30 |
|
| Metrics |
|
2023 |
|
|
2022 |
|
|
% Change |
|
| Average Utilization Rate |
|
|
12.6 |
% |
|
|
8.3 |
% |
|
|
51 |
% |
| Average Utilization Rate: Mature (installed before Jan 1, 2023) |
|
|
13.4 |
% |
|
|
— |
|
|
|
— |
|
| Average Utilization Rate: New (installed after Jan 1, 2023) |
|
|
8.9 |
% |
|
|
— |
|
|
|
— |
|
| Total Public Charging Ports(1) |
|
|
29,354 |
|
|
|
29,698 |
|
|
|
-1.2 |
% |
| Recurring Users % |
|
|
80 |
% |
|
|
80 |
% |
|
|
0 |
% |
| Owned Public Charging Ports(1) |
|
|
24,934 |
|
|
|
24,255 |
|
|
|
2.8 |
% |
| # Owned Fast & Ultra-Fast Charging
Ports(1) |
|
|
1,661 |
|
|
|
1,293 |
|
|
|
28.5 |
% |
| Third-Party Public Charging Ports(1) |
|
|
4,420 |
|
|
|
5,443 |
|
|
|
-18.8 |
% |
| Total # Sessions (‘000)(2) |
|
|
5,210 |
|
|
|
4,443 |
|
|
|
17.2 |
% |
| Total Energy Sold (GWh) |
|
|
96.4 |
|
|
|
69.9 |
|
|
|
37.9 |
% |
| Secured Backlog (sites)(1) |
|
|
1,350 |
|
|
|
1,100 |
|
|
|
22.7 |
% |
| (1) |
As of June 30, 2023, and June 30, 2022, respectively |
| (2) |
Total # sessions include owned and third party |
2023 Outlook
Full-Year Guidance Range:
| |
• |
|
Energy Sold: 215 GWh - 225 GWh |
| |
• |
|
Total Revenues: €180 - €200 million |
| |
• |
|
Operational EBITDA: €30 - €40 million |
CEO and CFO Comments and Outlook
Allego’s Chief
Executive Officer, Mathieu Bonnet, commented, “I am pleased with our performance through the first half of 2023. We have focused on the expansion of our ultrafast charging network while increasing our charging revenue. We have significantly
improved our operational EBITDA performance by growing our margins through our execution of power purchase agreements (PPAs), the management of our energy costs globally and the efficiency of our operations. Our consolidated utilization rate climbed
from the prior year, indicating the growing market for EVs as well as the quality of our premium locations. The average utilization rate, adjusted for chargers installed during 2023, was 13.4%, demonstrating that the more mature chargers are
continuing to develop well.”
Mr. Bonnet continued, “We continue to execute our business strategy through agreements such as the one with
Esso in Germany whereby we generate revenue from selling our compliance credits from the renewable energy that is consumed through our charging network, further improving our unit economics in Germany. As communicated before, the majority of our
network’s renewable energy will be sourced through the PPA’s completing what we believe to be is a virtuous and beneficial circle for all our stakeholders. As we look ahead to the second half of the year, we anticipate robust utilization
rates and charging revenue growth as we expand our operational footprint.”
Allego’s Chief Financial Officer, Ton Louwers,
said “I am very pleased with our financial performance for the first six months of 2023. In line with our strategy, we see a strong growth in our charging revenue on the back of the build out of the ultra-fast charging network. As a result, our
gross profit increased substantially to €20.5 million, compared to €2.3 million in the prior-year period. Combined with a stable development of our SG&A (adjusted for one-offs) we saw
our Operational EBITDA grow by €13.2 million to €11.7 million, compared to a loss of €(1.5) million in the prior-year period.”
Mr. Louwers added, “The optimization in our working capital management has illustrated our progress to a more steady and stable operational state.
We expect to see a further increase in our inventory, anticipating a further ramp-up of our ultra-fast charging network.
We anticipate a sustained growth trajectory for the full year. We have narrowed our guidance revenue range to between €180 million and
€200 million, while maintaining our Operational EBITDA expectations to be between €30 million and €40 million. We anticipate the energy sold for the year to be between 215 GWh and 225 GWh.”
Key Financials
|
|
|
|
|
|
|
|
|
|
|
|
|
| (in €‘mm) |
|
Six Months Ended
June 30 |
|
| |
|
2023 |
|
|
2022 |
|
|
% Change |
|
| Charging Revenue |
|
|
51.1 |
|
|
|
24.0 |
|
|
|
113.1 |
% |
| Services Revenue |
|
|
17.1 |
|
|
|
26.7 |
|
|
|
-36.1 |
% |
| Total Revenue |
|
|
68.2 |
|
|
|
50.7 |
|
|
|
34.6 |
% |
| Net Loss |
|
|
(38.9 |
) |
|
|
(247.1 |
) |
|
|
|
|
| Operational EBITDA |
|
|
11.7 |
|
|
|
(1.5 |
) |
|
|
|
|
Conference Call Information
Allego will hold a conference call for investors at 8:30 AM Eastern Time today, Tuesday, August 15, 2023, to discuss its results for the second quarter of
2023.
Participants may access the call at
1-877-407-9716, international callers may use 1-201-493-6779 and request to join the Allego earnings call. A live webcast will also be available at https://ir.allego.eu/events-publications.
A telephonic replay of the call will be available shortly after the conclusion of the call and until August 29, 2023. Participants may access the replay 1-844-512-2921, international callers may use 1-412-317-6671 and enter access code 13739126. An archived replay of the call will also be available on the investor portion of the Allego website at https://ir.allego.eu/.
###
About Allego
Allego is a leading provider of electric vehicle charging solutions, dedicated to accelerating the transition to electric mobility with 100% renewable energy.
Allego has developed a comprehensive portfolio of innovative charging infrastructure and proprietary software, including its Allamo and EV Cloud software platforms. With a network of almost 35,000 charging points (and counting) spanning 16
countries, Allego delivers independent, reliable, and safe charging solutions, agnostic of vehicle model or network affiliation. Founded in 2013 and publicly listed on the NYSE in 2022, Allego now employs a team of 220 people striving every day to
make charging accessible, sustainable, and enjoyable for all.
For more information, please visit www.allego.eu.
Forward-Looking Statements
All statements other than
statements of historical facts contained in this press release are forward-looking statements. Allego intends such forward-looking statements to be covered by the safe harbor provisions for forward-looking statements contained in Section 21E of
the Securities Exchange Act of 1934 and the Private Securities Litigation Reform Act of 1995. Forward-looking statements may generally be identified by the use of words such as “believe,” “may,” “will,”
“estimate,” “continue,” “anticipate,” “intend,” “expect,” “should,” “would,” “plan,”, “project,” “forecast,” “predict,”
“potential,” “seem,” “seek,” “future,” “outlook,” “target” or other similar expressions (or the negative versions of such words or expressions) that predict or indicate future events or
trends or that are not statements of historical matters. These forward-looking statements include, without limitation, Allego’s expectations with respect to future performance. These forward-looking statements involve significant risks and
uncertainties that could cause the actual results to differ materially, and potentially adversely, from those expressed or implied in the forward-looking statements. Most of these factors are outside Allego’s control and are difficult to
predict. Factors that may cause such differences include, but are not limited to: (i) changes adversely affecting Allego’s business, (ii) the price and availability of electricity and other energy sources, (iii) the risks
associated with vulnerability to industry downturns and regional or national downturns, (iv) fluctuations in Allego’s revenue and operating results, (v) unfavorable conditions or further disruptions in the capital and credit markets,
(vi) Allego’s ability to generate cash, service indebtedness and incur additional indebtedness, (vii) competition from existing and new competitors, (viii) the growth of the electric vehicle market, (ix) Allego’s
ability to integrate any businesses it may acquire, (x) Allego’s ability to recruit and retain experienced personnel, (xi) risks related to legal proceedings or claims, including liability claims, (xii) Allego’s dependence
on third-party contractors to provide various services, (xiii) data security breaches or other network outage, (xiv) Allego’s ability to obtain additional capital on commercially reasonable terms, (xv) Allego’s ability to
remediate its material weaknesses in internal control over financial reporting, (xvi) the impact of COVID-19, including COVID-19 related supply chain disruptions
and expense increases, (xvii) general economic or political conditions, including the Russia/Ukraine conflict or increased trade restrictions between the United States, Russia, China and other countries, and (xviii) other factors detailed
under the section entitled “Risk Factors” in Allego’s filings with the Securities and Exchange Commission. The foregoing list of factors is not exclusive. If any of these risks materialize or Allego’s assumptions prove incorrect,
actual results could differ materially from the results implied by these forward-looking statements. There may be additional risks
that Allego presently does not know or that Allego
currently believes are immaterial that could also cause actual results to differ from those contained in the forward-looking statements. In addition, forward-looking statements reflect Allego’s expectations, plans or forecasts of future events
and views as of the date of this press release. Allego anticipates that subsequent events and developments will cause Allego’s assessments to change. However, while Allego may elect to update these forward-looking statements at some point in
the future, Allego specifically disclaims any obligation to do so, unless required by applicable law. These forward-looking statements should not be relied upon as representing Allego’s assessments as of any date subsequent to the date of this
press release. Accordingly, undue reliance should not be placed upon the forward-looking statements.
Interim condensed consolidated statement of
profit or loss for the six months ended June 30, 2023 and 2022 (unaudited)
|
|
|
|
|
|
|
|
|
| (in €‘000) |
|
2023 |
|
|
2022
(restated) (1) |
|
| Revenue from contracts with customers |
|
|
|
|
|
|
|
|
| Charging sessions |
|
|
51,139 |
|
|
|
23,994 |
|
| Service revenue from the sale of charging equipment |
|
|
1,485 |
|
|
|
18,442 |
|
| Service revenue from installation services |
|
|
10,283 |
|
|
|
5,964 |
|
| Service revenue from operation and maintenance of charging equipment |
|
|
2,256 |
|
|
|
1,822 |
|
| Service revenue from consulting services |
|
|
3,047 |
|
|
|
470 |
|
| Total revenue from contracts with customers |
|
|
68,210 |
|
|
|
50,692 |
|
| Cost of sales |
|
|
|
|
|
|
|
|
| Cost of sales - charging sessions |
|
|
(37,760 |
) |
|
|
(32,337 |
) |
| Cost of sales - sale of charging equipment |
|
|
(554 |
) |
|
|
(13,022 |
) |
| Cost of sales - installation services |
|
|
(8,637 |
) |
|
|
(2,903 |
) |
| Cost of sales - operation and maintenance of charging equipment |
|
|
(801 |
) |
|
|
(154 |
) |
| Total cost of sales |
|
|
(47,752 |
) |
|
|
(48,416 |
) |
| Gross profit |
|
|
20,458 |
|
|
|
2,276 |
|
| Other income |
|
|
4,153 |
|
|
|
8,987 |
|
| Selling and distribution expenses |
|
|
(1,109 |
) |
|
|
(1,697 |
) |
| General and administrative expenses |
|
|
(47,193 |
) |
|
|
(271,653 |
) |
| Operating loss |
|
|
(23,691 |
) |
|
|
(262,087 |
) |
| Finance income/(costs) |
|
|
(14,748 |
) |
|
|
15,173 |
|
| Loss before income tax |
|
|
(38,439 |
) |
|
|
(246,914 |
) |
| Income tax |
|
|
(505 |
) |
|
|
(161 |
) |
| Loss for the half-year |
|
|
(38,944 |
) |
|
|
(247,075 |
) |
| Attributable to: |
|
|
|
|
|
|
|
|
| Equity holders of the Company |
|
|
(38,812 |
) |
|
|
(246,913 |
) |
| Non-controlling interests |
|
|
(132 |
) |
|
|
(162 |
) |
| Loss per share attributable to the Equity holders of the Company: |
|
|
|
|
|
|
|
|
| Basic and diluted loss per ordinary share |
|
|
(0.15 |
) |
|
|
(1.05 |
) |
| (1) |
Refer to Note 2.7.24 of the Company’s consolidated financial statements in the Company’s Annual
Report on Form 20-F for the year ended December 31, 2022 for details regarding the restatement of comparative figures as a result of changes in accounting policies. |
Interim condensed consolidated statement of
financial position as at June 30, 2023 (unaudited) and December 31, 2022
|
|
|
|
|
|
|
|
|
| (in €‘000) |
|
30-Jun-23 |
|
|
31-Dec-22 |
|
| Assets |
|
|
|
|
|
|
|
|
| Non-current assets |
|
|
|
|
|
|
|
|
| Property, plant and equipment |
|
|
156,293 |
|
|
|
134,718 |
|
| Intangible assets |
|
|
22,253 |
|
|
|
24,648 |
|
| Right-of-use
assets |
|
|
54,285 |
|
|
|
47,817 |
|
| Deferred tax assets |
|
|
523 |
|
|
|
523 |
|
| Other financial assets |
|
|
56,621 |
|
|
|
62,487 |
|
| Total non-current assets |
|
|
289,975 |
|
|
|
270,193 |
|
| Current assets |
|
|
|
|
|
|
|
|
| Inventories |
|
|
31,530 |
|
|
|
26,017 |
|
| Prepayments and other assets |
|
|
12,837 |
|
|
|
9,079 |
|
| Trade and other receivables |
|
|
36,933 |
|
|
|
47,235 |
|
| Contract assets |
|
|
2,843 |
|
|
|
1,512 |
|
| Other financial assets |
|
|
6,389 |
|
|
|
601 |
|
| Cash and cash equivalents |
|
|
65,150 |
|
|
|
83,022 |
|
| Total current assets |
|
|
155,682 |
|
|
|
167,466 |
|
| Total assets |
|
|
445,657 |
|
|
|
437,659 |
|
| Equity |
|
|
|
|
|
|
|
|
| Share capital |
|
|
32,062 |
|
|
|
32,061 |
|
| Share premium |
|
|
365,900 |
|
|
|
365,900 |
|
| Reserves |
|
|
(14,515 |
) |
|
|
(6,860 |
) |
| Accumulated deficit |
|
|
(396,717 |
) |
|
|
(364,088 |
) |
| Equity attributable to equity holders of the Company |
|
|
(13,270 |
) |
|
|
27,013 |
|
| Non-controlling interests |
|
|
613 |
|
|
|
745 |
|
| Total equity |
|
|
(12,657 |
) |
|
|
27,758 |
|
| Non-current liabilities |
|
|
|
|
|
|
|
|
| Borrowings |
|
|
312,400 |
|
|
|
269,033 |
|
| Lease liabilities |
|
|
50,371 |
|
|
|
44,044 |
|
| Provisions and other liabilities |
|
|
887 |
|
|
|
520 |
|
| Contract liabilities |
|
|
1,119 |
|
|
|
2,442 |
|
| Deferred tax liabilities |
|
|
1,980 |
|
|
|
2,184 |
|
| Total non-current liabilities |
|
|
366,757 |
|
|
|
318,223 |
|
| Current liabilities |
|
|
|
|
|
|
|
|
| Trade and other payables |
|
|
40,441 |
|
|
|
56,390 |
|
| Contract liabilities |
|
|
13,667 |
|
|
|
7,917 |
|
| Current tax liabilities |
|
|
1,212 |
|
|
|
1,572 |
|
| Lease liabilities |
|
|
8,296 |
|
|
|
7,280 |
|
| Provisions and other liabilities |
|
|
24,258 |
|
|
|
17,223 |
|
| Warrant liabilities |
|
|
3,683 |
|
|
|
1,296 |
|
| Total current liabilities |
|
|
91,557 |
|
|
|
91,678 |
|
| Total liabilities |
|
|
458,314 |
|
|
|
409,901 |
|
| Total equity and liabilities |
|
|
445,657 |
|
|
|
437,659 |
|
Interim condensed consolidated statement of cash
flows for the six months ended June 30, 2023 and 2022 (unaudited)
|
|
|
|
|
|
|
|
|
| (in €‘000) |
|
2023 |
|
|
2022
(restated) (1) |
|
| Cash flows from operating activities |
|
|
|
|
|
|
|
|
| Cash generated from/(used in) operations |
|
|
(22,669 |
) |
|
|
(88,262 |
) |
| Interest paid |
|
|
(1,456 |
) |
|
|
(3,494 |
) |
| Income taxes paid |
|
|
(375 |
) |
|
|
(320 |
) |
| Other cash flows from operating activities |
|
|
177 |
|
|
|
— |
|
| Net cash flows from/(used in) operating activities |
|
|
(24,323 |
) |
|
|
(92,076 |
) |
| Cash flows from investing activities |
|
|
|
|
|
|
|
|
| Acquisition of Mega-E, net of cash acquired |
|
|
— |
|
|
|
874 |
|
| Acquisition of MOMA, net of cash acquired |
|
|
— |
|
|
|
(28,733 |
) |
| Purchase of property, plant and equipment |
|
|
(32,180 |
) |
|
|
(12,944 |
) |
| Proceeds from sale of property, plant and equipment |
|
|
— |
|
|
|
97 |
|
| Purchase of intangible assets |
|
|
— |
|
|
|
(1,355 |
) |
| Proceeds from investment grants |
|
|
25 |
|
|
|
235 |
|
| Other cash flows used in investing activities |
|
|
(113 |
) |
|
|
— |
|
| Net cash flows from/(used in) investing activities |
|
|
(32,268 |
) |
|
|
(41,826 |
) |
| Cash flows from financing activities |
|
|
|
|
|
|
|
|
| Proceeds from borrowings |
|
|
43,400 |
|
|
|
— |
|
| Payment of principal portion of lease liabilities |
|
|
(2,359 |
) |
|
|
(2,819 |
) |
| Payment of transaction costs on new equity instruments |
|
|
— |
|
|
|
(925 |
) |
| Payment of transaction costs on borrowings |
|
|
(2,331 |
) |
|
|
— |
|
| Proceeds from issuing equity instruments (Spartan shareholders) |
|
|
— |
|
|
|
10,079 |
|
| Proceeds from issuing equity instruments (PIPE financing) |
|
|
— |
|
|
|
132,690 |
|
| Net cash flows from/(used in) financing activities |
|
|
38,710 |
|
|
|
139,025 |
|
| Net increase/(decrease) in cash and cash equivalents |
|
|
(17,881 |
) |
|
|
5,123 |
|
| Cash and cash equivalents at the beginning of the half-year |
|
|
83,022 |
|
|
|
24,652 |
|
| Effect of exchange rate changes on cash and cash equivalents |
|
|
9 |
|
|
|
— |
|
| Cash and cash equivalents at the end of the half-year |
|
|
65,150 |
|
|
|
29,775 |
|
| (1) |
Refer to Note 2.7.24 of the Company’s consolidated financial statements in the Company’s Annual
Report on Form 20-F for the year ended December 31, 2022 for details regarding the restatement of comparative figures as a result of changes in accounting policies. |
Reconciliation of Loss for EBITDA and Operational
EBITDA for the six months ended June 30, 2023 and 2022 (unaudited)
|
|
|
|
|
|
|
|
|
| |
|
Six months ended June 30, |
|
| (in € millions) |
|
2023 |
|
|
2022 |
|
| Loss for the period |
|
|
(38.9 |
) |
|
|
(246.6 |
) |
| Income tax |
|
|
0.5 |
|
|
|
0.2 |
|
| Finance costs |
|
|
12.4 |
|
|
|
(15.1 |
) |
| Amortization and impairments of intangible assets |
|
|
2.4 |
|
|
|
1.7 |
|
| Depreciation and impairments of
right-of-use assets |
|
|
3.8 |
|
|
|
2.9 |
|
| Depreciation, impairments and reversal of impairments of property, plant and equipment |
|
|
10.5 |
|
|
|
5.9 |
|
| EBITDA |
|
|
(9.3 |
) |
|
|
(251.0 |
) |
| Fair value gains / (losses) on derivatives (purchase options) |
|
|
2.4 |
|
|
|
(3.8 |
) |
| Share-based payment expenses |
|
|
11.5 |
|
|
|
241.3 |
|
| Transaction costs |
|
|
— |
|
|
|
9.1 |
|
| Business optimization costs |
|
|
7.1 |
|
|
|
2.9 |
|
| Operational EBITDA |
|
|
11.7 |
|
|
|
(1.5 |
) |
FINANCIAL INFORMATION; NON-IFRS FINANCIAL MEASURES
Some of the financial information and data contained in this press release, such as EBITDA and Operational EBITDA, have not been prepared in accordance with
Dutch generally accepted accounting principles, United States generally accepted accounting principles or the International Financial Reporting Standards (“IFRS”). We define (i) EBITDA as earnings before interest expense, taxes,
depreciation and amortization and (ii) Operational EBITDA as EBITDA further adjusted for reorganization costs, certain business optimization costs, lease buyouts, and transaction costs. Allego believes that the use of these non-IFRS measures of financial results provide useful information to management and investors regarding certain financial and business trends relating to Allego’s financial condition and results of operations.
Allego’s management uses these non-IFRS measures for trend analyses, for purposes of determining management incentive compensation and for budgeting and planning purposes. Allego believes that the use of
these non-IFRS financial measures provides an additional tool for investors to use in evaluating projected operating results and trends and in comparing Allego’s financial measures with other similar
companies, many of which present similar non-IFRS financial measures to investors. Management does not consider these non-IFRS measures in isolation or as an alternative
to financial measures determined in accordance with IFRS. The principal limitation of these non-IFRS financial measures is that they exclude significant expenses and income that are required by IFRS to be
recorded in Allego’s financial statements. In addition, they are subject to inherent limitations
as they reflect the exercise of judgments by
management about which expense and income are excluded or included in determining these non-IFRS financial measures. In order to compensate for these limitations, management presents non-IFRS financial measures in connection with IFRS results, and reconciliations to the most directly comparable IFRS measure are provided in this press release.
Contact:
Investors
investors@allego.eu
Media
allegoPR@icrinc.com
Exhibit 99.2 Allego, a leading European public EV fast‐charging
network Advancing green electrification First Half 2023 Earnings Presentation August 15, 2023
Disclaimer Forward Looking Statements All statements other than
statements of historical facts contained in this presentation are forward‐looking statements. Allego N.V. (“Allego”) intends such forward‐looking statements to be covered by the safe harbor provisions for
forward‐looking statements contained in Section 21E of the Securities Exchange Act of 1934 and the Private Securities Litigation Reform Act of 1995. Forward‐looking statements may generally be identified by the use of words such as
“believe,” “may,” “will,” “estimate,” “continue,” “anticipate,” “intend,” “expect,” “should,” “would,” “plan,”,
“project,” “forecast,” “predict,” “potential,” “seem,” “seek,” “future,” “outlook,” “target” or other similar expressions (or the negative
versions of such words or expressions) that predict or indicate future events or trends or that are not statements of historical matters. These forward‐looking statements include, without limitation, Allego’s expectations with respect to
future performance. These forward‐looking statements involve significant risks and uncertainties that could cause the actual results to differ materially, and potentially adversely, from those expressed or implied in the forward‐ looking
statements. Most of these factors are outside Allego’s control and are difficult to predict. Factors that may cause such differences include, but are not limited to: (i) changes adversely affecting Allego’s business, (ii) the price and
availability of electricity and other energy sources, (iii) the risks associated with vulnerability to industry downturns and regional or national downturns, (iv) fluctuations in Allego’s revenue and operating results, (v) unfavorable
conditions or further disruptions in the capital and credit markets, (vi) Allego’s ability to generate cash, service indebtedness and incur additional indebtedness, (vii) competition from existing and new competitors, (viii) the growth of the
electric vehicle market, (ix) Allego’s ability to integrate any businesses it may acquire, (x) Allego’s ability to recruit and retain experienced personnel, (xi) risks related to legal proceedings or claims, including liability claims,
(xii) Allego’s dependence on third‐party contractors to provide various services, (xiii) data security breaches or other network outage; (xiv) Allego’s ability to obtain additional capital on commercially reasonable terms, (xv)
Allego’s ability to remediate its material weaknesses in internal control over financial reporting, (xvi) the impact of COVID‐19, including COVID‐19 related supply chain disruptions and expense increases, (xvii) general economic or
political conditions, including the Russia/Ukraine conflict or increased trade restrictions between the United States, Russia, China and other countries; and (xviii) other factors detailed under the section entitled “Risk Factors” in
Allego’s filings with the Securities and Exchange Commission. The foregoing list of factors is not exclusive. If any of these risks materialize or Allego’s assumptions prove incorrect, actual results could differ materially from the
results implied by these forward‐looking statements. There may be additional risks that Allego presently does not know or that Allego currently believes are immaterial that could also cause actual results to differ from those contained in the
forward‐ looking statements. In addition, forward‐looking statements reflect Allego’s expectations, plans or forecasts of future events and views as of the date of this presentation. Allego anticipates that subsequent events and
developments will cause Allego’s assessments to change. However, while Allego may elect to update these forward‐looking statements at some point in the future, Allego specifically disclaims any obligation to do so, unless required by
applicable law. These forward‐looking statements should not be relied upon as representing Allego’s assessments as of any date subsequent to the date of this presentation. Accordingly, undue reliance should not be placed upon the
forward‐looking statements. INDUSTRY AND MARKET DATA Although all information and opinions expressed in this presentation, including market data and other statistical information, were obtained from sources believed to be reliable and are
included in good faith, Allego has not independently verified the information and makes no representation or warranty, express or implied, as to its accuracy or completeness. Some data is also based on the good faith estimates of Allego, which is
derived from its review of internal sources as well as the independent sources described above. This presentation contains preliminary information only, is subject to change at any time and, is not, and should not be assumed to be, complete or to
constitute all the information necessary to adequately make an informed decision regarding your investment with Allego. FINANCIAL INFORMATION; NON‐IFRS FINANCIAL MEASURES Some of the financial information and data contained in this
presentation, such as EBITDA, Operational EBITDA and free cash flow, have not been prepared in accordance with Dutch generally accepted accounting principles, United States generally accepted accounting principles or the International Financial
Reporting Standards (“IFRS”). We define (i) EBITDA as earnings before interest expense, taxes, depreciation and amortization, (ii) Operational EBITDA as EBITDA further adjusted for reorganization costs, certain business optimization
costs, lease buyouts and transaction costs and (iii) free cash flow as net cash flow from operating activities less capital expenditures. Allego believes that the use of these non‐IFRS measures of financial results provide useful information
to management and investors regarding certain financial and business trends relating to Allego’s financial condition and results of operations. Allego’s management uses these non‐IFRS measures for trend analyses, for purposes of
determining management incentive compensation and for budgeting and planning purposes. Allego believes that the use of these non‐IFRS financial measures provides an additional tool for investors to use in evaluating projected operating results
and trends and in comparing Allego’s financial measures with other similar companies, many of which present similar non‐IFRS financial measures to investors. Management does not consider these non‐IFRS measures in isolation or as
an alternative to financial measures determined in accordance with IFRS. The principal limitation of these non‐IFRS financial measures is that they exclude significant expenses and income that are required by IFRS to be recorded in
Allego’s financial statements. In addition, they are subject to inherent limitations as they reflect the exercise of judgments by management about which expense and income are excluded or included in determining these non‐IFRS financial
measures. In order to compensate for these limitations, management presents non‐IFRS financial measures in connection with IFRS results and reconciliations to the most directly comparable IFRS measure are provided in the Appendix to this
presentation. TRADEMARKS AND TRADE NAMES Allego owns or has rights to various trademarks, service marks and trade names that it uses in connection with the operation of its businesses. This presentation also contains trademarks, service marks and
trade names of third parties, which are the property of their respective owners. The use or display of third parties’ trademarks, service marks, trade names or products in this presentation is not intended to, and does not imply, a
relationship with Allego or an endorsement or sponsorship by or of Allego. Solely for convenience, the trademarks, service marks and trade names referred to in this presentation may appear with the ®, TM or SM symbols, but such references are
not intended to indicate, in any way, that Allego will not assert, to the fullest extent under applicable law, its rights or the right of the applicable licensor to these trademarks, service marks and trade names. 2
Overview & Key Highlights Mathieu Bonnet, CEO
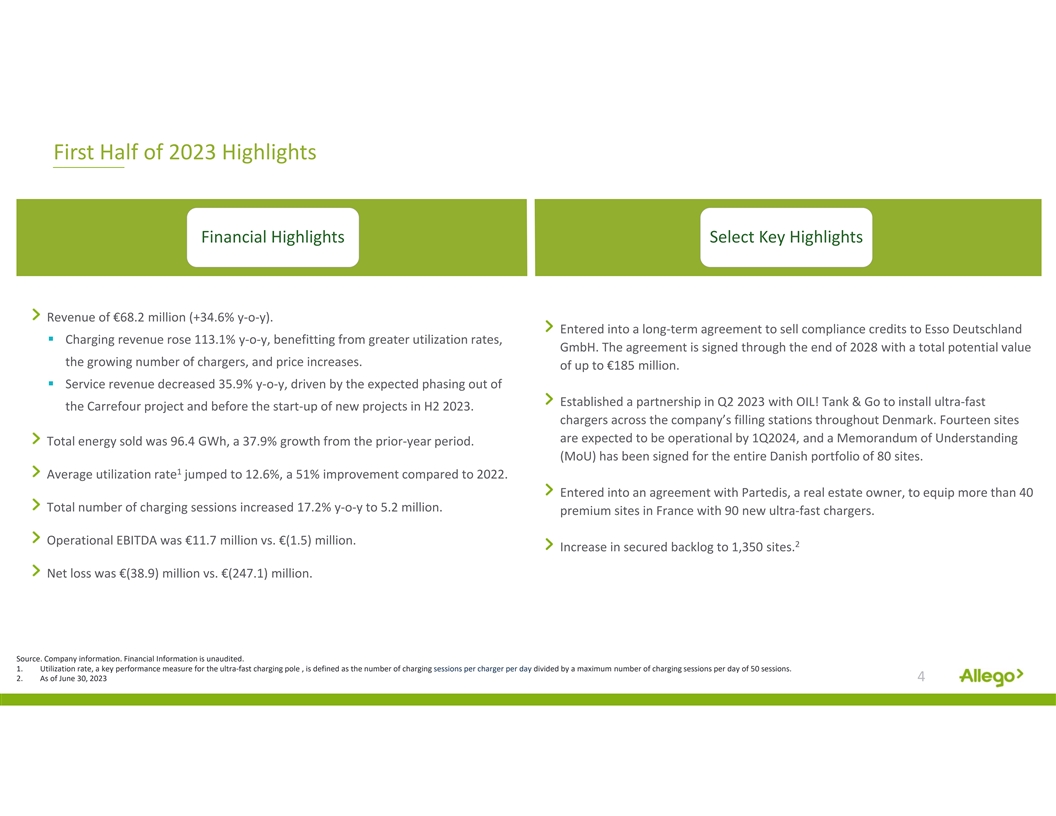
First Half of 2023 Highlights Financial Highlights Select Key Highlights
Revenue of €68.2 million (+34.6% y‐o‐y). Entered into a long‐term agreement to sell compliance credits to Esso Deutschland § Charging revenue rose 113.1% y‐o‐y, benefitting from greater utilization rates,
GmbH. The agreement is signed through the end of 2028 with a total potential value the growing number of chargers, and price increases. of up to €185 million. § Service revenue decreased 35.9% y‐o‐y, driven by the expected
phasing out of Established a partnership in Q2 2023 with OIL! Tank & Go to install ultra‐fast the Carrefour project and before the start‐up of new projects in H2 2023. chargers across the company’s filling stations throughout
Denmark. Fourteen sites are expected to be operational by 1Q2024, and a Memorandum of Understanding Total energy sold was 96.4 GWh, a 37.9% growth from the prior‐year period. (MoU) has been signed for the entire Danish portfolio of 80 sites. 1
Average utilization rate jumped to 12.6%, a 51% improvement compared to 2022. Entered into an agreement with Partedis, a real estate owner, to equip more than 40 Total number of charging sessions increased 17.2% y‐o‐y to 5.2 million.
premium sites in France with 90 new ultra‐fast chargers. Operational EBITDA was €11.7 million vs. €(1.5) million. 2 Increase in secured backlog to 1,350 sites. Net loss was €(38.9) million vs. €(247.1) million. Source.
Company information. Financial Information is unaudited. 1. Utilization rate, a key performance measure for the ultra‐fast charging pole , is defined as the number of charging sessions per charger per day divided by a maximum number of
charging sessions per day of 50 sessions. 2. As of June 30, 2023 4

Business Model Overview Sales & Services Own & Operate
Proprietary Software Build, own, and operate fast and Attractive, high‐margin ultra‐fast charging sites third‐party service contracts One of the largest European public Includes site design and technical EV charging networks
layout, authorization and billing, and Allego’s software suite allows compatibility and an optimized operations and maintenance user experience for all EV drivers 1,2 1 Owned Public Charging Ports Breakdown Third‐Party Public Charging
Ports Breakdown Allamo™ identifies premium charging sites and forecasts AC Fast Ultra‐Fast demand using external traffic statistics AC Fast Ultra‐Fast EV Cloud™ provides software solutions for EV charger 23,273 595 1,066
3,372 360 688 owners, including payments, and achieves high uptime Allego’s energy platform sources green energy • Flexibility in choosing sourcing for charging stations• Long‐term sustainable charging price from multiple
suppliers and directly from • Ability to secure long‐term PPAs• Reduced impact from market volatility renewable assets, enabling: Source. Company information as of June 30, 2023 1. Charging ports are defined as the number of
sockets on a charger that is simultaneously accessible for charging 2. Only includes public chargers 5
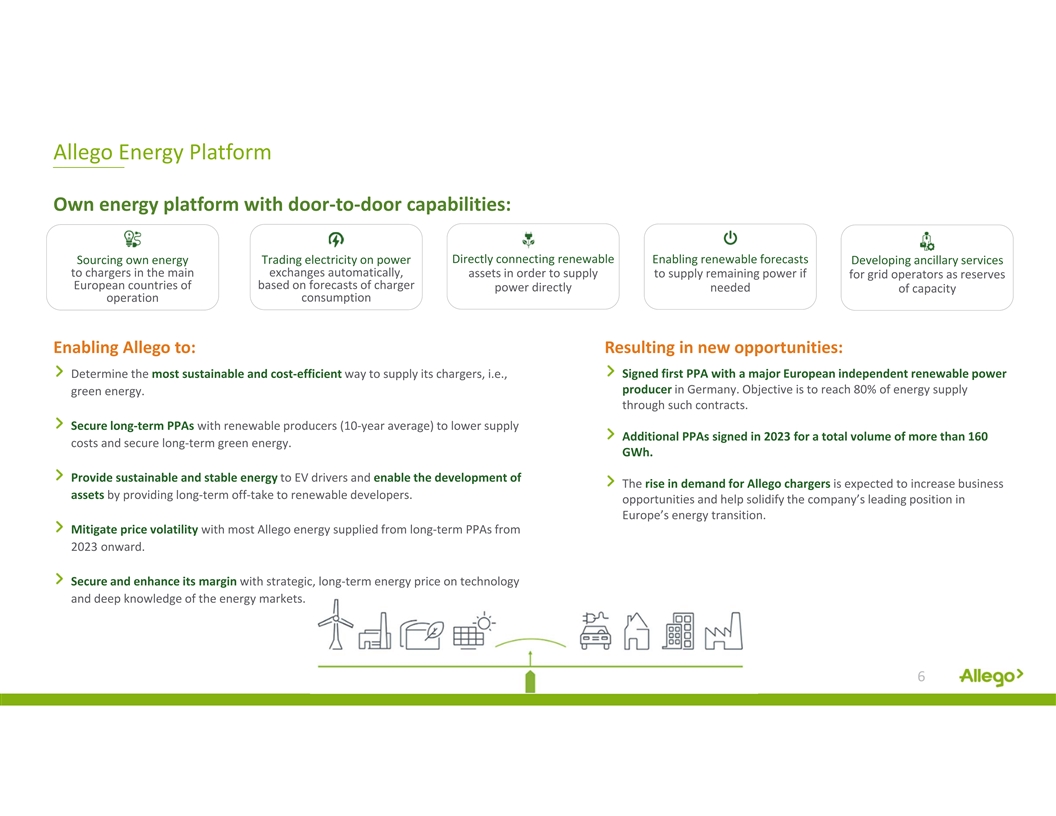
Allego Energy Platform Own energy platform with door‐to‐door
capabilities: Directly connecting renewable Sourcing own energy Trading electricity on power Enabling renewable forecasts Developing ancillary services to chargers in the main exchanges automatically, assets in order to supply to supply remaining
power if for grid operators as reserves European countries of based on forecasts of charger power directly needed of capacity consumption operation Enabling Allego to: Resulting in new opportunities: Signed first PPA with a major European
independent renewable power Determine the most sustainable and cost‐efficient way to supply its chargers, i.e., producer in Germany. Objective is to reach 80% of energy supply green energy. through such contracts. Secure long‐term PPAs
with renewable producers (10‐year average) to lower supply Additional PPAs signed in 2023 for a total volume of more than 160 costs and secure long‐term green energy. GWh. Provide sustainable and stable energy to EV drivers and enable
the development of The rise in demand for Allego chargers is expected to increase business assets by providing long‐term off‐take to renewable developers. opportunities and help solidify the company’s leading position in
Europe’s energy transition. Mitigate price volatility with most Allego energy supplied from long‐term PPAs from 2023 onward. Secure and enhance its margin with strategic, long‐term energy price on technology and deep knowledge of
the energy markets. 6
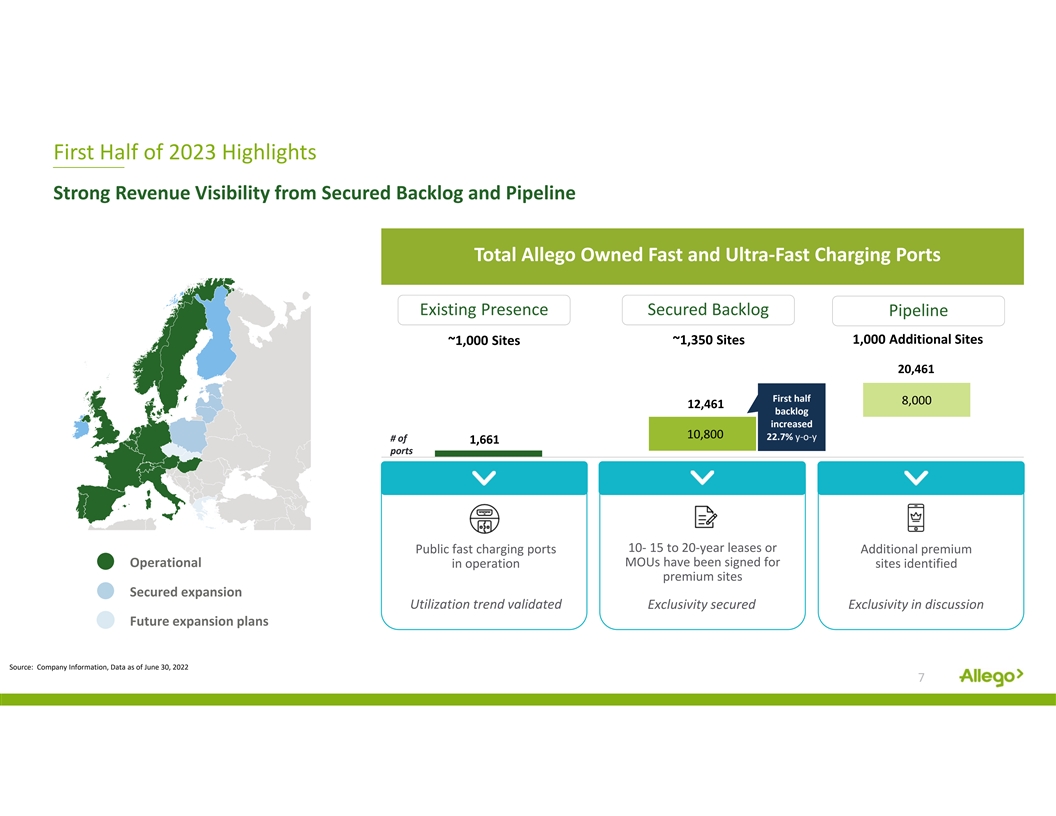
First Half of 2023 Highlights Strong Revenue Visibility from Secured
Backlog and Pipeline Total Allego Owned Fast and Ultra‐Fast Charging Ports Existing Presence Secured Backlog Pipeline 1,000 Additional Sites ~1,000 Sites ~1,350 Sites 20,461 First half First half 8,000 12,461 backlog backlog increased
increased 10,800 22.7% 22.7% y‐o‐y y‐o‐y # of 1,661 ports 10‐ 15 to 20‐year leases or Public fast charging ports Additional premium Operational MOUs have been signed for in operation sites identified premium sites
Secured expansion Utilization trend validated Exclusivity secured Exclusivity in discussion Future expansion plans Source: Company Information, Data as of June 30, 2022 7
Financials Ton Louwers, CFO 8
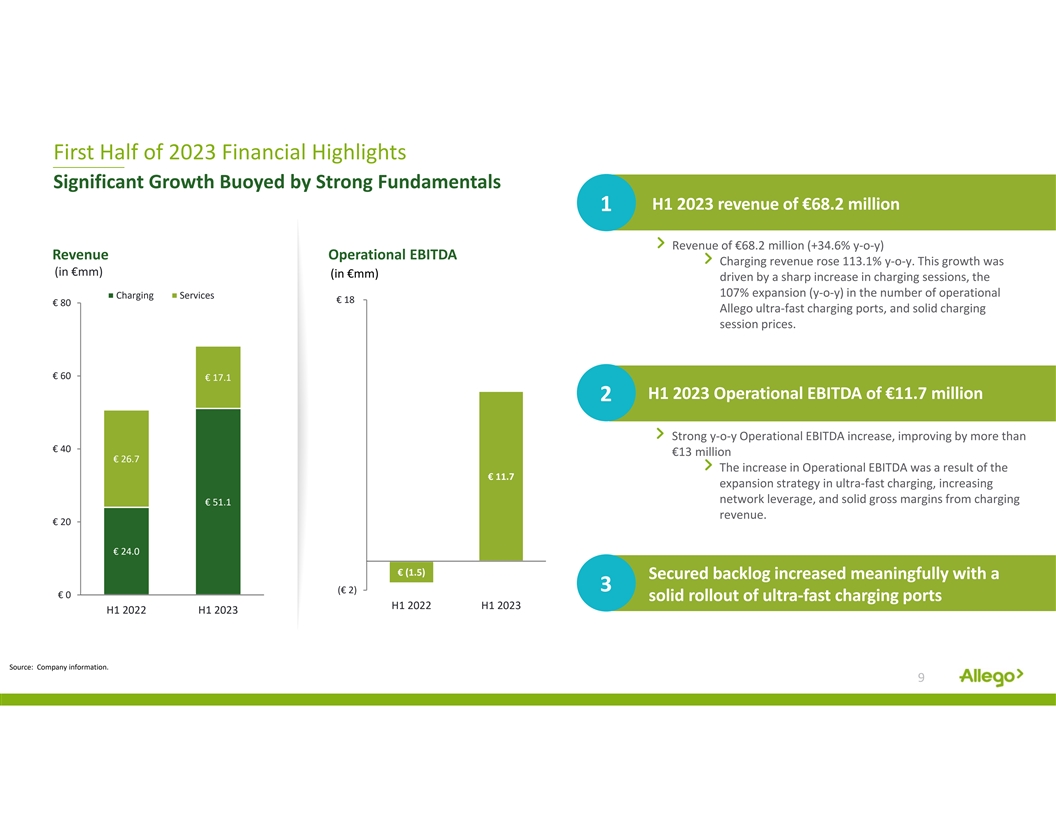
First Half of 2023 Financial Highlights Significant Growth Buoyed by
Strong Fundamentals H1 2023 revenue of €68.2 million 1 Revenue of €68.2 million (+34.6% y‐o‐y) Revenue Operational EBITDA Charging revenue rose 113.1% y‐o‐y. This growth was (in €mm) (in €mm) driven by
a sharp increase in charging sessions, the 107% expansion (y‐o‐y) in the number of operational Charging Services € 18 € 80 Allego ultra‐fast charging ports, and solid charging session prices. € 60 € 17.1 H1
2023 Operational EBITDA of €11.7 million 2 Strong y‐o‐y Operational EBITDA increase, improving by more than € 40 €13 million € 26.7 The increase in Operational EBITDA was a result of the € 11.7 expansion
strategy in ultra‐fast charging, increasing network leverage, and solid gross margins from charging € 51.1 revenue. € 20 € 24.0 € (1.5) Secured backlog increased meaningfully with a 3 (€ 2) € 0 solid rollout
of ultra‐fast charging ports H1 2022 H1 2023 H1 2022 H1 2023 Source: Company information. 9
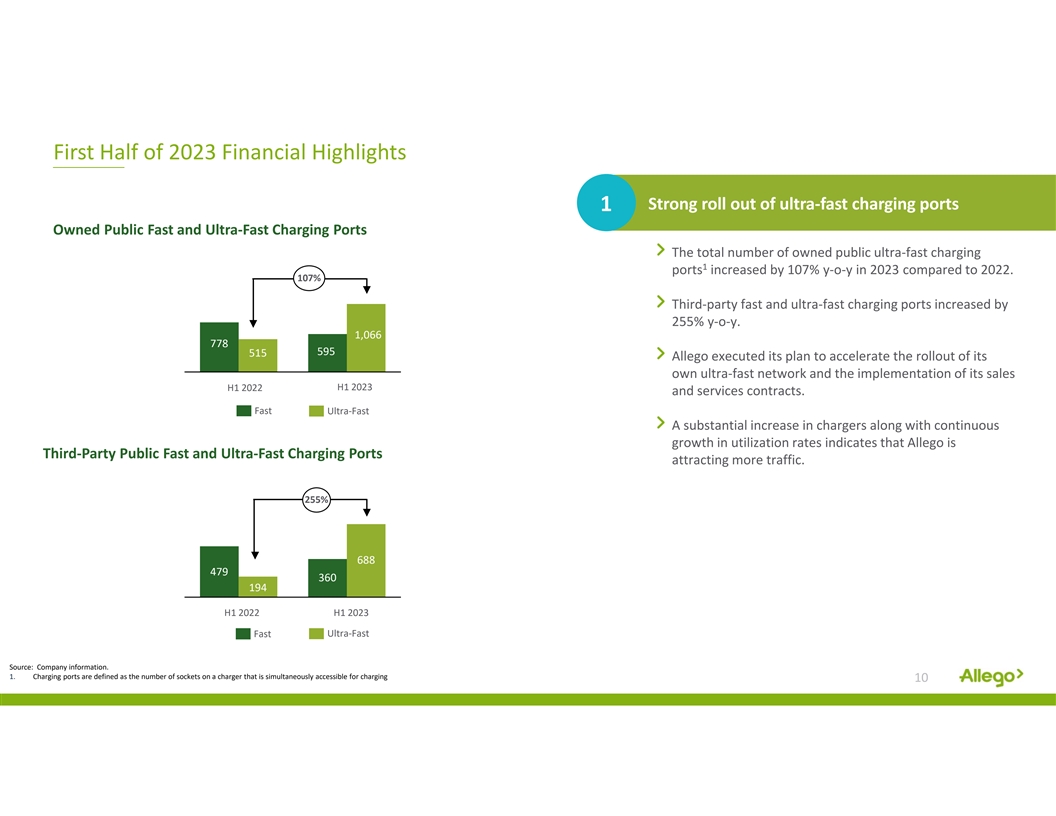
First Half of 2023 Financial Highlights Strong roll out of
ultra‐fast charging ports 1 Owned Public Fast and Ultra‐Fast Charging Ports The total number of owned public ultra‐fast charging 1 ports increased by 107% y‐o‐y in 2023 compared to 2022. 107% Third‐party fast and
ultra‐fast charging ports increased by 255% y‐o‐y. 1,066 778 595 515 Allego executed its plan to accelerate the rollout of its own ultra‐fast network and the implementation of its sales H1 2023 H1 2022 and services contracts.
Fast Ultra‐Fast A substantial increase in chargers along with continuous growth in utilization rates indicates that Allego is Third‐Party Public Fast and Ultra‐Fast Charging Ports attracting more traffic. 255% 688 479 360 194 H1
2022 H1 2023 Fast Ultra‐Fast Source: Company information. 1. Charging ports are defined as the number of sockets on a charger that is simultaneously accessible for charging 10
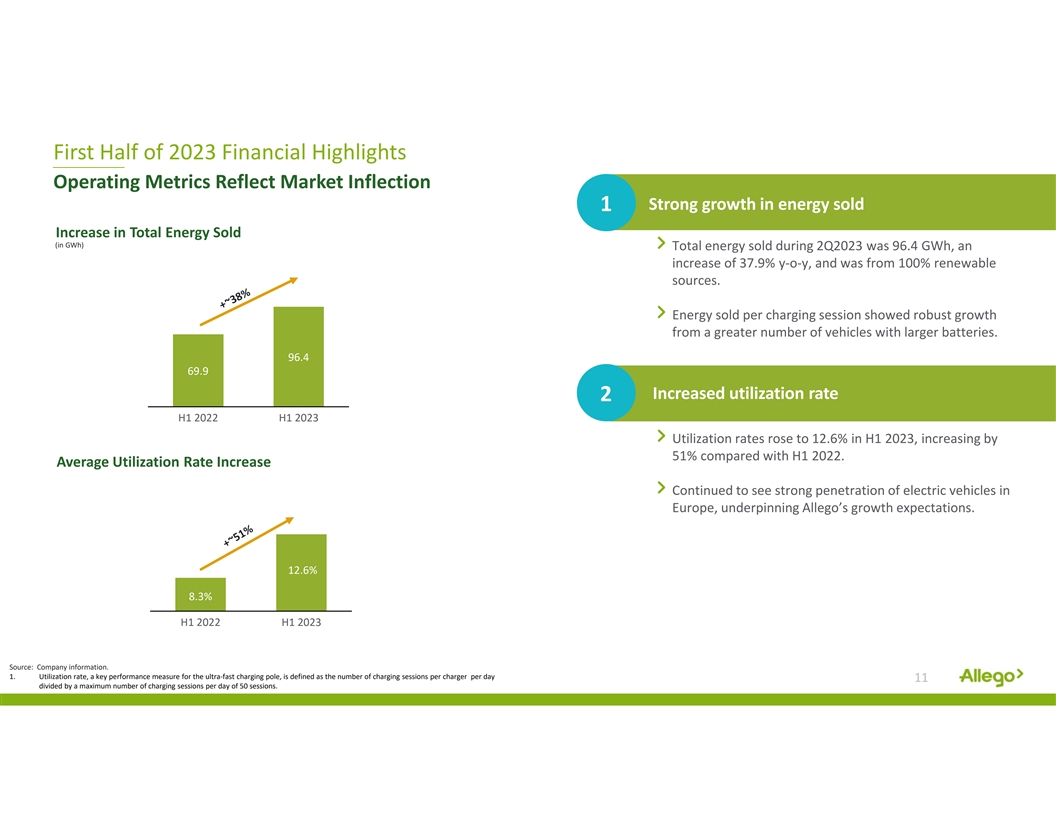
First Half of 2023 Financial Highlights Operating Metrics Reflect
Market Inflection Strong growth in energy sold 1 Increase in Total Energy Sold (in GWh) Total energy sold during 2Q2023 was 96.4 GWh, an increase of 37.9% y‐o‐y, and was from 100% renewable sources. Energy sold per charging session
showed robust growth from a greater number of vehicles with larger batteries. 96.4 69.9 Increased utilization rate 2 H1 2022 H1 2023 Utilization rates rose to 12.6% in H1 2023, increasing by 51% compared with H1 2022. Average Utilization Rate
Increase Continued to see strong penetration of electric vehicles in Europe, underpinning Allego’s growth expectations. 12.6% 8.3% H1 2022 H1 2023 Source: Company information. 1. Utilization rate, a key performance measure for the
ultra‐fast charging pole, is defined as the number of charging sessions per charger per day 11 divided by a maximum number of charging sessions per day of 50 sessions.
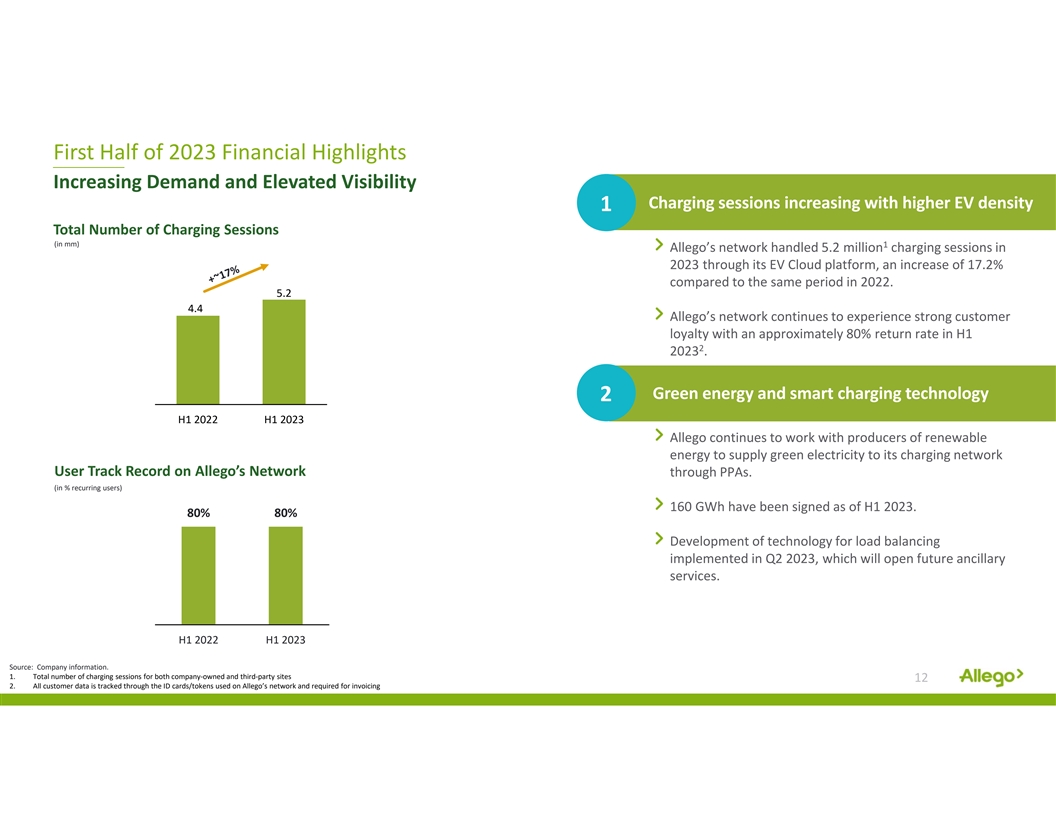
First Half of 2023 Financial Highlights Increasing Demand and Elevated
Visibility Charging sessions increasing with higher EV density 1 Total Number of Charging Sessions (in mm) 1 Allego’s network handled 5.2 million charging sessions in 2023 through its EV Cloud platform, an increase of 17.2% compared to the
same period in 2022. 5.2 4.4 Allego’s network continues to experience strong customer loyalty with an approximately 80% return rate in H1 2 2023 . Green energy and smart charging technology 2 H1 2022 H1 2023 Allego continues to work with
producers of renewable energy to supply green electricity to its charging network User Track Record on Allego’s Network through PPAs. (in % recurring users) 160 GWh have been signed as of H1 2023. 80% 80% Development of technology for load
balancing implemented in Q2 2023, which will open future ancillary services. H1 2022 H1 2023 Source: Company information. 1. Total number of charging sessions for both company‐owned and third‐party sites 12 2. All customer data is
tracked through the ID cards/tokens used on Allego’s network and required for invoicing

1 Full Year Guidance Total energy sold: 215 GWh – 225 GWh
Revenue: €180 m – €200 m Operational EBITDA: €30 m – €40 m 1. Guidance as of August 15, 2023 13

Appendix Financial Statements Reconciliation
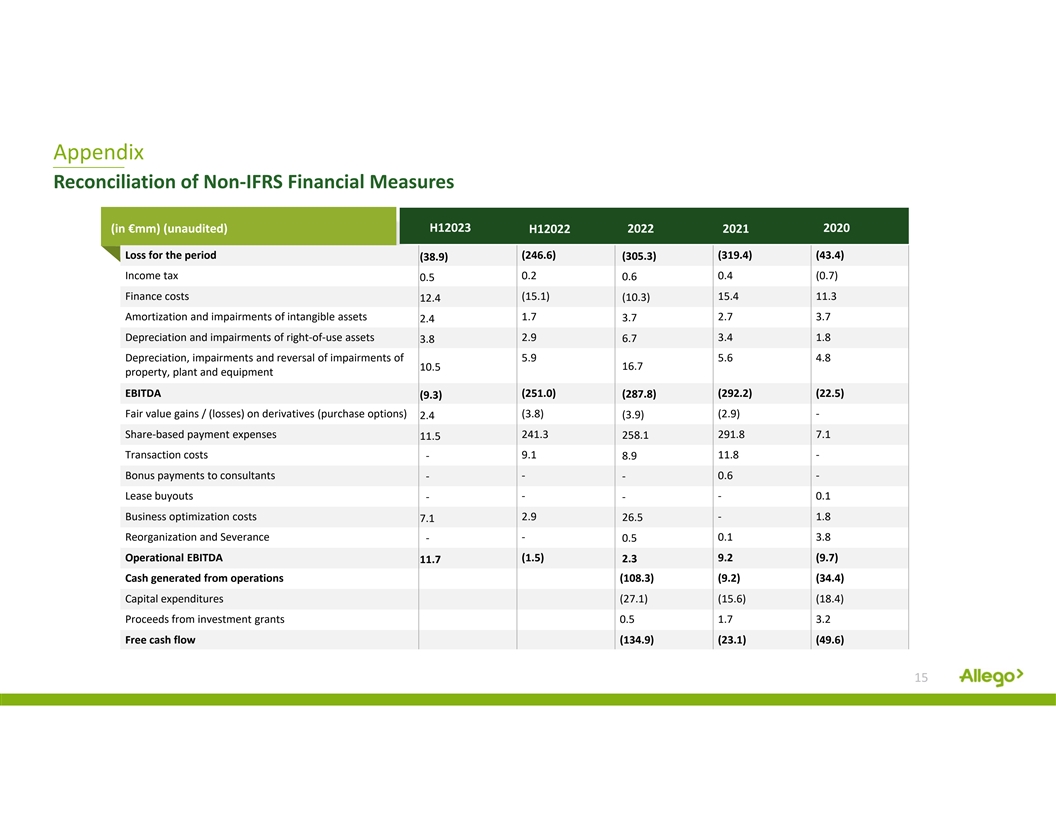
Appendix Reconciliation of Non‐IFRS Financial Measures H12023
2020 (in €mm) (unaudited) H12022 2022 2021 Loss for the period (246.6) (319.4) (43.4) (305.3) (38.9) Income tax 0.2 0.6 0.4 (0.7) 0.5 Finance costs (15.1) 15.4 11.3 12.4 (10.3) Amortization and impairments of intangible assets 1.7 3.7 2.7 3.7
2.4 Depreciation and impairments of right‐of‐use assets 2.9 3.4 1.8 3.8 6.7 Depreciation, impairments and reversal of impairments of 5.9 5.6 4.8 10.5 16.7 property, plant and equipment EBITDA (251.0) (292.2) (22.5) (9.3) (287.8) Fair
value gains / (losses) on derivatives (purchase options) (3.8) (2.9) ‐ (3.9) 2.4 Share‐based payment expenses 241.3 258.1 291.8 7.1 11.5 Transaction costs 9.1 11.8 ‐ ‐ 8.9 Bonus payments to consultants ‐ 0.6 ‐
‐ ‐ Lease buyouts ‐ ‐ 0.1 ‐ ‐ Business optimization costs 2.9 ‐ 1.8 26.5 7.1 Reorganization and Severance ‐ ‐ 0.5 0.1 3.8 Operational EBITDA (1.5) 9.2 (9.7) 2.3 11.7 Cash generated from
operations (108.3) (9.2) (34.4) Capital expenditures (27.1) (15.6) (18.4) Proceeds from investment grants 0.5 1.7 3.2 Free cash flow (134.9) (23.1) (49.6) 15

Allego NV (NYSE:ALLG)
Historical Stock Chart
Von Apr 2024 bis Mai 2024

Allego NV (NYSE:ALLG)
Historical Stock Chart
Von Mai 2023 bis Mai 2024
