Vopak reports on Q3 2023 results
25 Oktober 2023 - 7:00AM

Vopak reports on Q3 2023 results
Rotterdam, the Netherlands, 25 October 2023
Vopak reports strong third quarter 2023 results
and increases its EBITDA outlook for FY
2023
Key highlights Q3 2023
Improve:
- EBITDA in Q3 2023 of EUR 241 million. FY 2023 EBITDA outlook
increased to around EUR 970 million.
- Reached an agreement on the sale of chemical terminals in
Rotterdam, the Netherlands.
Grow:
- Gate terminal
starts the construction of the 4th LNG tank at the port of
Rotterdam, the Netherlands.
- Solidifying our leading industrial terminal position in
Singapore with additional pipeline connections.
Accelerate:
- Collaborating for the development of a large-scale, low-carbon
ammonia production and export project on the Houston Ship
Channel.
- Commissioned repurposed infrastructure in the port of Los
Angeles, United States to store low-carbon fuels.
|
Q3 2023 |
Q2 2023 |
Q3 2022 |
|
in EUR millions |
YTD Q3 2023 |
YTD Q3 2022 |
|
352.0 |
359.0 |
349.6 |
|
Revenues |
1,072.8 |
1,011.7 |
|
|
|
|
|
|
|
|
|
|
|
|
|
Results -excluding exceptional items- |
|
|
|
240.5 |
245.2 |
226.9 |
|
Group operating profit / (loss) before depreciation and
amortization (EBITDA) |
734.7 |
659.4 |
|
158.2 |
163.5 |
140.3 |
|
Group operating profit / (loss) (EBIT) |
490.3 |
397.0 |
|
97.3 |
103.5 |
77.7 |
|
Net profit / (loss) attributable to holders of ordinary shares |
303.9 |
205.9 |
|
0.77 |
0.83 |
0.62 |
|
Earnings per ordinary share (in EUR) |
2.42 |
1.64 |
|
|
|
|
|
|
|
|
|
|
|
|
|
Results -including exceptional items- |
|
|
|
286.5 |
291.4 |
229.7 |
|
Group operating profit / (loss) before depreciation and
amortization (EBITDA) |
826.9 |
197.8 |
|
204.2 |
209.7 |
143.1 |
|
Group operating profit / (loss) (EBIT) |
582.5 |
- 64.6 |
|
144.2 |
121.0 |
80.5 |
|
Net profit / (loss) attributable to holders of ordinary shares |
368.3 |
- 255.3 |
|
1.15 |
0.97 |
0.64 |
|
Earnings per ordinary share (in EUR) |
2.94 |
-2.04 |
|
|
|
|
|
|
|
|
|
240.2 |
220.2 |
197.9 |
|
Cash flows from operating activities (gross excluding
derivatives) |
680.1 |
581.0 |
|
245.6 |
250.8 |
191.3 |
|
Cash flows from operating activities (gross) |
723.4 |
530.9 |
|
-111.8 |
77.1 |
-117.9 |
|
Cash flows from investing activities (including derivatives) |
- 137.8 |
- 388.7 |
|
|
|
|
|
|
|
|
|
|
|
|
|
Additional performance measures |
|
|
|
285.4 |
292.2 |
277.4 |
|
Proportional EBITDA -excluding exceptional items- |
871.7 |
798.2 |
|
22.0 |
22.0 |
22.2 |
|
Proportional capacity end of period (in million cbm) |
22.0 |
22.2 |
|
92% |
91% |
89% |
|
Proportional occupancy rate |
91% |
87% |
|
36.4 |
36.4 |
36.6 |
|
Storage capacity end of period (in million cbm) |
36.4 |
36.6 |
|
91% |
91% |
88% |
|
Subsidiary occupancy rate |
91% |
86% |
|
|
|
|
|
|
|
|
|
14.1% |
13.7% |
11.2% |
|
Proportional operating cash return |
14.4% |
11.3% |
|
12.2% |
12.6% |
10.4% |
|
Return on capital employed (ROCE) |
12.5% |
9.6% |
|
5,068.5 |
5,095.9 |
5,344.3 |
|
Average capital employed |
5,128.9 |
5,443.4 |
|
2,698.8 |
2,852.8 |
3,278.7 |
|
Net interest-bearing debt |
2,698.8 |
3,278.7 |
|
2.09 |
2.27 |
2.82 |
|
Senior net debt : EBITDA |
2.09 |
2.82 |
|
2.27 |
2.46 |
3.02 |
|
Total net debt : EBITDA |
2.27 |
3.02 |
Royal Vopak Chief Executive Officer Dick Richelle,
said:
“The demand for our services remained strong, reflected by an
improved proportional occupancy of 92%. EBITDA increased by 12%
compared with last year, mainly driven by organic growth across
most of the business units. We continued to make good progress on
our strategy to improve our financial and
sustainability performance, to grow our base in
industrial and gas terminals, and to accelerate
towards new energies and sustainable feedstocks. Our well
diversified portfolio combined with our new streamlined
organizational structure, positions us well to continue executing
this strategy. We are pleased to increase the FY 2023 outlook, as
we remain focused on the long-term value creation through
disciplined and balanced capital allocation.”
Financial Highlights for YTD Q3 2023 -
excluding exceptional items -
- Revenue increased to EUR 1,073 million (YTD Q3
2022: EUR 1,012 million) despite a divestment impact of EUR 34
million and unfavorable currency translation effects of EUR 17
million. Compared to Q3 2023 (EUR 352 million) revenue was slightly
lower than Q2 2023 (EUR 359 million) mainly due to divestment
impact and unfavorable currency translation impact in a broadly
stable quarter on quarter business environment. In addition growth
projects contribution further supported revenue.
- Proportional revenue increased to EUR 1,448
million (YTD Q3 2022: EUR 1,366 million).
- During the first nine months of 2023 the oil markets were
dominated by volatility, rebalancing of trade flows and supply
security concerns which supported overall storage demand in the
main hub locations. Chemicals markets are characterized by
oversupply, suppressed China consumption as well as declining
margins and operating rates. The products from feedstock and energy
favored regions are being pushed into the global markets, as a
result the demand for storage is supported and remains stable.
Throughput levels in our global industrial terminals remain firm.
Gas markets (LNG) normalized in 2023 after the disruption caused by
the Russia - Ukraine war.
- Subsidiary occupancy rate at Q3 2023 was 91%
(Q2 2023: 91%).
- Proportional occupancy rate at Q3 2023
increased to 92% (Q2 2023: 91%) mainly due to improved occupancy in
Asia & Middle East and the Netherlands business units.
- Costs increased by EUR 7 million to EUR 529
million (YTD Q3 2022: EUR 522 million) mainly due to
increased personnel expenses and higher operating expenses,
including the cost of growth projects. The increase was partially
offset by a positive divestment impact, cost control measures and
favorable currency translation impact.
- Proportional costs increased by EUR 11 million
to EUR 669 million (YTD Q3 2022: EUR 658 million)
- EBITDA increased by EUR 76 million (12%
year-on-year) to EUR 735 million (YTD Q3 2022: EUR 659 million)
driven by organic growth partially offset by higher costs,
divestment impact (EUR 11 million) and negative currency
translation effects (EUR 15 million). Compared to Q2 2023 (EUR 245
million) EBITDA (Q3 2023: EUR 241 million) decreased due to
additional project development costs (EUR 4 million) and divestment
impact of Savannah terminal of EUR 3 million, offset by
positive business developments.
- Proportional EBITDA increased to EUR 872
million (YTD Q3 2022: EUR 798 million).
- Proportional EBITDA margin in YTD Q3 2023 was
at 57% (YTD Q3 2022: 55%) an improvement reflecting good business
conditions and our commercial ability to pass on inflationary
and exceptional energy costs during the year.
- EBIT of EUR 490 million (YTD Q3 2022:
EUR 397 million), increased by EUR 93 million mainly due to
EBITDA performance and lower depreciation compared to YTD Q3 2022
mainly as a result of impairment charges accounted for in HY1
2022.
- Growth investments in YTD Q3 2023 were EUR 188
million excluding any net cash received (YTD Q3 2022: EUR 270
million). Growth investments in 2022 included Vopak investment in
Aegis-Vopak partnership in India. Proportional growth investments
in YTD Q3 2023 were EUR 245 million (YTD Q3 2022: EUR 299
million).
- Operating capex, which includes sustaining and
IT capex, YTD Q3 2023 was EUR 186 million (YTD Q3 2022: EUR 196
million) in line with Vopak’s projections to have a spend of
maximum EUR 280 million in FY 2023. Proportional operating capex
was EUR 210 million (YTD Q3 2022: EUR 211 million)
- Cash flow from operating activities increased
by EUR 192 million to EUR 723 million compared to YTD Q3 2022 EUR
531 million (36% year-on-year). The increase was related
mainly to positive business performance (EUR 60 million), working
capital movements (EUR 62 million) and settlement of derivatives
(EUR 93 million). This was partially offset by lower dividend
receipts from joint ventures and associates (EUR 23 million).
- Proportional operating cash flow in YTD Q3
2023 increased by EUR 101 million (20% year-on-year) to EUR 615
million (YTD Q3 2022 EUR 514 million) driven mainly by improved
proportional EBITDA performance and partly offset by a negative
currency translation impact of EUR 11 million. Proportional
operating cash return in YTD Q3 2023 was 14.4% compared to 11.3% in
YTD Q3 2022. The increase was due to lessor accounting (0.7%),
higher EBITDA contribution and lower average capital employed
compared to last year. Proportional operating cash return in Q3
2023 was at 14.1% compared to Q2 2023 at 13.7% mainly due to lower
operating capex in YTD 2023.
- Net profit attributable to holders of ordinary
shares -excluding exceptional items- was EUR 304 million
(YTD Q3 2022: EUR 206 million). Q3 2023 Earnings per
share -excluding exceptional items- continued to improve, Q3 2023
EPS was EUR 2.42 (47% year-on-year) compared to EUR 1.64 in Q3
2022.
- The total net debt : EBITDA ratio is 2.27x at
the end of Q3 2023 compared to Q3 2022: 3.02x and Q2 2023: 2.46x
below our ambition to keep net debt to EBITDA in the range of
around 2.5-3.0x.
Exceptional items in YTD Q3
2023 consist of:
- Partial reversal of impairment charges recorded in 2022,
related to the chemical terminal assets in Rotterdam, for an amount
of EUR 54.2 million, immediately before classification of these
assets as held for sale.
- Organizational restructuring charges of EUR 10.7 million YTD Q3
2023 (YTD Q2 2023: EUR 2.5 million) for changes in management
structure in line with Vopak’s strategic goals mainly include
employee termination benefits and advisor costs.
- A gain of EUR 49.7 million with a tax charge of EUR 28.7
million recognized in Q2 upon completion of the divestment of 100%
shareholding in Vopak Terminals Savannah Inc.
- Adjustment of receivable for Vopak Terminal Hamburg divestment
(2019) resulting in a charge of EUR 1.0 million in Q2.
For more information please
contact:
Vopak Press: Liesbeth Lans -
Manager External Communication,e-mail:
global.communication@vopak.comVopak Analysts and
Investors: Fatjona Topciu - Head of Investor
Relations, e-mail: investor.relations@vopak.com
The analysts’ presentation will be given via an
on-demand audio webcast on Vopak’s corporate website, starting at
9:30 AM CEST on 25 October 2023.
This press release contains inside information
as meant in clause 7 of the Market Abuse Regulation. The content of
this report has not been audited or reviewed by an external
auditor.
For Vopak's full press release, please refer to the
attached document.
- Vopak reports on Q3 2023 results
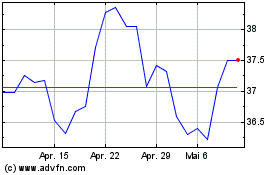
Koninklijke Vopak (EU:VPK)
Historical Stock Chart
Von Nov 2024 bis Dez 2024

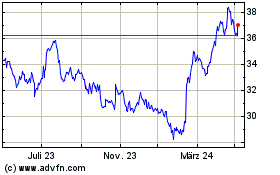
Koninklijke Vopak (EU:VPK)
Historical Stock Chart
Von Dez 2023 bis Dez 2024
