Worldcoin Rejection At $2.1 Sparks Concerns Of Prolonged Downtrend
01 November 2024 - 9:00PM
NEWSBTC
Worldcoin’s recent failure to breach the $2.15 resistance level has
put the token under renewed bearish pressure, leaving investors to
question if a prolonged downtrend may be unfolding. The $2.15 mark
has become a key battleground, with sellers pushing prices lower
each time buyers attempt a breakout. As Worldcoin struggles to
regain upward momentum, the risk of further declines grows,
signaling potential challenges ahead. This article aims to explore
the implications of Worldcoin’s recent struggle at the $2.1
resistance level and evaluate whether it could signal an extended
downtrend. Through an analysis of technical indicators and current
market dynamics, we’ll assess the possible risks and opportunities
for Worldcoin, offering traders insights into what may lie ahead
for the token’s price movement. Technical Indicators Signal
Potential For Extended Downtrend On the 4-hour chart, WLD’s price
is exhibiting negative momentum, trading below the 100-day Simple
Moving Average (SMA) as it trends downward toward the $1.27 support
level. A continued descent toward the $1.27 support suggests that
selling pressure is building, and if the support fails to hold,
Worldcoin could experience more declines. Also, the 4-hour
Composite Trend Oscillator for WLD is showing bearish signals, with
the SMA line crossing below the signal lines and approaching the
oversold zone, suggesting that sellers are becoming more dominant.
As the indicator nears oversold territory, it reflects heightened
selling pressure, raising the potential for a downtrend. Related
Reading: Worldcoin Gains Upside Momentum: Is A Major Breakout
Ahead? On the daily chart, Worldcoin is exhibiting strong downward
momentum, characterized by a bearish candlestick pattern following
a failed attempt to break through the resistance at $2.15,
indicating increased selling pressure and that the asset may
continue to drop. Additionally, WLD is currently facing challenges
as it attempts to drop below the 100-day SMA, a key indicator that
typically signals a pessimistic trend when breached. If WLD manages
to close below this level, it could further confirm the negative
sentiment in the market, potentially leading to additional selling
and a sustained downturn. A detailed analysis of the 1-day
Composite Trend Oscillator shows that WLD is likely facing extended
losses. The signal line has crossed below the SMA line and is
trending downward toward the zero line, indicating a negative shift
in momentum. Should the downward trend persist, Worldcoin could
encounter significant difficulties in recovering, resulting in a
prolonged period of waning price movement. Worldcoin Price Outlook:
Will Bears Maintain Control? As Worldcoin encounters heightened
downside pressure after being rejected at the $2.15 resistance
level, key support zones become crucial to monitor. If bears
continue to assert control, they may push the price down to the
$1.27 support level. Related Reading: Worldcoin Soars 31%: Will
Network Upgrades Push WLD Price Higher? A breakdown below this
level could lead to further losses, possibly testing other support
levels and intensifying pessimistic sentiment in the market.
Conversely, if support holds, it may restore confidence among
buyers and create an opportunity for a price recovery. Featured
image from YouTube, chart from Tradingview.com
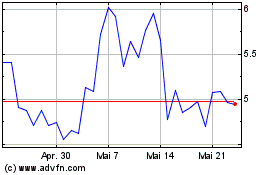
Worldcoin (COIN:WLDUSD)
Historical Stock Chart
Von Nov 2024 bis Dez 2024

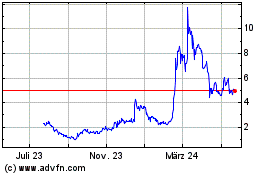
Worldcoin (COIN:WLDUSD)
Historical Stock Chart
Von Dez 2023 bis Dez 2024
