Chainlink (LINK) Holds Over 24% Gains In The Last Week As Market Rallies
20 Februar 2023 - 7:30PM
NEWSBTC
The crypto market has recently displayed more bullish movements
than bearish ones. This positive trend is evident in the prices of
several tokens, with the Chainlink (LINK) coin showing significant
growth in its value. In the last 7 days, LINK has seen more than
24% gains due to the recent rally in the broader crypto market.
Meanwhile, in the past 24 hours, Chainlink increased by around
0.88%, according to data from CoinMarketCap. Its current trading
price fluctuates around the $8.15 price mark. Related Reading:
Bitcoin Bull Run Still Too Soon To Call, This Quant Cautions
According to information from CoinGecko, Chainlink shows a 24-hour
trading volume of over $756K and a market cap of more than $4
billion. Chainlink Price History And Factors Influencing Its Rally
Chainlink (LINK) has experienced a significant amount of price
volatility since its inception. After its launch in 2017, LINK was
trading at $0.11, and by May 10, 2021, it reached an all-time high
of $52.88. Coming into 2023, on January 1, Chainlink was trading
between $5.57 and $5.63 and eventually closed the day at $5.62. As
per CoinMarketCap data, the maximum price of LINK throughout
January was $7.48. Chainlink launched into February at $6.95 with a
24-hour trading volume of over $312 million and a market cap
surpassing $3.6 billion. Since the start of the month, it has
maintained a price range between $6.48 and $8.24. According to the
historical data from CoinMarketCap, the current year’s high of the
Chainlink token stands at $8.13. Some prominent factors affecting
the token’s price include increased adoption and the broader crypto
market sentiment. Currently, the Fear and Greed Index of the crypto
market value stands at 58. This value indicates growing investors’
interest in the digital currency market. Regarding adoption, the
Chainlink network has seen growing interest from other projects. A
notable achievement shared on Chainlink Today, is that Chainlink
VRF (Verifiable Random Function) will power the minting of
PLYPOGO’s genesis NFT collection. Similarly, Amberpark collectors
can build new metaphysical identities connecting web3 to real life
through fashion. Amberpark is the multimedia artist behind
PLAYPOPGO. Secondly, TPICAP Group PLC has announced that it
will supply high-quality forex data for traders through the
Chainlink ecosystem. The electronic market infrastructure and
information provider makes this move to support web 3
expansion. Also, on February 9, MakerDAO announced that it
would integrate Chainlink’s Automation into its Keeper Network to
boost decentralization and ensure the stability of DAI stablecoin.
Another adoption on February 9 was by AAVE integrating Chainlink’s
Proof of Reserve to boost its verifiability and transparency.
Chainlink (LINK) Price Prediction LINK is up by 0.37% within 24
hours, trading at $8.13 today. The asset snapped out of the $5
price level to trade at $6.07 on January 9, 2023. Also, it traded
at $7 between February 15 and 17 with slight price variations. It
hit $8.01 on February 18 and may likely continue its price rally.
Chainlink is trading above its 50-day and 200-day Simple Moving
Average (SMA), which indicates a bullish sentiment in the short and
long term. It is on its fourth consecutive green day, confirming
the positive trend. The Relative Strength Index (RSI) value is
67.38, close to the overbought region of 70. It also confirms a
bullish pressure in the market. The support levels are $7.43,
$7.64, and $7.81, while the resistance levels are $8.20, $8.42, and
$8.59. Related Reading: Bitcoin Puell Multiple Hits 14-Month High,
Here’s What It Means LINK’s MACD ( Moving Average
Convergence/Divergence) has crossed above the signal line due to
the sustained rally. LINK will likely surpass the $8.20 resistance
level in the coming days. However, a slight pullback is a
possibility before it the rally continues. Featured image from
Pixabay and chart from TradingView.com
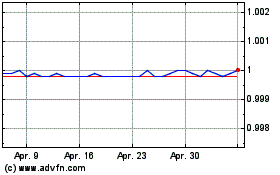
Dai Stablecoin (COIN:DAIUSD)
Historical Stock Chart
Von Okt 2024 bis Nov 2024

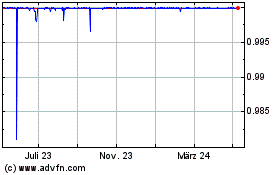
Dai Stablecoin (COIN:DAIUSD)
Historical Stock Chart
Von Nov 2023 bis Nov 2024


