FLANIGAN'S REPORTS EARNINGS
18 Mai 2023 - 12:29AM
PR Newswire (US)
FORT
LAUDERDALE, Fla., May 17, 2023
/PRNewswire/ -- FLANIGAN'S ENTERPRISES, INC., (NYSE AMERICAN: BDL)
owners and operators of the "Flanigan's Seafood Bar and Grill"
restaurants and "Big Daddy's" retail liquor stores, announced
results for the 13 weeks and the 26 weeks ended April 1, 2023. The table below sets forth
the results on a comparative basis with the 13 weeks and the 26
weeks ended April 2, 2022.
|
|
|
|
|
13 Weeks
Ended
|
|
13 Weeks
Ended
|
|
REVENUES
|
|
|
April 1,
2023
|
|
April 2,
2022
|
|
|
|
|
|
|
|
|
|
|
|
RESTAURANT FOOD AND BAR
SALES
|
$
|
34,394,000
|
|
$
|
31,444,000
|
|
PACKAGE STORE
SALES
|
|
|
8,659,000
|
|
|
8,148,000
|
|
FRANCHISE RELATED
REVENUES
|
|
|
484,000
|
|
|
478,000
|
|
RENTAL
INCOME
|
|
|
|
218,000
|
|
|
199,000
|
|
OTHER OPERATING
INCOME
|
|
|
48,000
|
|
|
61,000
|
|
TOTAL
REVENUES
|
|
|
$
|
43,803,000
|
|
$
|
40,330,000
|
|
|
|
|
|
|
|
|
|
|
|
NET INCOME ATTRIBUTABLE
TO
|
|
|
|
|
|
|
|
FLANIGAN'S ENTERPRISES,
INC.
|
|
$
|
1,897,000
|
|
$
|
1,660,000
|
|
|
|
|
|
|
|
|
|
|
|
NET INCOME PER COMMON
SHARE
|
|
|
|
|
|
|
BASIC AND
DILUTED
|
|
$
|
1.02
|
|
$
|
0.89
|
|
|
|
|
|
|
|
|
|
|
|
|
|
|
|
|
|
|
|
|
|
|
|
|
|
26 Weeks
Ended
|
|
26 Weeks
Ended
|
|
|
|
|
|
April 1,
2023
|
|
April 2,
2022
|
|
|
|
|
|
|
|
|
|
|
|
RESTAURANT FOOD AND BAR
SALES
|
$
|
66,149,000
|
|
$
|
59,656,000
|
|
PACKAGE STORE
SALES
|
|
|
18,062,000
|
|
|
16,659,000
|
|
FRANCHISE RELATED
REVENUES
|
|
|
943,000
|
|
|
924,000
|
|
RENTAL
INCOME
|
|
|
|
431,000
|
|
|
398,000
|
|
OTHER OPERATING
INCOME
|
|
|
79,000
|
|
|
96,000
|
|
TOTAL
REVENUES
|
|
|
$
|
85,664,000
|
|
$
|
77,733,000
|
|
|
|
|
|
|
|
|
|
|
|
NET INCOME ATTRIBUTABLE
TO
|
|
|
|
|
|
|
|
FLANIGAN'S ENTERPRISES,
INC.
|
|
$
|
2,521,000
|
|
$
|
3,224,000
|
|
|
|
|
|
|
|
|
|
|
|
NET INCOME PER COMMON
SHARE
|
|
|
|
|
|
|
BASIC AND
DILUTED
|
|
$
|
1.36
|
|
$
|
1.73
|
 View original
content:https://www.prnewswire.com/news-releases/flanigans-reports-earnings-301827900.html
SOURCE FLANIGAN'S ENTERPRISES, INC.

Copyright 2023 PR Newswire
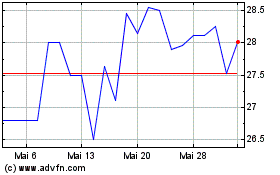
Flanigans Enterprises (AMEX:BDL)
Historical Stock Chart
Von Okt 2024 bis Nov 2024

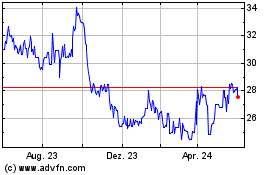
Flanigans Enterprises (AMEX:BDL)
Historical Stock Chart
Von Nov 2023 bis Nov 2024


