Goldshore
Announces
an Indicated
Mineral Resource Estimate of 1,535Koz Contained Gold at 1.23 g/t
Au and an
Inferred Mineral Resource Estimate of 5,198Koz Contained Gold at
1.11 g/t Au at the Moss Gold Project
VANCOUVER,
B.C., February 6, 2024: Goldshore Resources
Inc. (TSXV:
GSHR / OTCQB: GSHRF / FWB: 8X00)
("Goldshore" or the "Company") is
pleased to announce an updated mineral resource estimate (the
"MRE") for
the Moss deposit ("Moss" or the
"Moss
Deposit") and East Coldstream deposit
("East
Coldstream" or the "East Coldstream
Deposit"), both located at its 100%-owned Moss Gold
Project in Northwest Ontario, Canada (the "Moss Gold
Project" or the "Project").
Highlights
of the 2024 Mineral Resource Estimate Update:
-
Upgrading
of the MRE to include 23% Indicated Mineral Resources and an
increase in the average grade over the 2023 MRE.
-
Indicated Mineral Resource of 1,535 thousand
ounces grading 1.23 grams per tonne gold (g/t Au),
contained within 38.96 million tonnes.
-
Inferred Mineral Resource of 5,198 thousand
ounces grading 1.11 grams per tonne gold (g/t Au), contained within
146.24 million tonnes.
-
The total resource tonnage increase is just
under 1% overall over the 2023 MRE, however the overall grade
increase versus the 2023 MRE is approximately 11%.
-
The shears that host gold mineralization have
been extensively remodelled as constraining domains, greatly
enhancing the reliability of the current MRE.
-
With gold prices consistent with the 2023
MRE, 94% of the 2024 MRE's tonnes and gold ounces are contained
within these shear models.
-
This is a significant increase compared to
the 2023 MRE, where only 35% of the tonnes and 65% of the gold
ounces were contained in its shear model.
-
Implied stripping ratios based on diluted
block models and the Reasonable Potential for Eventual Economic
Extraction ("RPEEE")
constraining pit optimization are 3:1 for Moss and 6:1 for East
Coldstream.
-
The pit depth is constrained by the model (in
multiple locations), indicating the potential for a larger pit
should the model be extended at depth.
-
The 2024 Moss Project MRE update is set to be
the foundation for resource growth and development towards Tier One
status, and leading to a future Preliminary Economic Assessment
(PEA).
-
All identified zones within the Project are
still open to potential expansion.
-
The Moss Project encompasses 36 satellite
targets, including several mapped and sampled gold trends near the
Moss Gold Deposit, offering prospects for discoveries and
additional gold mineralization.
Table 1:
Moss Project Updated Mineral Resource Estimate
|
|
|
Indicated
|
Inferred
|
|
|
Cutoff
|
Tonnes
|
Grade
|
Metal
|
Tonnes
|
Grade
|
Metal
|
|
|
(g/t Au)
|
(Mt)
|
(g/t Au)
|
(Koz Au)
|
(Mt)
|
(g/t Au)
|
(Koz Au)
|
|
Moss
|
|
|
Core
Shears
|
0.35
|
19.95
|
1.39
|
893
|
56.32
|
1.39
|
2,525
|
|
Marginal
Shears
|
0.35
|
11.35
|
0.92
|
335
|
70.31
|
0.81
|
1,836
|
|
Low
Grade Halo
|
0.35
|
-
|
-
|
-
|
10.21
|
0.62
|
202
|
|
Open Pit
Subtotal
|
|
31.30
|
1.22
|
1,228
|
136.84
|
1.04
|
4,563
|
|
Underground
|
2.0
|
-
|
-
|
-
|
3.22
|
3.43
|
355
|
|
Moss Total
|
0.35/2.0
|
31.30
|
1.22
|
1,228
|
140.07
|
1.09
|
4,919
|
|
East
Coldstream
|
|
Open
Pit
|
0.35
|
7.67
|
1.25
|
307
|
5.36
|
1.15
|
198
|
|
Underground
|
2.0
|
-
|
-
|
-
|
0.82
|
3.10
|
82
|
|
E Coldstream
Total
|
0.35/2.0
|
7.67
|
1.25
|
307
|
6.18
|
1.41
|
280
|
|
Grand Total
|
0.35/2.0
|
38.96
|
1.23
|
1,535
|
146.24
|
1.11
|
5,198
|
Notes:
-
The 2024 Moss Mineral Resources were estimated and classified in
accordance with the Canadian Institute of Mining, Metallurgy and
Petroleum ("CIM") "Estimation of Mineral Resources and Mineral
Reserves Best Practice Guidelines" dated November 29, 2019, and the
CIM "Definition Standards for Mineral Resources and Mineral
Reserves" dated May 10, 2014.
-
Mr. Michael Dufresne, M.Sc., P.Geol., P.Geo. and Mr. Warren Black,
M.Sc., P.Geo. both of APEX Geoscience Ltd. ("APEX") qualified persons as defined by
NI 43-101, are responsible for completing the updated mineral
resource estimation, effective January 31, 2024.
-
Mineral resources that are not mineral reserves have no
demonstrated economic viability. No mineral reserves have been
calculated for Moss. There is no guarantee that any part of the
mineral resources discussed herein will be converted to a mineral
reserve in the future.
-
The estimate of mineral resources may be materially affected by
environmental, permitting, legal, title, market, or other relevant
factors.
-
The quantity and grade of reported Inferred Resources is uncertain,
and there has not been sufficient work to define the Inferred
Mineral Resource as an Indicated or Measured Mineral Resource. It
is reasonably expected that most of the Inferred Mineral Resources
could be upgraded to Indicated Mineral Resources with continued
exploration.
-
The historical underground voids from mining in any of the deposit
areas have been removed.
-
All figures are rounded to reflect the relative accuracy of the
estimates. Totals may not sum due to rounding. Resources are
presented as undiluted and in situ.
-
Tonnage estimates are based on individually measured and calculated
bulk densities for geological units ranging from 2.68 to 2.89
g/cm³. Overburden density is set at 1.8 g/cm³.
-
Metal prices are US$1,850/oz Au with a revenue factor of 1 and
recovery of 90% for Moss and 95% for East Coldstream.
-
Open-pit resource economic assumptions are mining costs of
US$2.25/waste tonne, $3.00/ore tonne, flotation-leaching processing
costs of US$9.50 per tonne, and mine-site administration costs of
US$2.10 per tonne processed.
-
Open-pit resources comprise blocks constrained by the pit shell
resulting from the pseudoflow optimization using the open-pit
economic assumptions and 50° pit slopes.
-
Underground resource economic assumptions are US$75/tonne for
mining mineralized and waste material and US$9.50/tonne for
processing. The underground resource mining assumptions are open
pit stope mining method with a minimum mining width of 1.5m and a
minimum stope volume equal to stope dimensions of 1.5m x 10m x
20m.
-
The Underground material below the open pit was manually
constrained to continuous material above the gold cutoff (2.0 g/t)
that met the minimum thickness and volume requirements. Resources
not meeting these size criteria are included if they maintain a
grade above the cutoff once diluted to the required size.
Table 2:
Moss Project Updated Open Pit Mineral Resource Estimate
Sensitivity
|
Cutoff (g/t Au)
|
Indicated
|
Inferred
|
|
Tonnes (Mt)
|
Grade
(g/t Au)
|
Metal
(Koz Au)
|
Tonnes (Mt)
|
Grade
(g/t Au)
|
Metal
(Koz Au)
|
|
Moss
|
|
0.2
|
33.55
|
1.16
|
1,249
|
185.72
|
0.83
|
4,985
|
|
0.3
|
32.36
|
1.19
|
1,239
|
150.61
|
0.97
|
4,707
|
|
0.35
|
31.30
|
1.22
|
1,228
|
136.84
|
1.04
|
4,563
|
|
0.4
|
30.15
|
1.25
|
1,214
|
125.85
|
1.10
|
4,431
|
|
0.5
|
27.31
|
1.34
|
1,173
|
104.78
|
1.22
|
4,126
|
|
0.6
|
24.05
|
1.44
|
1,115
|
86.6
|
1.37
|
3,807
|
|
0.8
|
17.88
|
1.70
|
977
|
60.33
|
1.66
|
3,221
|
|
1.0
|
13.00
|
2.00
|
836
|
42.89
|
1.97
|
2,721
|
|
East
Coldstream
|
|
0.2
|
8.70
|
1.13
|
316
|
6.54
|
0.99
|
208
|
|
0.3
|
8.01
|
1.21
|
311
|
5.73
|
1.09
|
201
|
|
0.35
|
7.66
|
1.25
|
307
|
5.35
|
1.15
|
198
|
|
0.4
|
7.33
|
1.29
|
303
|
4.99
|
1.20
|
193
|
|
0.5
|
6.59
|
1.38
|
292
|
4.36
|
1.31
|
184
|
|
0.6
|
5.92
|
1.47
|
280
|
3.77
|
1.43
|
174
|
|
0.8
|
4.58
|
1.70
|
250
|
2.94
|
1.64
|
155
|
|
1.0
|
3.49
|
1.95
|
219
|
2.31
|
1.84
|
137
|
-
See
footnotes for Table 1
Table 3:
Moss Project Updated Underground Mineral Resource Estimate
Sensitivity
|
Cutoff (g/t Au)
|
Inferred
|
|
Tonnes (Mt)
|
Grade
(g/t Au)
|
Metal
(Koz Au)
|
|
Moss
|
|
1.8
|
3.96
|
3.14
|
400
|
|
1.9
|
3.56
|
3.29
|
377
|
|
2.0
|
3.22
|
3.43
|
355
|
|
2.1
|
2.89
|
3.59
|
334
|
|
2.2
|
2.60
|
3.75
|
314
|
|
2.4
|
2.11
|
4.09
|
277
|
|
East
Coldstream
|
|
1.8
|
1.00
|
2.88
|
93
|
|
1.9
|
0.90
|
3.00
|
87
|
|
2.0
|
0.82
|
3.10
|
82
|
|
2.1
|
0.76
|
3.19
|
78
|
|
2.2
|
0.70
|
3.28
|
74
|
|
2.4
|
0.60
|
3.45
|
66
|
-
See
footnotes for Table 1
President
and CEO Brett Richards stated: "The MRE results above are
extremely encouraging, and validate the strategic exploration and
drilling campaign we embarked on almost 3 years
ago.
We have
consistently delivered exciting drilling results as they relate to
the Moss Gold Project, and this MRE illustrates a meaningful and
material increase in the quality, quantity, and grade of the
deposit.
Conducting
this update to the MRE was the logical next step in defining our
strategy going forward of understanding and defining the potential
of the Moss Gold Project; in an effort to maximize shareholder
value.
We
continue to believe that the Moss Gold Project will be a sector
anomaly of having top quartile grade and top quartile size and
scale within our comparable peers; as it moves closer to being a
Tier One asset."
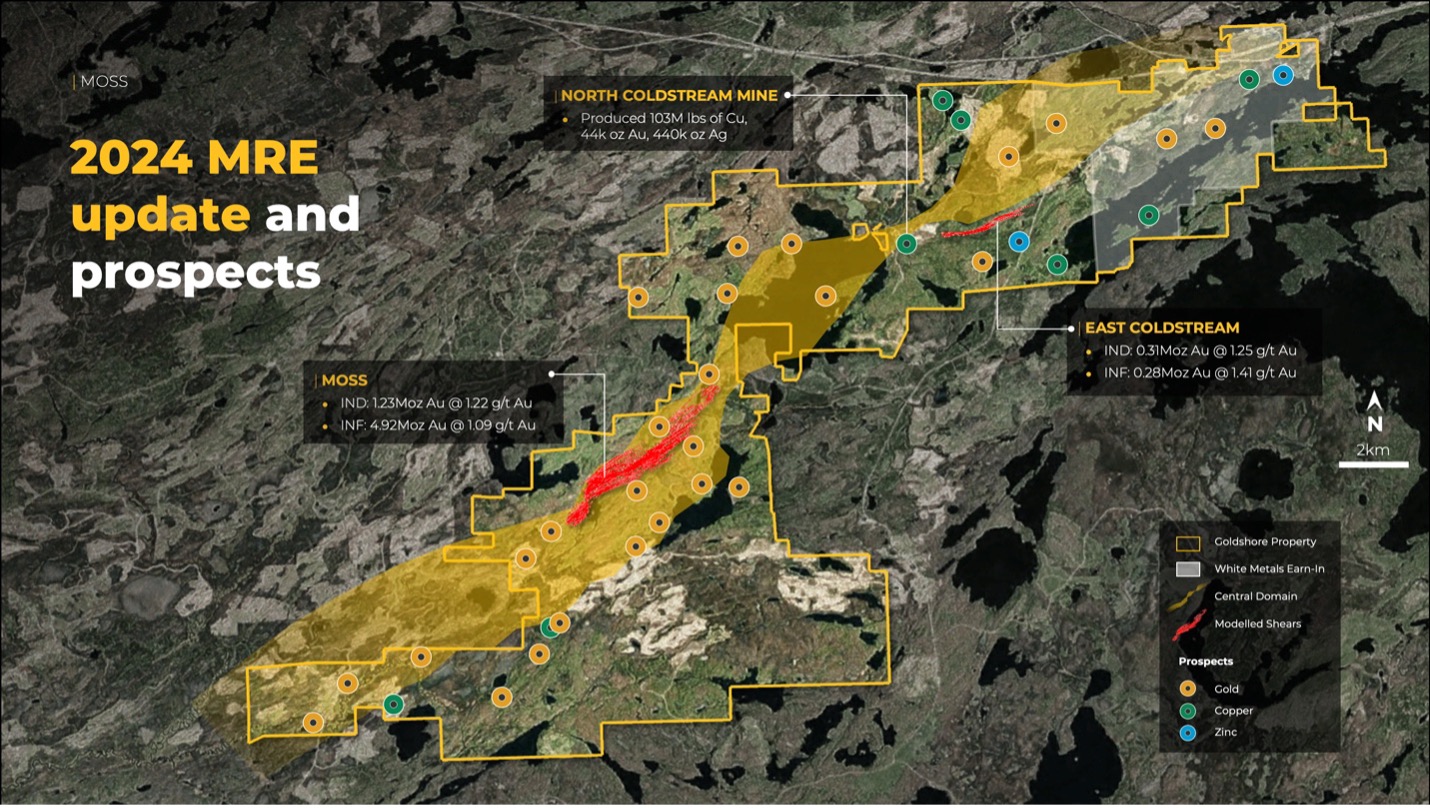
Figure 1:
Location of Moss Deposit and East Coldstream Deposit in the Moss
Gold Project
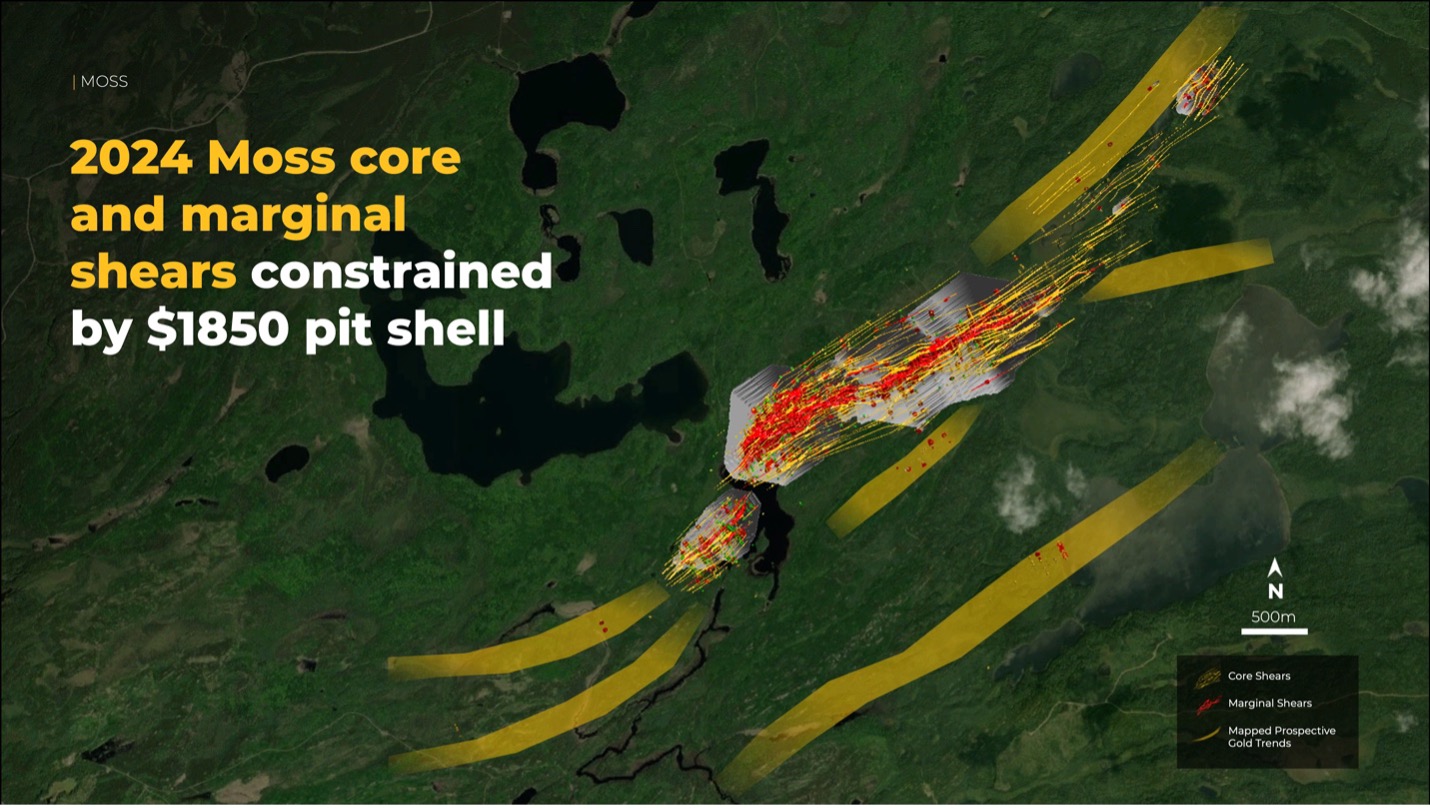
Figure 2:
Plan of Moss showing shears, $1850 pit shell and mapped mineralized
trends
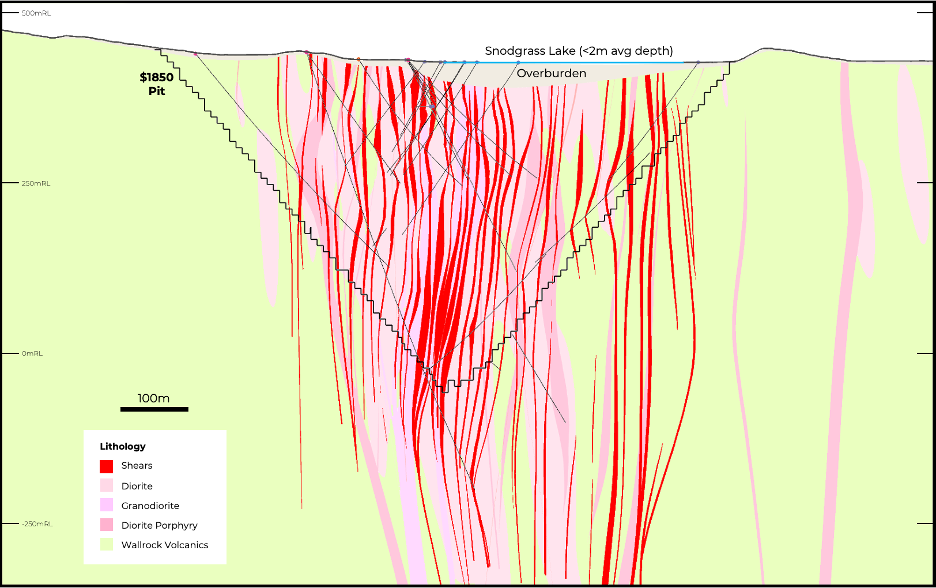
Figure
3: Cross
section through the Moss Main Zone showing geology
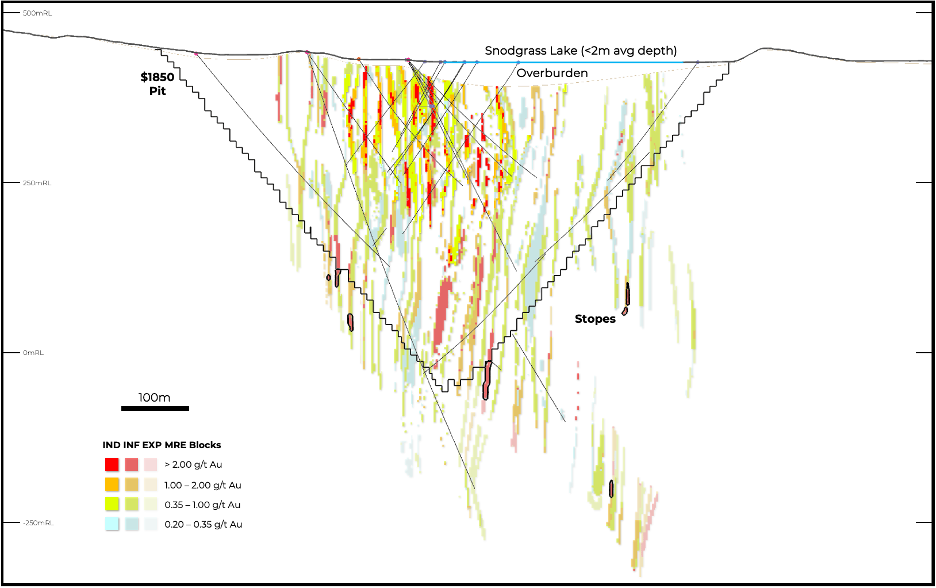
Figure
4: Cross
section through the Moss Main Zone showing grade model, $1850 open
pit shell and modelled stopes
Figure 5:
Plan of East Coldstream showing shears, cross-cutting diabase dike
and $1850 pit shell
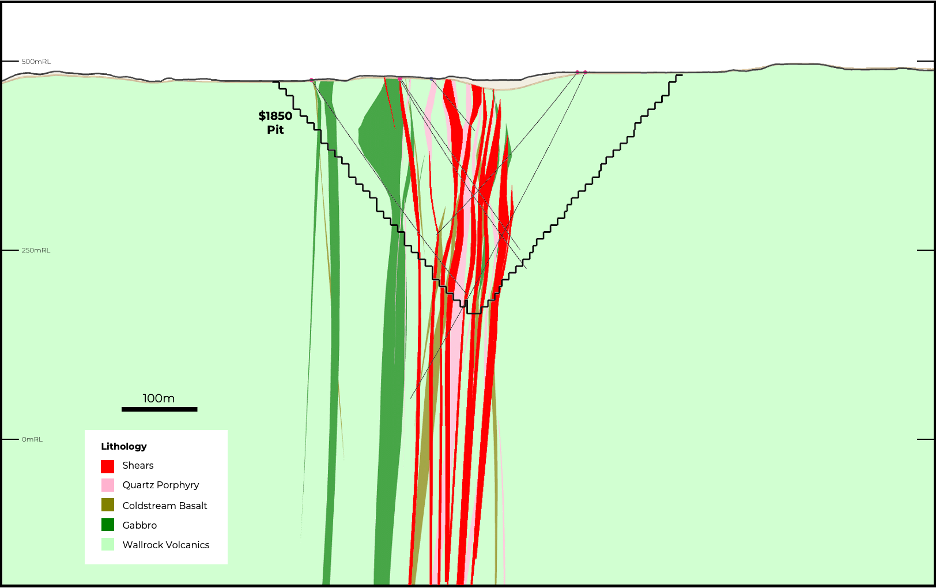
Figure 6:
Cross section through East Coldstream showing geology
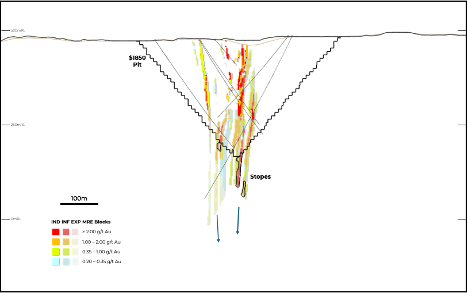
Figure 7:
Cross section through East Coldstream showing grade model, $1850
open pit shell and modelled stopes
Technical Overview
Historical Assay Review
APEX Geoscience Ltd. ("APEX")
completed an in-depth review and validation of assays collected
before 2010 at the Moss Deposit and East Coldstream Deposit to
establish whether the data is suitable for mineral resource
estimation. APEX reviewed previous studies' evaluation of twin
drilling and resampling programs and drew the following conclusions
regarding this data:
-
Five twin holes have been completed in the
Moss Zone. APEX regards this dataset as limited, insufficient for
definitive conclusions, but adequate for a preliminary assessment.
This view is due to the deposit's characteristics and challenges in
accurately positioning twin holes adjacent to historical holes. The
data indicate that the twin holes generally exhibit mineralization
that corresponds with the mineralization trends noted in the
historical drillholes they were designed to test and
confirm.
-
Six historical drillholes were resampled to
determine potential bias in the historical dataset.
-
Prior analyses of the resampling program
focused on comparing the difference between each interval's
historical and modern assays and noting variance discrepancies
between the two datasets.
-
APEX performed a quantile-to-quantile
comparison between resampled and historical assays and the results
show similar distributions, indicating no significant bias in
resampling assay values vs original values.
-
APEX considers the noted variance difference
to be within expected ranges, as the differences in sampling
volumes could explain any discrepancies.
-
These findings remain partially inconclusive
due to the limited number of holes resampled.
Due to the inconclusive results from the
twinning and resampling programs, APEX conducted a spatial pairing
analysis. This analysis compared the distribution of historical
assays with modern drilling data. The assay data was limited to
samples within the 2023 modelled shear domains, ensuring only
assays from similar geological settings were compared. In this
analysis, only assays from either dataset that are within 15 meters
of an assay from the other dataset could be considered.
The dataset included thousands of paired
samples to complete the analysis on. Below
are APEX's conclusions:
-
The assay distributions of historical paired
data and modern paired data were found to be similar after
accounting for comparable mineralization zones.
-
No evident bias in historical assays was
observed that could be attributed to assay methods or assay labs or
different generations (ages) of data.
-
Some historical data involved selective
assaying. Inserting nominal waste values for unsampled intervals
yields a conservative gold content estimate at the sample
location.
Based upon this analysis, the QP believes
that the historical assays can be used for a mineral resource
estimate even with limited historical QA/QC data. Details of the
Historical Assay Review and Analysis will be provided in a
technical report with an effective date of January 31, 2024,
prepared in accordance with National Instrument 43-101
("NI
43-101") standards.
Moss Deposit Geology
The Moss Deposit is a structurally controlled
gold deposit within the greenstone terrain of the Shebandowan Belt
in the Archean Superior Province. Mineralization is localized where
the major NE-trending Wawiag Fault Zone cuts a dioritic to
granodioritic intrusion complex. The
deposit comprises a network of centimetre- to meter-scale
northeast-trending shear zones hosting high-grade gold
mineralization. Surrounding the shear zones are areas of
lower-grade gold mineralization associated with less intense
shearing and more brittle deformation. This includes veining in
both the intrusion rock and adjacent wall rocks between the shear
zones. Mineralization is associated with pyrite, sericite and
chlorite alteration and millimetre- to centimetre-scale irregular
quartz-carbonate veinlets.
East Coldstream Deposit Geology
The East Coldstream Deposit is a structurally
controlled gold deposit located approximately 13 km northeast of
the Moss Deposit within the Moss Gold Project area. The East
Coldstream Deposit's mineralized zones are located on the south
margin of a shear zone that separates a gabbroic intrusion to the
north and a mafic-intermediate volcanic suite to the south.
Mineralization is found within sheared volcanic units, proximal to
sills of quartz and quartz-feldspar porphyries and distinctive,
brick-red syenites. The mineralized zones show silica, carbonate,
and hematite alteration. Mineralization consists of fine
disseminations of pyrite and lesser chalcopyrite throughout the
silica-hematite zones and within quartz-carbonate veinlets. Iron
carbonate is present in areas proximal to strong silicification. A
north-south-trending diabase dike has cut the two main mineralized
zones.
Mineral Resource Methodology, Assumptions,
and Cutoff Grades
Estimation Domains
APEX personnel comprehensively remodelled shear-hosted gold
estimation domains at Moss and East Coldstream deposits using
implicit modelling. The orientation of these domains is informed by
a structural trend model derived from oriented core structural
measurements. Additionally, APEX personnel developed an updated
geological model to guide estimation domain modelling and
facilitate density assignment by geological unit. The shear
estimation domains are delineated by connecting intervals of
mineralization that align with the structural trend and are
predominantly within a single geological unit. Discontinuous and
lower-grade gold mineralization associated with less intense
shearing and more brittle deformation are captured within a grade
shell with a nominal cutoff of 0.15 g/t Au.
The Granodiorite (IGD) unit at the Moss Lake
Deposit is associated with zones of higher-grade mineralization. In
the 2024 Moss Deposit MRE Update, modelled shear estimation domains
are categorized as "Core Shears" or "Marginal Shears." Core Shears,
continuous along strike, represent higher-grade material within or
adjacent to the IGD unit. Marginal Shears, in contrast, are shears
positioned further from the IGD unit or within shear domains where
lower-grade material is included to provide continuity along the
structural trend. Core shears are characterized by more intense
fracturing and extensive hydrothermal alteration than marginal
shears. The Core and Marginal Shears classification merges
short-range geological with longer-range structural continuity at
the Moss Deposit.
In this 2024 model, more than 94% of the in
pit block modelled gold mineralization tonnage above the cutoff
grade is contained within the wireframed Core Shear and Marginal
Shear domains. More than 96% of the block modelled gold
mineralization in terms of metal content above the cutoff grade is
also contained within the Core Shear and Marginal Shear
domains.
Mineral Resource Methodology
Modelling was conducted in the Universal
Transverse Mercator (UTM) coordinate space relative to the North
American Datum (NAD) 1983 and UTM zone 15N (EPSG: 26915). The
mineral resource block model utilized a block size of 3.0 m (X) x
3.0 m (Y) x 3.0 m (Z) to honour the mineralization wireframes. The
percentage of the volume of each block below the bare earth
surface, below the modelled waste overburden surface and within
each mineralization domain was calculated using the 3D geological
models and a 3D surface model. For the open pit resources, the
block model was block-averaged up to a 9 m (X) x 9 m (Y) x 9 m (Z)
SMU block size for pit optimization with the outer blocks on the
boundaries of the domains diluted. Resources are presented as
undiluted and in situ. The historical underground voids from
Noranda's 1980s exploration program have been removed from the MRE
at the Moss Deposit.
The MRE is based on the combination of
geological modelling, geostatistics and conventional block
modelling using the Ordinary Kriging method of grade interpolation
with locally varying anisotropy variogram models.
The Moss Project drillhole database consists
of 538 drill holes that intersected the interpreted mineralization
wireframes at the Moss Deposit and 156 drill holes that intersected
the interpreted mineralization wireframes at the East Coldstream
Deposit for a total of 738 Drill Holes used in the Mineral Resource
Estimate. Gold assays were composited to 2-meter composite lengths,
and the estimation utilized 31,149 composited samples. A total of
1.8% of the total drilled meters inside the interpreted
mineralization wireframes were not sampled, assumed to be waste,
and assigned a nominal waste value of half the detection limit of
modern assay methods (0.0025 g/t Au).
Gold estimation was completed using ordinary
kriging. The search ellipsoid size used to estimate the Au grades
was defined by the modelled variograms. Block grade estimation
employed locally varying anisotropy, which uses different rotation
angles to define the principal directions of the variogram model
and search ellipsoid on a per-block basis. Blocks within estimation
domains are assigned rotation angles using a modelled 3D
mineralization trend surface wireframe, which allows structural
complexities to be reproduced in the estimated block model. The
number of variogram structures, contributions of each structure,
and their ranges are set per estimation domain and do not vary
within the estimation domain.
A total of 2,812 bulk-density samples are
available from the Moss Project drillhole database. APEX personnel
performed exploratory data analysis of the bulk density samples
available, and the density was assigned for each geologic unit
modelled within the Moss Lake Deposit and East Coldstream Deposit
areas. The density of the deposits ranged from 2.68
g/cm3
to 2.89 g/cm3. The modelled overburden was
assigned a density of 1.8 g/cm3.
Mineral Resource Classification
The
Moss Gold Project MRE has been classified as an Indicated and
Inferred Mineral Resource. This resource classification reflects
that much of the drill hole data used for the resource estimate is
historical, and no QA/QC data or reports exist for most of these
drill holes. Statistical assessment of historical data spatially
near modern assay data support the use of the historical data in
the mineral resource estimate including the indicated category of
classification..
The
resource is classified according to the CIM "Estimation of Mineral
Resources and Mineral Reserves Best Practice Guidelines" dated
November 29, 2019, and CIM "Definition Standards for Mineral
Resources and Mineral Reserves" dated May 10, 2014.
Reasonable Prospects for Eventual Economic Extraction
The
CIM guidelines for mineral resources require that reported mineral
resources demonstrate reasonable prospects for eventual economic
extraction (RPEEE). Table 4 outlines the cost parameters and other
assumptions used to constrain the open-pit mineral resource
statement and reporting cutoff. The resource block model underwent
several pit optimization scenarios using Deswik's Pseudoflow pit
optimization. The resulting pit shell is used to constrain the
reported open-pit MRE that reaches a
maximum depth of approximately 510m and 340m in the
Moss Deposit and
East Coldstream Deposit, respectively.
Table 4:
Open Pit RPEEE Cost and Parameter Assumptions
|
Costs and
Geometry
|
|
Parameter
|
Unit
|
2024
MRE
|
|
Mining Waste
|
US$/ tonne waste
|
2.25
|
|
Mining Mineralized Material
|
US$/ tonne milled
|
3.00
|
|
Flotation Leach Processing
|
US$/ tonne milled
|
9.50
|
|
General and Administration
|
US$/ tonne milled
|
2.10
|
|
Slope
|
Degrees
|
50
|
|
Sale Price and
Recoveries
|
|
Gold Recovery (Moss Lake)
|
Percent
|
90
|
|
Gold Recovery (East Coldstream)
|
Percent
|
95
|
|
Gold Price
|
US$/ozt
|
1850
|
The reported underground MRE is constrained
within mining shapes assuming open-stope mining methods, a grade
cutoff of 2.0 g/t Au, and the assumptions detailed in Table
5. The mining shapes were manually constructed,
constraining continuous material above the gold cutoff that met the
minimum thickness and volume requirements.
Table 5:
Underground RPEEE Cost and Parameter Assumptions
|
Costs and
Geometry
|
|
Parameter
|
Unit
|
2024
MRE
|
|
Mining
|
US$/ tonne removed
|
75
|
|
Flotation Leach Processing
|
US$/ tonne milled
|
9.50
|
|
General and Administation
|
US$/ tonne milled
|
2.10
|
|
Assumed Open Stope Dimensions (W x H x
L)
|
Meters
|
1.5 x 10 x 20
|
|
Sale Price and
Recoveries
|
|
Gold Recovery (Moss Lake)
|
Percent
|
90
|
|
Gold Recovery (East Coldstream)
|
Percent
|
95
|
|
Gold Price
|
US$/ozt
|
1850
|
Additional Exploration Potential
The modelled shears extend to much greater
depth below the optimized open pit constraining the reported Moss
MRE. The shears are also open along strike, beyond the modelled
strike length of 5.7km. Historical drilling has intercepted gold
mineralization over a total strike length of 8 km, which has been a
focus of Goldshore's 2023 soil geochemistry and structural mapping
programs. This work suggests a series of en echelon
"master shears" with a second prospective
zone trending from just north of QES to the northeast beyond Span
(Figures 2 to 4 and 8).
Furthermore, there remains potential for
additional parallel shears with gold mineralization in historical
drill holes up to 2.5km to the southeast of the Moss
Deposit.
An additional 4 million tonnes of gold
mineralization has been identified and modelled inside the
conceptual open pit that is beyond the support distances required
for Inferred or Indicated classification. This tonnage represents a
target for future exploration drilling and resource
development.
Similar to the Moss deposit, the modelled
shears in East Coldstream extend to a greater depth below the
optimized open pit constraining the reported MRE. The
mineralization demonstrates a distinct shallow easterly plunge
which has been successfully tested at depth by Goldshore drilling
and represents potential for additional gold mineralization
discoveries beneath the current defined MRE open pit (Figures 5 to
7).
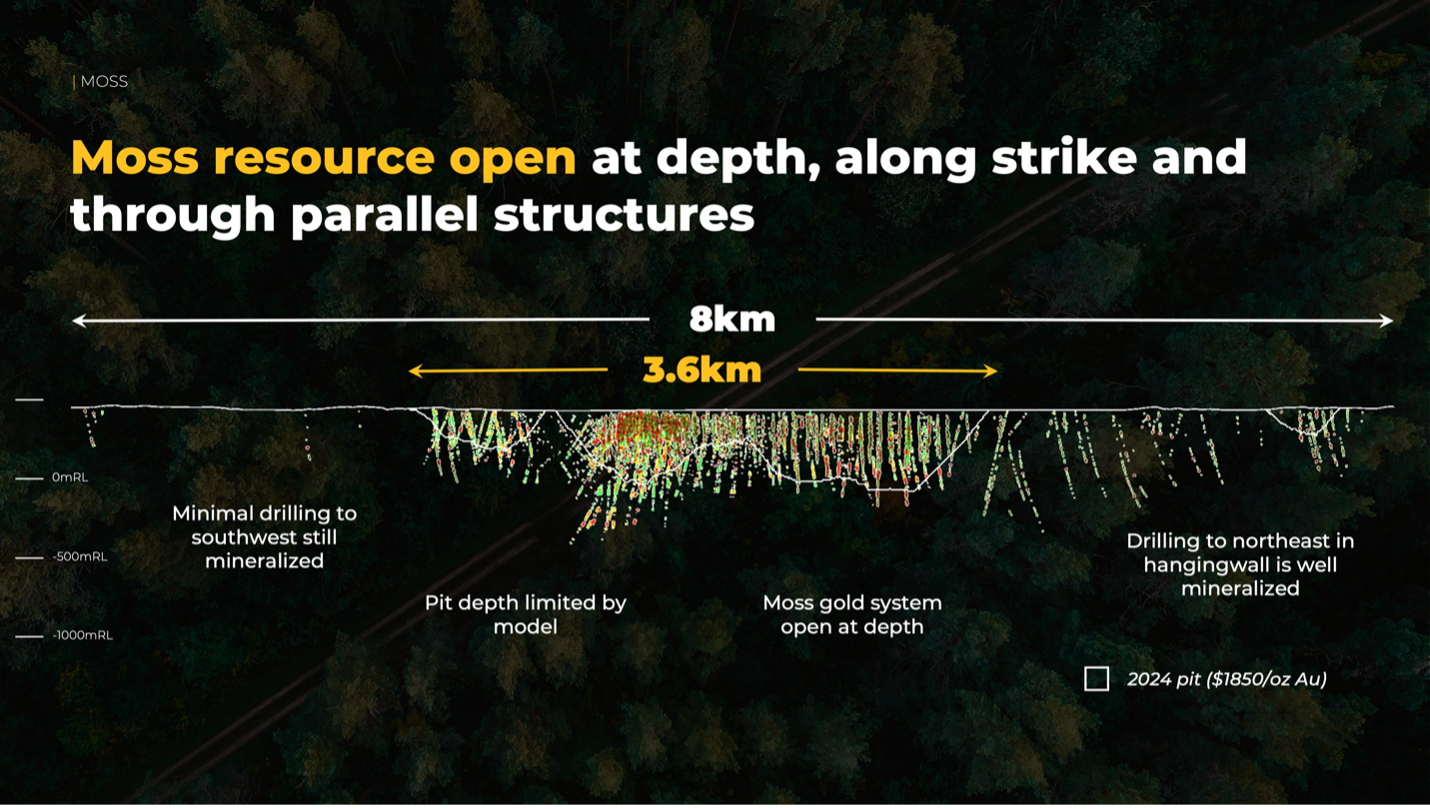
Figure 8:
Long section at the Moss Deposit showing gold mineralization in
drillholes along strike and at depth looking northwest
Next Steps
Goldshore will also continue an extensive
program of relogging and resampling of all historical drill holes
whose collars have been located and accurately surveyed. Where
possible, these drill holes are also being surveyed using modern
downhole surveying equipment. Resampling of historical drill core
will continue, although most core blocks are now illegible
rendering resampling impossible.
Pete
Flindell, VP Exploration for Goldshore, said:
"APEX have
completed a thorough and objective review of the geology of the
Moss and East Coldstream Gold Deposits, and the underlying drill
database. Their implicit modelling of core and marginal shears has
led to a more accurate model of the gold distribution. This has
resulted in a significant improvement in the Mineral Resource
Estimate, which can now form the basis for infill and step out
drill planning, and a definitive PEA. Their work also highlights
immediate potential to grow the MRE in and outside of the RPEEE
pits."
Qualified Person Statements
Mr. Michael Dufresne, M.Sc., P.Geol., P.Geo.
and Mr. Warren Black, M.Sc., P.Geo are both considered independent
"qualified persons" under NI 43-101 and are jointly responsible for
the 2024 Moss Gold Project MRE Update. Mr. Dufresne and Mr. Black
have prepared and approved the scientific and technical information
related to the MRE contained in this news release.
Peter Flindell, P.Geo., MAusIMM, MAIG, Vice
President - Exploration of the Company, and a "qualified person"
under NI 43-101 has also reviewed and approved the scientific and
technical information contained in this news release.
Updated Technical Report
Details of the Moss Gold Project MRE will be
provided in a technical report with an effective date of January
31, 2024, prepared in accordance with NI 43-101 standards, which
will be filed under the Company's SEDAR+ profile within 45 days of
this news release. The Moss Gold Project MRE was prepared by
independent mining consulting firm APEX Geoscience Ltd. in
accordance with the Canadian Institute of Mining, Metallurgy and
Petroleum ("CIM")
"Estimation of Mineral Resources and Mineral Reserves Best Practice
Guidelines" dated November 29, 2019, and the CIM "Definition
Standards for Mineral Resources and Mineral Reserves" dated May 10,
2014.
Results of the Company's Annual General
Meeting
The
Company also announces that all matters proposed at the Annual
General and Special Meeting (the "Meeting") held on January 23,
2024 were approved.
At the
Meeting, shareholders of the Company voted in favour of setting the
number of directors at six (6); as well as electing Galen McNamara,
Brett Richards, Brandon Macdonald, Shawn Khunkhun, Joanna Pearson
and Kyle Hickey as directors.
The
shareholders also approved the re-appointment of Davidson &
Company LLP as the Company's auditors, approved the adoption of a
new omnibus incentive plan (the "Incentive Plan") and provided
disinterested approval ratifying a previous grant of restricted
share units under the new Incentive Plan.
The new
Incentive Plan replaces the existing stock option plan previously
adopted by the Company, and allows for the grant of incentive stock
options, restricted share units and deferred share units to a
maximum of ten percent of the issued and outstanding share capital
from time-to-time.
For
further information regarding the matters presented at the Meeting,
or to review a copy of the new Incentive Plan, readers are
encouraged to review the Company's management proxy circular, a
copy of which is available under the Company's profile on
SEDAR+.
About Goldshore
Goldshore is an emerging junior gold
development company, and owns the
Moss Gold Project located in Ontario. The
Company is led and supported by an
industry-leading management group, board of
directors and advisory personnel. Goldshore is well-positioned and well
financed to advance
the Moss Gold Project through
the next stages of exploration and development.
Neither
the TSXV nor its Regulation Services Provider (as that term is
defined in the policies of the TSXV) accepts responsibility for the
adequacy or accuracy of this release.
For More
Information - Please Contact:
Brett A. Richards
President, Chief Executive Officer and
Director
Goldshore Resources Inc.
P. +1 604
288 4416 M. +1
905 449 1500
E. brichards@goldshoreresources.com
W. www.goldshoreresources.com
Facebook: GoldShoreRes |
Twitter: GoldShoreRes |
LinkedIn: goldshoreres
Cautionary
Note Regarding Forward-Looking Statements
This news release contains statements that
constitute "forward-looking statements." Such forward looking
statements involve known and unknown risks, uncertainties and other
factors that may cause the Company's actual results, performance or
achievements, or developments to differ materially from the
anticipated results, performance or achievements expressed or
implied by such forward-looking statements. Forward looking
statements are statements that are not historical facts and are
generally, but not always, identified by the words "expects,"
"plans," "anticipates," "believes," "intends," "estimates,"
"projects," "potential" and similar expressions, or that events or
conditions "will," "would," "may," "could" or "should"
occur.
Forward-looking statements in this news
release include, among others, statements relating to expectations
regarding the exploration and development of the Project, the
filing of a technical report supporting the MRE, commencement of a
preliminary economic assessment and prefeasibility study, and other
statements that are not historical facts. By their nature,
forward-looking statements involve known and unknown risks,
uncertainties and other factors which may cause our actual results,
performance or achievements, or other future events, to be
materially different from any future results, performance or
achievements expressed or implied by such forward-looking
statements. Such factors and risks include, among others: the
Company may require additional financing from time to time in order
to continue its operations which may not be available when needed
or on acceptable terms and conditions acceptable; compliance with
extensive government regulation; domestic and foreign laws and
regulations could adversely affect the Company's business and
results of operations; the stock markets have experienced
volatility that often has been unrelated to the performance of
companies and these fluctuations may adversely affect the price of
the Company's securities, regardless of its operating performance;
the impact of COVID-19; the ongoing military conflict in Ukraine;
and other risk factors outlined in the Company's public disclosure
documents.
The forward-looking information contained in
this news release represents the expectations of the Company as of
the date of this news release and, accordingly, is subject to
change after such date. Readers should not place undue importance
on forward-looking information and should not rely upon this
information as of any other date. The Company undertakes no
obligation to update these forward-looking statements in the event
that management's beliefs, estimates or opinions, or other factors,
should change.