BKEN – Uplisting To QB Status
Vancouver, Canada -- April 16, 2018 -- InvestorsHub NewsWire --
www.penniesgonewild.com a leading independent micro
cap media portal with an extensive history of providing
unparalleled content for undervalued companies, reports on Bakken
Energy Corp. (OTC Pink: BKEN)
Highlights:
QB Tier
Gold
BKEN may not be at these levels much
longer.
See news, filings and more on Bakken Energy Corp. at https://www.otcmarkets.com/stock/BKEN/profile
Welcome to Orofino Gold Corporation. Orofino Gold Corp.
(ORFG.PK) is a Nevada-based gold producer that focuses on
discovery, acquisition, and expansion of mineral-rich resource
deposits primarily in the Americas. Orofino currently operates
producing mines in the Senderos de Oro area of Colombia, making it
a neighbor of nearby Ventana Gold Corp's proven La Bodega asset and
Greystar Resources Ltd's Angostura project. In addition, Orofino
has rights to other lands in the gold-producing region totaling
over 3,000 hectares as well as an option on a strong portfolio of
other small producers and development/exploration assets in the
region.

OTC QB Tier
The Company hire M&K CPAS PLLC of Houston, Texas to provide
Audited financial statements https://www.prnewswire.com/news-releases/bakken-energy-corp--the-company-announces-plans-to-hire-mk-cpas-pllc-of-houston-texas-to-provide-audited-financial-statements-628816063.html
Rumor on the street is that M&K CPAS PLLC has completed the
audited financial statements. Bakken is reviewing various business
opportunities. Official company news to confirm QB status rumored
to be coming in the coming days.

Gold
2018 Gold Price Forecast and Predictions
Jeff Clark, Senior Precious Metals
Analyst
Most price forecasts aren’t worth more than an umbrella in a
hurricane. There are so many factors, so many ever-changing
variables and dynamics, that even the most educated guess almost
always ends up wrong.
Further, some forecasts base their predictions on one issue.
“Interest rates will rise so gold will fall.” That’s not even an
accurate statement, let alone a sensible prediction (it’s
the real rate that affects gold prices—the rate
minus inflation).
So instead, my gold price forecast for
2018 will look at the primary factors that impact the gold market
to determine if each is likely to push the price higher or lower
this year. I’ll conclude with the probable prices I see based on
those factors, as well as some long-term projections.
The primary factors I think will impact the price of gold this
year are:
- The US Dollar
- Demand for Physical Gold
- Demand for Gold ETFs
- Central Bank Buying
- Activity of Commercial Speculator
- Trading Volumes on the COMEX
- Technical Indicators
- New Mine Supply
- Coming Economic and Monetary Factors
This will be fun, so let’s jump in.
The US Dollar
The US dollar fell 10.5% last year, a significant decline for a
currency and its biggest drop since 2003.
The factors that weighed on the dollar last year are expected to
exert similar pressure again this year. The biggest factor is
perhaps the Trump administration blatantly
stating it wants a weak dollar, primarily to support US
trade.
You probably know that generally speaking, the US dollar is
inversely correlated to gold, so if the dollar falls this year, as
I expect, then the gold price will…

Demand for Physical Gold
Demand for coins and bars was near an all-time low last year.
But the last time that happened it preceded a fury for demand for
metal, with the complacency peaking just before the 2008 financial
crisis.
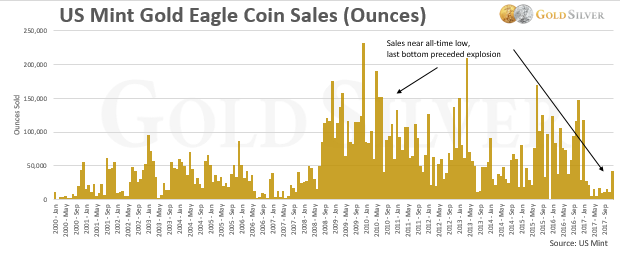
With bullion sales at multi-year lows, it is much more
likely demand rises this year than falls.
Physical demand does not always push the price higher, but it does
support interest in gold, and the greater the interest, the more
likely gold is to…

Demand for Gold ETFs
Gold-backed ETF holdings are now at their highest level since
2013.
Check out the increase in holdings from the top 10 gold ETFs in
the world last year.
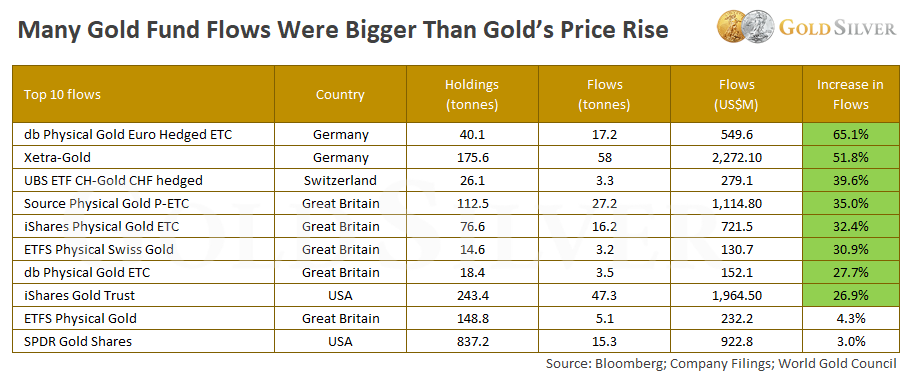
This interest is likely to remain high this year, because the
reasons these investors bought gold—to hedge against overvalued
markets and insure against the increasing possibility of a
crisis—haven’t materialized yet. Continued ETF demand is
likely to push the price of gold…

Central Bank Buying
Central banks around the world hold gold in their reserves. If they
think they need more, they buy more. Look what’s happened since
holdings bottomed in 2007:
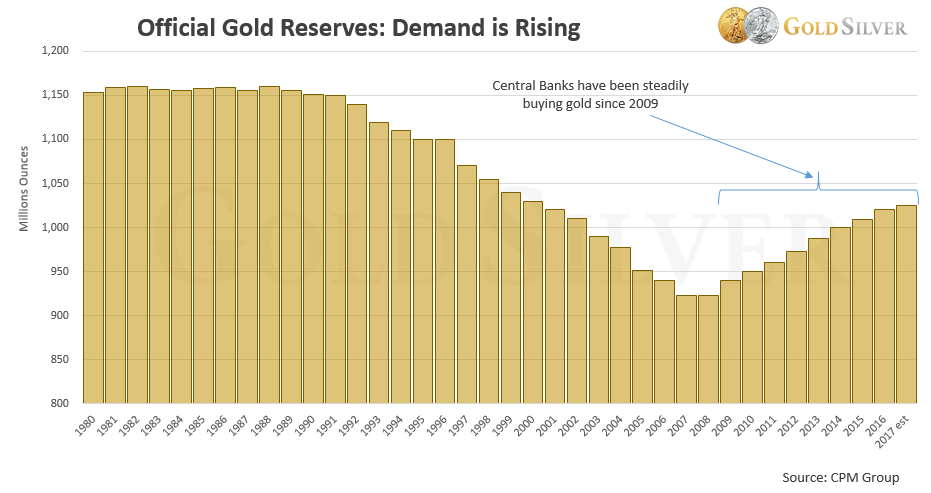
Global central banks have been buying gold at an accelerated pace
for the past 10 years. Based on their recent activity, there is no
reason to believe they will stop. Their continued accumulation is a
source of support for the gold price.
Ongoing central bank buying = a gold price that is likely
to...

Activity of Commercial Speculators
Our friend Nick Laird at Goldchartsrus.com tracks
the “Commitment of Traders” report, which consists of the net
trading positions of commercial, non-commercial, and non-reportable
traders. Here’s the 3-year view
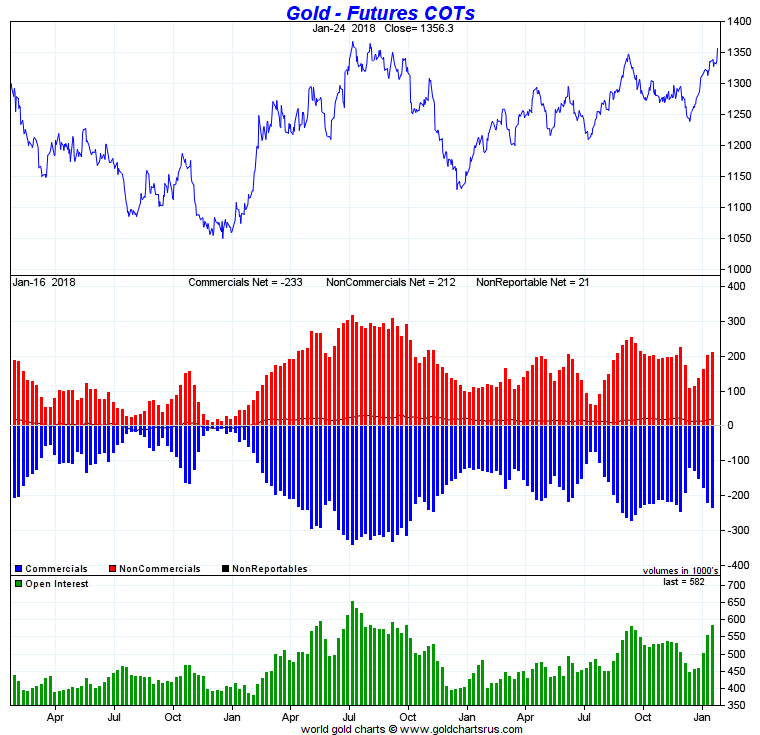
There has been a tug of war between these entities, though you can
see open interest is generally higher now than it was three years
ago, which corresponds to the rising price during that time period.
This data usually isn’t predictive except at extreme readings.
As of January 24, this factor provides no clear indication of
what gold will do this year.
Trading Volumes on the COMEX
Meanwhile, gold-trading volumes on the COMEX have never been
higher:
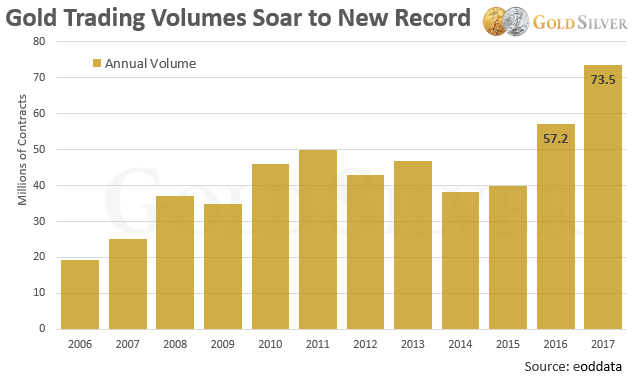
Traders at the world’s largest futures market are buying more gold
contracts than they’re selling, a staunchly bullish
indicator. There’s no indication heightened activity at the
COMEX will stop, and if so the gold price will…

Technical Indicators
While most mainstream investors are ignoring gold, the technical
picture shows the price is coiling, which implies a big move is on
the way.
Our friend Dominick Graziano has amassed a seven-figure
brokerage account from his technical trading. His recent monthly
chart is eye-opening, and note his comments.
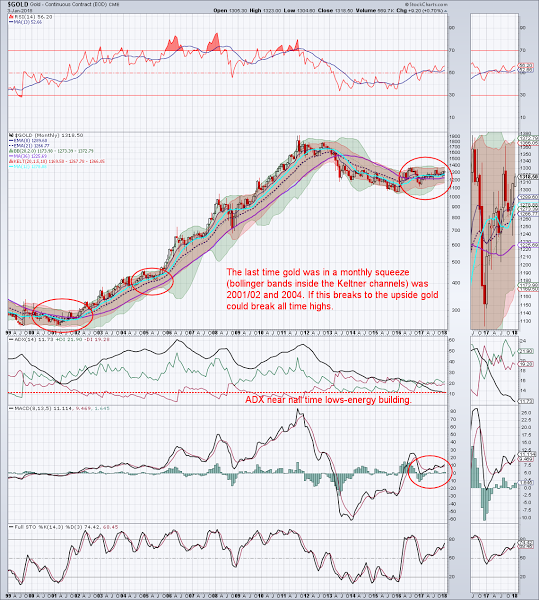
The trading range of the gold price continues to squeeze tighter
and tighter on a monthly basis, a technical sign that implies a
breakout is coming.
You can also see that the ADX (Average Directional Index)
indicator shows gold is building energy. The longer this
consolidation goes on, and the greater the buildup in energy, the
bigger the breakout will be. Dominick says that “long-term
consolidations are the most powerful when they finally break
out.”
The technical picture doesn’t tell us when this breakout will
occur, but as he says a new all-time high could be in the cards if
gold breaks to the upside.
The technical outlook for 2018 says the gold price is more than
likely to…

New Mine Supply
Almost all mining analysts, including yours truly, have been
sounding the alarm about the impending reversal in new gold
supply from mine production. Some reports say it will peak this
year, some say next year, a couple say it already has.
But regardless of the timing, the reality is that new mine
supply is about to reverse and begin a long-term decline. And the
biggest portion of coin and bar sales each year come from new mine
supply.
If demand stays at current levels or rises, and new supply
begins to fall, the gold price will respond to this basic
supply/demand equation and…

Coming Economic and Monetary Factors
All of the above reasons are fine and good, but one of the primary
reasons we’re overweight gold and silver at this point in history
is because of the numerous elevated risks that are present. Mike
discussed his Top 10 Reasons I Buy Gold and
Silver, which all point to a period that he believes will,
sooner or later, propel gold higher.
It is this big-picture backdrop for gold that tells us why
investors should hold physical bullion at this time and why the
price will ultimately end up much higher than it is now.
Here are a couple of these catalysts that could impact the gold
price in 2018:
Asset Bubbles: The bull market in stocks may or may not continue
in 2018, but no trend lasts forever. And given how far the stock
market has come, it’s only prudent to be wary of its bubbly
valuation.
If the Dow tanks or cryptos crater or bond yields soar or real
estate reverses, the resulting fear will push gold…

As the World Gold Council reports, “Should global financial markets
correct, investors could benefit from having an exposure to gold as
it has historically reduced losses during periods of financial
distress.”
Even the conservative World Bank issued a warning in their
January report: “Financial markets are vulnerable to unforeseen
negative news. They appear to be complacent.”
If investors are caught off guard, the fall in financial markets
could be bigger than average and quickly push investors into gold.
And since gold is inversely correlated to most major
asset classes, it is more likely to rise when stock markets
crash.
Inflation: Off the radar to the average Joe is the possibility
that inflation kicks in this year. Check out what’s been reported
in the past 30 days.
- Barron’s: “We expect to see inflation go up in 2018 across
developed markets relative to where it is today with the United
States leading the way.”
- Kiplinger: “Inflation will rise this year.”
- PIMCO: “Global inflation is likely to rise in 2018.”
- World Bank: “There could be faster than expected
inflation…”
- And The Wall Street Journal reported in mid-January
that “Investors Prepare for Inflation.”
This one is rather obvious: if inflation rises this year,
especially more than expected, then gold will:

What Could Push Gold Down
The primary things that could weigh on gold would be the stock
market continuing to soar or interest rates rising more than
expected, with no increase in inflation. If those things
happen and the other catalysts are subdued, then gold is likely
to:

My 2018 Gold Forecast
You can see that in my view most of the factors that impact gold
are expected to push the price higher this year.
Add it all up and my 2018 gold price forecast is:
- Minimum High: $1,420
- Potential High With No Crisis: $1,500 to $1,600
- Potential High With Major Crisis: $2,000 (new all-time
high)
- Likelihood the $1,050 Low (12-17-15) for This Cycle Is in:
80%
- Likelihood Gold Is Also Higher in 2019: 90%
- Potential 5-Year High: $3,000 to $10,000
The message from this analysis is that even if gold rises only
modestly this year, it has rarely been more important to own.
The strategy is clear: 2018 is likely to be the last year to buy
gold and silver at current levels, so dips in price should be
bought. https://goldsilver.com/blog/gold-price-forecast-predictions/
Conclusion
BKEN may not be at these levels much
longer.
See news, filings and more on Bakken
Energy Corp. at https://www.otcmarkets.com/stock/BKEN/profile
Other News:
WRFX-
WorldFlix Secures up to $16 Million in Carden Capital Deal and
Hosts Facebook Live CEO Chat
Company has seen a major surged do to a
$16 Million-dollar deal.
GRCV-
Grand Capital Ventures, Inc., Company soar on Friday not on news
but instead on changes that are coming to market makers like BMIC
and others.
MVES-
The Movie Studio, Inc. The company starting reversing after having
a panic sell-off. Recent changes on note restrictions can benefit
the company to continue its up trend.
About www.penniesgonewild.com
www.penniesgonewild.com is a
leading independent micro cap media portal with an extensive
history of providing unparalleled content for undervalued
companies. www.penniesgonewild.com focus on micro cap stocks that Wall Street stock
traders have ignored or haven’t found out about yet. We look for
strong management, innovation, strategy, execution, and the overall
potential for long- term growth. We are well known for discovering
undervalued companies. Read full disclosure at https://penniesgonewild.com/disclosure
All information contained herein as well
as on the www.penniesgonewild.com website is obtained from sources believed to be
reliable but not guaranteed to be accurate or all-inclusive. All
material is for informational purposes only, is only the opinion
of www.penniesgonewild.com and should not be construed as an offer or
solicitation to buy or sell securities. The information may include
certain forward-looking statements, which may be affected by
unforeseen circumstances and / or certain risks.
Please consult an investment
professional before investing in anything viewed within.
www.penniesgonewild.com has not been compensated for
this article. We may or may not have any shares in any companies
profiled by www.penniesgonewild.com
CONTACT:
Company: www.penniesgonewild.com
Contact Email: penniesgonewild@aol.com
SOURCE: www.penniesgonewild.com
Twitter: https://twitter.com/WildPennies
Bakken Energy (CE) (USOTC:BKEN)
Historical Stock Chart
Von Dez 2024 bis Jan 2025

Bakken Energy (CE) (USOTC:BKEN)
Historical Stock Chart
Von Jan 2024 bis Jan 2025
