Stella-Jones Reports 2013 Fourth Quarter and Annual Results
Thirteenth consecutive year of growth in net income
MONTREAL, QUEBEC--(Marketwired - Mar 14, 2014) -
- Sales of $970.1 million, up 35.2% from $717.5 million last
year
- 26.6% growth in operating income to $138.7 million, versus
$109.6 million in 2012
- Net income up 26.6% to $92.5 million, compared to $73.1 million
last year
- Diluted EPS of $1.34 versus $1.13 a year ago
Stella-Jones Inc. (TSX:SJ) ("Stella-Jones" or the "Company")
today announced financial results for its fourth quarter and fiscal
year ended December 31, 2013.
"2013 marked the thirteenth consecutive year of growth for
Stella-Jones, as the Company further benefited from its proven
expansion strategy. The ongoing growth of our continental network
has resulted in improved efficiency of our operations and increased
confidence of our customers. By virtue of recent acquisitions and
key strategic decisions, Stella-Jones has not only become larger,
it has become a stronger and more efficient organization, as well
as a lasting source of value creation for its shareholders," said
Brian McManus, President and Chief Executive Officer.
| Financial highlights |
Quarters ended Dec. 31, |
Years ended Dec. 31, |
| (in thousands of Canadian dollars, except per share
data) |
2013 |
2012 |
2013 |
2012 |
| Sales |
211,862 |
159,345 |
970,149 |
717,494 |
| Operating income |
29,519 |
21,127 |
138,699 |
109,596 |
| Net income for the period |
19,690 |
16,546 |
92,536 |
73,070 |
|
|
Per share - basic ($) |
0.29 |
0.25 |
1.35 |
1.14 |
|
|
Per share - diluted ($) |
0.29 |
0.25 |
1.34 |
1.13 |
| Cash flows from operating activities before changes in
non-cash working capital components and interest and income taxes
paid |
34,607 |
22,363 |
160,631 |
120,797 |
| Cash flows provided by operating activities |
23,883 |
21,086 |
104,218 |
28,516 |
| Weighted average shares outstanding (basic, in
'000s) |
68,693 |
65,548 |
68,681 |
64,312 |
2013 RESULTS
Sales reached $970.1 million, up 35.2% over last year's sales of
$717.5 million. The operating facilities acquired from McFarland
Cascade Holdings, Inc. ("McFarland") on November 30, 2012
contributed additional sales of $275.4 million over an eleven-month
period in 2013, net of production transferred from other
Stella-Jones facilities, while the assets acquired from The Pacific
Wood Preserving Companiesâ ("PWP") on November 15, 2013 generated
sales of approximately $4.1 million in the fourth quarter. The
conversion effect from fluctuations in the value of the Canadian
dollar, Stella-Jones' reporting currency, versus the U.S. dollar,
increased the value of U.S. dollar denominated sales by about $12.9
million when compared with the previous year. Excluding these
factors, sales decreased approximately $39.8 million due to a
timing effect on railway tie sales resulting from the transition of
a Class 1 railroad customer from a treating services only ("TSO")
program to a black tie ("Black Tie") program and to the
year-over-year timing difference for certain utility pole
orders.
Railway tie sales amounted to $394.0 million, compared with
$404.5 million last year. This slight decrease reflects the
transition of a Class 1 railroad customer from a TSO program to a
Black Tie program, which had a timing effect of $30.9 million on
2013 sales. Excluding this factor, railway tie sales rose
approximately 5.0%. This transition is mostly complete and should
have a minimal impact on results in the first quarter of 2014.
Thereafter, annualized sales to that customer should be greater
than the aforementioned amount due to more value added under a
Black Tie program. Sales of utility poles totalled $405.8 million,
up from $218.5 million in 2012. This increase is essentially
attributable to additional utility pole sales of $197.9 million
from the McFarland operations. Sales of residential lumber reached
$112.3 million, up from $35.5 million a year earlier as a result of
additional residential lumber sales of $73.8 million from the
McFarland operations. Finally, industrial product sales were $58.1
million, compared with $59.0 million a year earlier.
Operating income rose 26.6% to $138.7 million, or 14.3% of
sales, versus $109.6 million, or 15.3% of sales, last year. While
the increase in monetary terms mainly reflects the addition of the
McFarland operations, the reduction as a percentage of sales stems
from a less favourable product mix and McFarland's lower margins at
the beginning of the year. Reflecting a successful integration,
McFarland's margins progressively improved during the
year.
Net income for the year increased 26.6% to $92.5 million or
$1.34 per share, fully diluted, compared with $73.1 million or
$1.13 per share, fully diluted, in 2012. Cash flows from operating
activities before changes in non-cash working capital components
and interest and income taxes paid rose 33.0% to $160.6 million.
Cash flow provided by operating activities was $104.2 million
compared to $28.5 million in 2012.
FOURTH QUARTER RESULTS
Sales amounted to $211.9 million, up 33.0% from $159.3 million
for the same period a year earlier. The McFarland operations
contributed additional sales of $49.3 million, net of production
transferred from other Stella-Jones facilities, over a two-month
period, while assets acquired from PWP generated sales of $4.1
million. The year-over-year conversion effect from fluctuations in
the value of the Canadian dollar, versus the U.S. dollar, increased
the value of U.S. dollar denominated sales by $5.8 million.
Excluding these factors, sales decreased approximately $6.7
million, as the year-over-year timing difference for certain
utility pole orders and the timing effect on sales from the program
transition of a Class 1 railroad customer more than offset solid
industry demand for railway ties.
Sales of railway ties reached $78.3 million in 2013, versus
$73.7 million in 2012. This increase reflects solid market demand,
including higher year-over-year advanced deliveries, and the PWP
acquisition, partially offset by a timing effect of $13.4 million
from the transition of a Class 1 railroad customer to a Black Tie
program. Utility pole sales rose $36.9 million to $107.1 million
due to a $41.3 million additional net contribution from the
McFarland operations over a two-month period and the PWP
acquisition. Excluding these factors, sales declined due to the
year-over-year timing difference for certain orders. Residential
lumber sales reached $13.8 million, up from $5.1 million last year,
mainly due to additional sales of $8.1 million from the McFarland
operations. Finally, industrial product sales were $12.7 million,
versus $10.4 million a year ago, as a result of higher sales of
industrial timber for railway bridges.
Operating income was $29.5 million, or 13.9% of sales, versus
$21.1 million, or 13.3% of sales, last year. 2013 results include
acquisition costs of $1.2 million related to the PWP transaction,
while last year's results included acquisition costs of $2.4
million related to the McFarland transaction. Excluding these
elements, operating income for the fourth quarter of 2013 was $30.7
million, or 14.5% of sales, compared with $23.5 million, or 14.8%
of sales, a year earlier. The variation as a percentage of sales
reflects a less favourable year-over-year product mix, partially
offset by greater efficiencies throughout the Company's plant
network.
Net income for the period rose 19.0% to $19.7 million, or $0.29
per share, fully diluted, compared with $16.5 million, or $0.25 per
share, fully diluted, last year. Cash flows from operating
activities before changes in non-cash working capital components
and interest and income taxes paid reached $34.6 million, up 54.8%
from $22.4 million a year earlier.
SOLID FINANCIAL POSITION
As at December 31, 2013, the Company's long-term debt, including
the current portion, stood at $372.9 million compared with $349.6
million at the end of the previous year. The increase essentially
reflects the additional long-term debt required to finance the
acquisition of PWP and the effect of local currency translation on
U.S. dollar denominated long-term debt. Despite this acquisition
completed shortly before year end, Stella-Jones total debt to total
capitalization improved to 0.39:1 as at December 31, 2013, versus
0.44:1 a year earlier.
QUARTERLY DIVIDEND OF $0.07 PER SHARE
On March 13, 2014, the Board of Directors declared a quarterly
dividend of $0.07 per common share payable on April 30, 2014 to
shareholders of record at the close of business on April 2,
2014.
OUTLOOK
"As the North American economy continues to strengthen,
demand for our core products should remain healthy in 2014. While a
stronger economy could result in a tighter market for untreated
railway ties and utility poles, as demand for other wood-based
products also increases, we believe our inventory position and the
strength of our procurement network should allow Stella-Jones to
meet demand at the most optimal cost. The integration of the PWP
assets will be a key focus in the year ahead. The operating
efficiencies we expect to achieve should further strengthen our
market penetration and status as a leading provider of treated wood
products in our core categories," concluded Mr. McManus.
CONFERENCE CALL
Stella-Jones will hold a conference call to discuss these
results on March 14, 2014, at 10:00 AM Eastern Time. Interested
parties can join the call by dialing 647-427-7450 (Toronto or
overseas) or 1-888-231-8191 (elsewhere in North America). Parties
unable to call in at this time may access a tape recording of the
meeting by calling 1-855-859-2056 and entering the passcode
69145418. This tape recording will be available on Friday, March
14, 2014 as of 1:00 PM Eastern Time until 11:59 PM Eastern Time on
Friday, March 21, 2014.
NON-IFRS FINANCIAL MEASURES
Operating income and cash flow from operating activities before
changes in non-cash working capital components and interest and
income tax paid are financial measures not prescribed by IFRS and
are not likely to be comparable to similar measures presented by
other issuers. Management considers these non-IFRS measures to be
useful information to assist knowledgeable investors regarding the
Company's financial condition and results of operations as they
provide additional measures of its performance.
ABOUT STELLA-JONES
Stella-Jones Inc. (TSX:SJ) is a leading producer and marketer of
pressure treated wood products. The Company supplies North
America's railroad operators with railway ties and timbers, and the
continent's electrical utilities and telecommunication companies
with utility poles. Stella-Jones also provides residential lumber
to retailers and wholesalers for outdoor applications, as well as
industrial products for construction and marine applications. The
Company's common shares are listed on the Toronto Stock
Exchange.
Except for historical information provided herein, this press
release may contain information and statements of a forward-looking
nature concerning the future performance of the Company. These
statements are based on suppositions and uncertainties as well as
on management's best possible evaluation of future events. Such
factors may include, without excluding other considerations,
fluctuations in quarterly results, evolution in customer demand for
the Company's products and services, the impact of price pressures
exerted by competitors, the ability of the Company to raise the
capital required for acquisitions, and general market trends or
economic changes. As a result, readers are advised that actual
results may differ from expected results.
Note to readers:
Condensed interim unaudited consolidated financial statements for
the fourth quarter and year ended December 31, 2013 are available
on Stella-Jones' website at www.stella-jones.com
Source:Stella-Jones Inc.Eric Vachon, CPA, CASenior
Vice-President and Chief Financial Officer(514)
940-3903evachon@stella-jones.comMartin Goulet, CFAMaisonBrison
Communications(514) 731-0000martin@maisonbrison.com
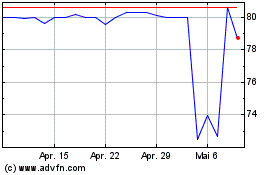
Stella Jones (TSX:SJ)
Historical Stock Chart
Von Dez 2024 bis Jan 2025

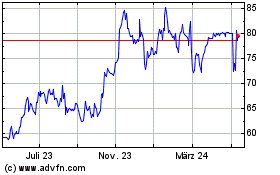
Stella Jones (TSX:SJ)
Historical Stock Chart
Von Jan 2024 bis Jan 2025
