Fennec Pharmaceuticals Announces Third Quarter 2022 Financial Results and Provides Business Update
11 November 2022 - 1:10PM

Fennec Pharmaceuticals Inc. (NASDAQ:FENC; TSX: FRX), a commercial
stage specialty pharmaceutical company focused on the development
of PEDMARK® (sodium thiosulfate injection) to reduce the risk
of ototoxicity associated with cisplatin in pediatric patients one
month of age and older with localized, non-metastatic solid tumors
today reported its financial results for the fiscal quarter ended
September 30, 2022 and provided a business update.
“This was an important quarter for Fennec with
the FDA approval of PEDMARK® and the successful buildout of our
commercial infrastructure leading to the recent U.S. commercial
launch of PEDMARK. In addition, we successfully completed a $25
million financing, which we believe well positions the Company for
the launch of PEDMARK,” said Rosty Raykov, chief executive officer
of Fennec Pharmaceuticals. “PEDMARK provides the first and only
FDA-approved treatment specifically designed to help protect
hearing in children and young adults after receiving cisplatin. We
remain focused on continuing our engagement with healthcare
providers and supporting pediatric patient access to this
breakthrough therapy.”
Financial Results for the Third Quarter
2022
- Cash Position
– Cash and cash equivalents were $29.8 million at
September 30, 2022. The increase in cash and cash equivalents
between September 30, 2022, and December 31, 2021, is the result of
cash inflow from the Petrichor financing offset by cash to pay off
the Bridge Bank loan and expenditures related to the commercial
readiness activities for PEDMARK® and general and administrative
expenses.
- Research and Development
(R&D) Expenses – R&D expenses decreased
by $0.4 million for the three months ended September 30, 2022,
compared to the same period in 2021. The Company’s research and
development activities during the quarter decreased as the
Company’s efforts on a year-over-year basis were more focused on
commercial readiness.
- General and Administrative
(G&A) Expenses – General and administrative
expenses increased by $4.1 million over same period in 2021. The
increase in general and administrative expenses over the same
period in 2021 reflects increased expenses related to commercial
readiness activities, including increased headcount, non-cash
equity compensation for employees and increased legal
expenses.
- Net Loss
– Net loss for the three months ended September 30,
2022 was $8.1 million ($0.31 per share), compared to $4.2 million
($0.16 per share) for the same period in 2021.
Financial Update
The selected financial data presented below is
derived from our unaudited condensed consolidated financial
statements, which were prepared in accordance with U.S. generally
accepted accounting principles. The complete unaudited condensed
consolidated financial statements for the period ended September
30, 2022 and management's discussion and analysis of financial
condition and results of operations will be available via
www.sec.gov and www.sedar.com. All values are presented in
thousands unless otherwise noted.
Unaudited Condensed ConsolidatedStatements of
Operations:(U.S. Dollars in thousands except per share amounts)
| |
|
|
|
|
|
| |
Three Months Ended |
| |
September 30, |
|
September 30, |
| |
2022 |
|
2021 |
| |
|
|
|
|
|
|
Revenue |
$ |
— |
|
|
$ |
— |
|
| |
|
|
|
|
|
| Operating
expenses: |
|
|
|
|
|
|
Research and development |
|
846 |
|
|
|
1,242 |
|
|
General and administrative |
|
7,053 |
|
|
|
2,931 |
|
| Total operating
expenses |
|
7,899 |
|
|
|
4,173 |
|
| Loss from
operations |
|
(7,899 |
) |
|
|
(4,173 |
) |
| |
|
|
|
|
|
| Other
(expense)/income |
|
|
|
|
|
|
Foreign currency transaction (loss)/gain |
|
(4 |
) |
|
|
(1 |
) |
|
Amortization expense |
|
(64 |
) |
|
|
(8 |
) |
|
Unrealized (loss)/gain on securities |
|
(27 |
) |
|
|
39 |
|
|
Interest income |
|
24 |
|
|
|
13 |
|
|
Interest expense |
|
(119 |
) |
|
|
(55 |
) |
|
Total other (expense)/income |
|
(190 |
) |
|
|
(12 |
) |
| |
|
|
|
|
|
| Net loss |
$ |
(8,089 |
) |
|
$ |
(4,185 |
) |
| |
|
|
|
|
|
| Basic net loss per
common share |
$ |
(0.31 |
) |
|
$ |
(0.16 |
) |
| Diluted net loss per
common share |
$ |
(0.31 |
) |
|
$ |
(0.16 |
) |
| Weighted-average
number of common shares outstanding basic |
|
26,108 |
|
|
|
26,007 |
|
| Weighted-average
number of common shares outstanding diluted |
|
26,108 |
|
|
|
26,007 |
|
Fennec Pharmaceuticals Inc.Balance Sheets(U.S.
Dollars in thousands)
| |
|
|
|
|
|
| |
|
September 30, 2022 |
|
|
December 31, |
| |
|
(Unaudited) |
|
|
2021 |
| Assets |
|
|
|
|
|
| Current
assets |
|
|
|
|
|
|
Cash and cash equivalents |
$ |
29,752 |
|
|
$ |
21,100 |
|
| Prepaid expenses |
|
278 |
|
|
|
1,034 |
|
| Other current assets |
|
123 |
|
|
|
253 |
|
| Total current
assets |
|
30,153 |
|
|
|
22,387 |
|
| |
|
|
|
|
|
| Non-current
assets |
|
|
|
|
|
| Deferred issuance cost, net of
amortization |
|
264 |
|
|
|
27 |
|
| Total non-current
assets |
|
264 |
|
|
|
27 |
|
| Total
assets |
$ |
30,417 |
|
|
$ |
22,414 |
|
| |
|
|
|
|
|
| Liabilities and
Stockholders’ Equity |
|
|
|
|
|
| Current
liabilities: |
|
|
|
|
|
| Accounts payable |
$ |
2,533 |
|
|
$ |
777 |
|
| Accrued liabilities |
|
394 |
|
|
|
877 |
|
| Total current
liabilities |
|
2,927 |
|
|
|
1,654 |
|
| |
|
|
|
|
|
| Long-term
liabilities |
|
|
|
|
|
| Term loan |
|
25,000 |
|
|
|
5,000 |
|
| Debt discount |
|
(312 |
) |
|
|
(12 |
) |
| Total long-term
liabilities |
|
24,688 |
|
|
|
4,988 |
|
| Total
liabilities |
|
27,615 |
|
|
|
6,642 |
|
| |
|
|
|
|
|
| Stockholders’ equity: |
|
|
|
|
|
| Common stock, no par value;
unlimited shares authorized; 26,238 shares issued |
|
141,309 |
|
|
|
140,801 |
|
| and outstanding (2021 -
26,014) |
|
|
|
|
|
| Additional paid-in
capital |
|
56,593 |
|
|
|
53,214 |
|
| Accumulated deficit |
|
(196,343 |
) |
|
|
(179,486 |
) |
| Accumulated other
comprehensive income |
|
1,243 |
|
|
|
1,243 |
|
| Total stockholders’
equity |
|
2,802 |
|
|
|
15,772 |
|
| Total liabilities and
stockholders’ equity |
$ |
30,417 |
|
|
$ |
22,414 |
|
Working Capital
| |
|
|
|
|
|
| |
|
|
|
|
|
| |
|
As of |
|
|
As of |
| Selected Asset and Liability
Data (thousands): |
|
September 30, 2022 |
|
|
December 31, 2021 |
|
Cash and equivalents |
$ |
29,752 |
|
|
$ |
21,100 |
|
| Other current assets |
|
401 |
|
|
|
1,287 |
|
| Current liabilities |
|
2,927 |
|
|
|
1,654 |
|
| Working capital (1) |
$ |
27,226 |
|
|
$ |
20,733 |
|
| (1) [Current assets – current
liabilities] |
|
|
|
|
|
| |
|
|
|
|
|
| Selected Equity: |
|
|
|
|
|
| Common stock and additional
paid in capital |
|
197,902 |
|
|
|
194,015 |
|
| Accumulated deficit |
|
(196,343 |
) |
|
|
(179,486 |
) |
| Shareholders’ equity |
|
2,802 |
|
|
|
15,772 |
|
About Fennec
Pharmaceuticals
Fennec Pharmaceuticals Inc. is a specialty
pharmaceutical company focused on the development and
commercialization of PEDMARK® to reduce the risk of
platinum-induced ototoxicity in pediatric patients. Further,
PEDMARK received FDA approval in September 2022 and has received
Orphan Drug Designation in the U.S. Fennec has a license agreement
with Oregon Health and Science University (OHSU) for exclusive
worldwide license rights to intellectual property directed to
sodium thiosulfate and its use for chemoprotection, including the
reduction of risk of ototoxicity induced by platinum chemotherapy,
in humans. For more information, please
visit www.fennecpharma.com.
Forward Looking Statements
Except for historical information described in
this press release, all other statements are forward-looking. Words
such as “believe,” “anticipate,” “plan,” “expect,” “estimate,”
“intend,” “may,” “will,” or the negative of those terms, and
similar expressions, are intended to identify forward-looking
statements. These forward-looking statements include statements
about our business strategy, timeline, and other goals, plans and
prospects, including our commercialization plans respecting
PEDMARK®, the market opportunity for and market impact of PEDMARK®,
its potential impact on patients and anticipated benefits
associated with its use, and potential access to further funding
after the date of this release. Forward-looking statements are
subject to certain risks and uncertainties inherent in the
Company’s business that could cause actual results to vary,
including the risks and uncertainties that regulatory and guideline
developments may change, scientific data and/or manufacturing
capabilities may not be sufficient to meet regulatory standards or
receipt of required regulatory clearances or approvals, clinical
results may not be replicated in actual patient settings,
unforeseen global instability, including political instability, or
instability from an outbreak of pandemic or contagious disease,
such as the novel coronavirus (COVID-19), or surrounding the
duration and severity of an outbreak, protection offered by the
Company’s patents and patent applications may be challenged,
invalidated or circumvented by its competitors, the available
market for the Company’s products will not be as large as expected,
the Company’s products will not be able to penetrate one or more
targeted markets, revenues will not be sufficient to fund further
development and clinical studies, our ability to obtain necessary
capital when needed on acceptable terms or at all, the Company may
not meet its future capital requirements in different countries and
municipalities, and other risks detailed from time to time in the
Company’s filings with the Securities and Exchange Commission
including its Annual Report on Form 10-K for the year ended
December 31, 2021. Fennec disclaims any obligation to update these
forward-looking statements except as required by law.
For a more detailed discussion of related risk
factors, please refer to our public filings available at
www.sec.gov and www.sedar.com.
PEDMARK® and Fennec® are registered trademarks
of Fennec Pharmaceuticals Inc.
©2022 Fennec Pharmaceuticals Inc. All rights
reserved.
For further information, please contact:
Investors:Robert AndradeChief Financial
OfficerFennec Pharmaceuticals Inc.(919) 246-5299
Media:Elixir Health Public RelationsLindsay
Rocco(862) 596-1304lrocco@elixirhealthpr.com
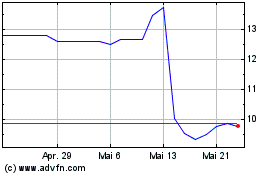
Fennec Pharmaceuticals (TSX:FRX)
Historical Stock Chart
Von Dez 2024 bis Jan 2025

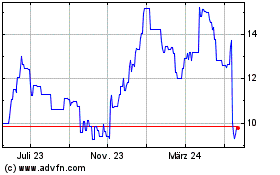
Fennec Pharmaceuticals (TSX:FRX)
Historical Stock Chart
Von Jan 2024 bis Jan 2025
