Enterprise Group, Inc. (“Enterprise,” or “the Company”) (TSX:E), a
consolidator of services to the energy sector; focused primarily on
infrastructure services and specialized equipment rental, today
released its
2017 Corporate Update from CEO
Leonard D. Jaroszuk.
Activity levels significantly increased
over 2017
As the Company looks ahead to what is shaping up
to be an exceptional 2018, it is important to note how we got here.
Surveys have shown that serious investors look at management as a
main measure of purchase decisions. Given Enterprise’s corporate
actions to deal with the resource downturn that began in 2014-15,
management not only took decisive action, but built a company that
is now leaner and stronger.
- Strict cost controls; including reduced work weeks and rotating
schedules.
- Able to maintain service levels while improving margins.
- Vigilant to strategic sales, M&A, JV and other partnership
opportunities
- Expand and diversify smaller client base to mitigate risk
- Company returned to profitability Q3/17
- Positive cash flow over the entire course of the downturn
- Debt reduction through the downturn from $54m at Dec 31st, 2014
to $22.6m at Sept 30th, 2017
Probably most impressive is that E shares,
currently trading at $0.33 have a solid breakup of approximately
$0.85 cents.
Further, as a result of the Company’s improved
financial metrics, our reduced debt, which management looks to
reduce further, gives not only strength, but that most important
corporate characteristics: Options. To grow, to acquire or to
expand operations and influence in current markets and beyond.
It’s Important to Have Exceptional Business
partners.
Our savvy and experienced management team
includes the highly dedicated folks at our subsidiary partners.
Their input and expertise ensures Enterprise realizes its vision
and remain key to our growth and consistent increase in shareholder
value.
The social and economic benefits of
infrastructure, whether it is soldering a tiny motherboard to a
control panel or building a five-level traffic interchange in Tokyo
should not be discounted by investors. Having grown the Company
through the 2015-2017 resource downturn, in which we were unfairly
painted with the ‘low oil price’ brush, we are closing many
substantial new contracts and corporate growth plans are aggressive
and robust.
Management Actions Drive Numbers that Prove the
Point
Investors’ need look no further than E’s
recent Q3 numbers. In all of
2017, as with entire period since the downturn, Enterprise has been
cashflow positive. In Q3 2017, the Company returned to
profitability and is optimistic for 2018.
Enterprise is not the same Company that went
into the 2015 resource downturn.
Through strategic plans including asset sales,
ongoing cost cutting and judicious business decisions we are
leaner, more pivotal and have added diversity to our client base.
With all of these initiatives, the Company mitigates the risk of
dealing with a limited number of large companies: And consistently
adding to shareholder value.
The reality is that our business mix of
providing specialized industrial rentals and infrastructure
solutions and technologies gives Enterprise the flexibility to meet
and more often than not exceed customers’ requirements.
The fact that we also design and build specialty
equipment for our clients—15 patents in place with more
coming—means that we can be immediately responsive and relevant to
address our private or Government customers’ unique needs, whether
resource-centric or straight public infrastructure.
We are always on the lookout for accretive
assets that complement or expand our current businesses.
Bottom Line? Shares up 23% YTD 2017. Several Options
Developing for 2018 Growth
- Revenue for the nine months ended September 30, 2017, of
$26,989,358 increased by $6,592,419 or 32% compared to the prior
period.
- YTD Margins increased to 29%
- YTD EBITDA increased to $4.5 million from $2.2 million for same
period 2016
|
Consolidated: |
Three months September 30,
2017 |
Three months September 30, 2016
restated (2)(3) |
Nine months September 30,
2017 |
Nine months September 30, 2016
restated (2)(3) |
| Revenue |
$ 11,039,666 |
|
$6,551,285 |
|
$26,989,358 |
|
$20,396,939 |
|
| Gross margin |
$3,184,050 |
|
$1,507,420 |
|
$6,653,631 |
|
$4,542,340 |
|
| Gross margin % |
|
29% |
|
|
23 |
% |
|
25 |
% |
|
22 |
% |
| EBITDA (1) |
$2,605,947 |
|
$796,499 |
|
$4,473,939 |
|
$2,241,134 |
|
| Net income (loss) and
comprehensive income (loss) |
$328,933 |
|
$581,816 |
|
$(1,308,998 |
) |
$(3,244,576 |
) |
| EPS |
$0.01 |
|
$0.01 |
|
$(0.02 |
) |
$(0.06 |
) |
- Identified and defined under “Non-IFRS Measures”.
- In July 2016, the Company closed a transaction to divest
substantially all the assets of TCB. The net operations of TCB,
including the prior period, are presented as a single amount in the
consolidated statements of loss and comprehensive loss.
- In December 2016, the Company decided to cease all operations
relating to single pass tunneling. The net operations of this line
of business, including the prior period, are presented as a single
amount in the consolidated statements of loss and comprehensive
loss.
On a personal note (as well as our Management
team), I would like to thank our shareholders for the support they
have shown as we transition from what was a challenging period to
what we believe is an extended period of exceptional growth
potential.
About Enterprise Group, Inc.Enterprise Group,
Inc. is a consolidator of construction services companies operating
in the energy, utility and transportation infrastructure
industries. The Company’s focus is primarily construction services
and specialized equipment rental. The Company’s strategy is to
acquire complementary service companies in Western Canada,
consolidating capital, management, and human resources to support
continued growth. More information is available at the Company’s
website www.enterprisegrp.ca. Corporate filings can be found
on www.sedar.com
For questions or additional information,
please contact: Leonard Jaroszuk: President & CEO, or
Desmond O’Kell: Senior Vice-President contact@enterprisegrp.ca
780-418-4400
Forward Looking InformationCertain statements
contained in this news release constitute forward-looking
information. These statements relate to future events or the
Company’s future performance. The use of any of the words "could",
"expect", "believe", "will", "projected", "estimated" and similar
expressions and statements relating to matters that are not
historical facts are intended to identify forward-looking
information and are based on the Company's current belief or
assumptions as to the outcome and timing of such future events.
Actual future results may differ materially. The Company's Annual
Information Form and other documents filed with securities
regulatory authorities (accessible through the SEDAR website
www.sedar.com) describe the risks, material assumptions and other
factors that could influence actual results and which are
incorporated herein by reference. The Company disclaims any
intention or obligation to publicly update or revise any
forward-looking information, whether as a result of new
information, future events or otherwise, except as may be expressly
required by applicable securities laws.
Non-IFRS MeasuresThe Company uses International
Financial Reporting Standards (“IFRS”). EBITDAS is not a
measure that has any standardized meaning prescribed by IFRS and is
therefore referred to as a non-IFRS measure. This news
release contains references to EBITDAS. This non-IFRS measure
used by the Company may not be comparable to a similar measure used
by other companies. Management believes that in addition to
net income, EBITDAS is a useful supplemental measure as it provides
an indication of the results generated by the Company’s principal
business activities prior to consideration of how those activities
are financed or how the results are taxed. EBITDAS is
calculated as net income excluding depreciation, amortization,
interest, taxes and stock based compensation.
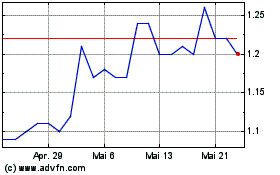
Enterprise (TSX:E)
Historical Stock Chart
Von Dez 2024 bis Jan 2025

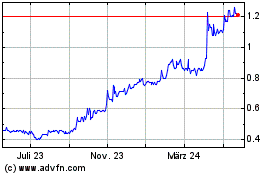
Enterprise (TSX:E)
Historical Stock Chart
Von Jan 2024 bis Jan 2025
