Aberdeen Reports Shareholders' Equity of $0.58 Per Share and Financial Results for Third Quarter Ended October 31, 2013
17 Dezember 2013 - 12:00PM
Marketwired Canada
ABERDEEN INTERNATIONAL INC. ("Aberdeen", or the "Company") (TSX:AAB) has
released its financial results for the third quarter of 2014, ended October 31,
2013. For more information please see the Company's Condensed Interim Financial
Statements and Management's Discussion and Analysis ("MD&A") posted on SEDAR at
www.sedar.com.


As at October 31, 2013, Aberdeen's Shareholders' Equity (or Net Asset Value,
"NAV") was $49.5 million, or $0.58 per share. Aberdeen's shareholders' equity
decreased by $2.3 million from $51.8 million at the end of Q2 2014. The decrease
in shareholders' equity was largely due to the performance of Aberdeen's equity
investment portfolio in the third quarter, which had a total investment loss of
$2.3 million for the quarter. In the third quarter of 2014, the stock market
performance for small capitalization mining and resource stocks continued to be
weak. On a year-over-year basis, Aberdeen's shareholders' equity decreased by
$24.4 million. Note that the reference to shareholders' equity is similar to
previous references to Net Asset Value or "NAV" by Aberdeen.


                                 October 31, 2013           January 31, 2013

Shares outstanding                     85,449,422                 85,994,602

                                   $     $/Shares             $     $/Shares
                         ---------------------------------------------------

Cash on hand               1,176,224         0.01 10,417,577(i)         0.12


Investments
  Publicly traded         17,654,947        0.207    29,844,393        0.347
  Private                 20,067,856        0.235    21,039,834        0.245
  Non-trading warrants
    Intrinsic value                -            -     1,032,114        0.012
    Option value             329,433        0.004     1,415,665        0.016
                         ---------------------------------------------------
                             329,433        0.004     2,447,779        0.028
                         ---------------------------------------------------
Portfolio Investments     38,052,236        0.445    53,332,006        0.620

Loans / preferred shares   8,421,625        0.099     6,116,040        0.071
                         ---------------------------------------------------

Total                     47,650,085        0.558    69,865,623        0.812
                         ---------------------------------------------------

(i) Includes cash from trades made at the end of January 2013 but settled in
February 2013.

                                 October 31, 2012

Shares outstanding                     86,272,302

                                   $     $/Shares
                         ------------------------

Cash on hand               1,118,673         0.01


Investments
  Publicly traded         31,082,470        0.360
  Private                 13,831,781        0.160
  Non-trading warrants
    Intrinsic value          100,650        0.001
    Option value             841,105        0.010
                         ------------------------
                             941,755        0.011
                         ------------------------
Portfolio Investments     45,856,006        0.532

Loans / preferred shares  28,310,109        0.328
                         ------------------------

Total                     75,284,788        0.873
                         ------------------------

(i) Includes cash from trades made at the end of
January 2013 but settled in February 2013.


Aberdeen reported net earnings of $(2.5) million or $(0.03) per basic share for
the three months ended October 31, 2013 on total revenue of $(1.9) million.
Revenue was comprised of $(2.3) million from net investment losses and $0.4
million from interest and dividend income. For the three months ended October
31, 2012, Aberdeen reported net earnings of $3.8 million or $0.04 per basic
share on total revenue of $6.1 million ($5.6 million from net investment gains
and $0.5 million from interest and dividend income and advisory service fees).


For the nine months ended October 31, 2013, Aberdeen reported net earnings of
$(13.7) million or $(0.16) per basic share on total revenue of $(12.9) million.
Revenue was comprised of $(13.8) million from net investment losses and $0.9
million from interest income, dividends and advisory services fees. For the nine
months ending October 31, 2012, Aberdeen reported net earnings of $(22.2)
million or $(0.26) per share on total revenue of $(19.3) million ($(20.9)
million from net investment losses, $0.6 million from royalties and $1.0 million
from interest and dividend income and advisory service fees).


Normal Course Issuer Bid ("NCIB")

During the nine months ending October 31, 2013, 725,180 common shares were
purchased for cancellation under the Company's NCIB at an average cost of $0.17.
Aberdeen expects to continue to purchase shares over the remainder of the fiscal
year, depending on market conditions and other investment opportunities that may
be available.


About Aberdeen International Inc:

Aberdeen is a publicly traded global investment and merchant banking company
focused on small cap companies in the resource sector. Aberdeen will seek to
acquire significant equity participation in pre-IPO and/or early stage public
resource companies with undeveloped or undervalued high-quality resources.
Aberdeen will focus on companies that: (i) are in need of managerial, technical
and financial resources to realize their full potential; (ii) are undervalued in
foreign capital markets; and/or (iii) operate in jurisdictions with moderate
local political risk. Aberdeen will seek to provide value-added managerial and
board advisory services to companies. The Corporation's intention will be to
optimize the return on its investment over an 24 to 36 month investment time
frame.


For additional information, please visit our website at
www.aberdeeninternational.ca and follow us on Facebook and Twitter: AberdeenAAB.


Cautionary Note

Except for statements of historical fact contained herein, the information in
this press release constitutes "forward-looking information" within the meaning
of Canadian securities law. Such forward-looking information may be identified
by words such as "plans", "proposes", "estimates", "intends", "expects",
"believes", "may", "will" and include without limitation, statements regarding
the impact of the appointment on Aberdeen; past success as an indicator of
future success; net asset value of the Company; the potential of investee
companies and the appreciation of their share price; the future intentions of
the Company with regard to its shareholdings; the Company's plan of business
operations; and anticipated returns. There can be no assurance that such
statements will prove to be accurate; actual results and future events could
differ materially from such statements. Factors that could cause actual results
to differ materially include, among others, metal prices, competition, financing
risks, acquisition risks, risks inherent in the mining industry, and regulatory
risks. Most of these factors are outside the control of the Company. Investors
are cautioned not to put undue reliance on forward-looking information. Except
as otherwise required by applicable securities statutes or regulation, the
Company expressly disclaims any intent or obligation to update publicly
forward-looking information, whether as a result of new information, future
events or otherwise.


FOR FURTHER INFORMATION PLEASE CONTACT:
Aberdeen International Inc.
Mike McAllister
Manager, Investor Relations
+1 416-309-2134
info@aberdeeninternational.ca


Aberdeen International Inc.
David Stein
President and Chief Executive Officer
+1 416-861-5812
dstein@aberdeeninternational.ca
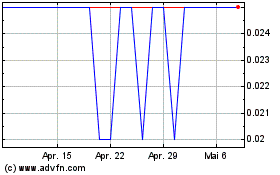
Aberdeen (TSX:AAB)
Historical Stock Chart
Von Apr 2024 bis Mai 2024

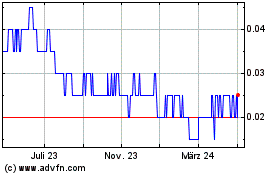
Aberdeen (TSX:AAB)
Historical Stock Chart
Von Mai 2023 bis Mai 2024
