Original-Research: Westwing Group SE (von NuWays AG): Kaufen
08 Mai 2024 - 9:01AM
EQS Non-Regulatory
Original-Research: Westwing Group SE - von NuWays AG
Einstufung von NuWays AG zu Westwing Group SE
Unternehmen: Westwing Group SE
ISIN: DE000A2N4H07
Anlass der Studie: Update
Empfehlung: Kaufen
seit: 08.05.2024
Kursziel: EUR 18.00
Kursziel auf Sicht von: 12 Monaten
Letzte Ratingänderung:
Analyst: Mark Schüssler
Healthy Q1 results // FY24 guidance confirmed
Healthy Q1 results underpin that Westwing was able to continue
the trend of yoy GMV growth witnessed in recent quarters. Q1 sales
increased by 6% yoy to € 109m (eNuW: € 107.7m), showing an
acceleration of growth versus Q4 (+2% yoy), driven by growth in
active customers (+2% yoy to 1.28m) and basket size (+9% yoy to €
185). International and DACH grew 3% and 8% yoy, respectively,
implying continued market share gains amid ongoing challenges in
the German online Home & Living market (-4% yoy).
At the same time, efficiency measures are bearing fruit. Adj.
EBITDA arrived in line with expectations at € 6m in Q1 (eNuW: €
6.5m), representing a margin improvement of 0.8ppts yoy to 5.8%.
This was carried by a strong contribution margin expansion of
+4ppts yoy to 32%, a favorable product mix (i.e. higher private
label share, +5ppts yoy to 51% of GMV in Q1), reduced fulfilment
expenses (-2ppts yoy) as well as lower G&A costs (-1ppts yoy)
as a result of cost savings (i.e. consolidation of logistics and
warehouses and streamlining the organization). Notably, Westwing
was able to translate the favorable adj. EBITDA development into
healthy FCF of € 4m in Q1, supported by net working capital of €
-18m, likely concluding the reduction of excess inventory built up
during Covid.
Westwing confirmed its FY24 guidance and with sales expected to
develop within a range of -3% to 4% yoy to € 415445m (eNuW: €
442m). While the Q1 performance was overall satisfactory,
management continues to expect H2'24 sales to be weighed down by a
strategic adjustment of the product offering in Spain and Italy
(low to mid single-digit percentage impact) along with ongoing
challenges in the home & living market as consumers continue to
hold back on higher-value products such as furniture. The adj.
EBITDA outlook was reiterated at € 14m to € 24m implying a 3.1 to
5.8% margin (eNuW: € 23.7m with a 5.4% margin). Considering € 6m
adj. EBITDA in Q1, the bottom-line guidance looks achievable, in
our view, while FCF for the full year should likely be close to
break-even (eNuW: € 0.3m) due to one-off restructuring costs (i.e.
complexity reduction, SaaS transition) and normalizing inventory
patterns.
Overall, Westwing has adapted successfully to the current
transition period towards a leaner and more scalable organizational
setup. While visibility on a return of consumer confidence remains
low, Westwing’s mid-term prospects continue to look bright driven
by the structural shift towards e-commerce and its unique
positioning in the European home & living market. We reiterate
our BUY recommendationwith a PT of € 18.00, based on DCF, and keep
the stock on our Alpha List.
Die vollständige Analyse können Sie hier downloaden:
http://www.more-ir.de/d/29623.pdf
Die Analyse oder weiterführende Informationen zu dieser können Sie
hier downloaden www.nuways-ag.com/research.
Kontakt für Rückfragen
NuWays AG - Equity Research
Web: www.nuways-ag.com
Email: research@nuways-ag.com
LinkedIn: https://www.linkedin.com/company/nuwaysag Adresse:
Mittelweg 16-17, 20148 Hamburg, Germany ++++++++++
Diese Meldung ist keine Anlageberatung oder Aufforderung zum
Abschluss bestimmter Börsengeschäfte. Offenlegung möglicher
Interessenskonflikte nach § 85 WpHG beim oben analysierten
Unternehmen befinden sich in der vollständigen Analyse.
++++++++++
-------------------übermittelt durch die EQS Group
AG.-------------------
Für den Inhalt der Mitteilung bzw. Research ist alleine der
Herausgeber bzw. Ersteller der Studie verantwortlich. Diese Meldung
ist keine Anlageberatung oder Aufforderung zum Abschluss bestimmter
Börsengeschäfte.
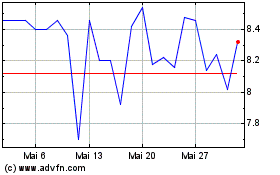
Westwing (TG:WEW)
Historical Stock Chart
Von Nov 2024 bis Dez 2024

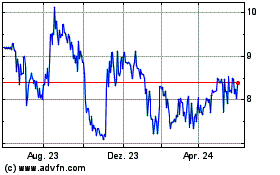
Westwing (TG:WEW)
Historical Stock Chart
Von Dez 2023 bis Dez 2024
