UNITED STATES
SECURITIES AND EXCHANGE COMMISSION
Washington, D.C. 20549
Form 6-K
Report of Foreign Issuer
Pursuant to Rule 13a-16 or 15d-16 under
the Securities Exchange Act of 1934
For the Month of November 2023
Commission File Number: 001-32294
TATA MOTORS LIMITED
(Translation of registrant’s name into English)
BOMBAY HOUSE
24, HOMI MODY STREET,
MUMBAI 400 001, MAHARASHTRA, INDIA
Telephone # 91 22 6665 8282 Fax # 91 22 6665 7799
(Address of principal executive office)
Indicate by check mark whether the registrant files or will file annual reports under cover Form 20-F or Form 40-F.
Form 20-F ☒ Form 40-F ☐
Indicate by check mark if the registrant is submitting the Form 6-K in paper as permitted by Regulation S-T Rule 101(b)(1):
Yes ☐ No ☒
Indicate by check mark if the registrant is submitting the Form 6-K in paper as permitted by Regulation S-T Rule 101(b)(7):
Yes ☐ No ☒
EXHIBIT INDEX
SIGNATURE
Pursuant to the requirements of the Securities Exchange Act of 1934, the registrant has duly caused this report to be signed on its behalf by the undersigned, thereunto duly authorised.
|
|
|
Tata Motors Limited |
|
|
|
By: |
|
/s/ Maloy Kumar Gupta |
Name: |
|
Maloy Kumar Gupta |
Title: |
|
Company Secretary |
|
|
|
Dated: |
|
November 3, 2023 |
Exhibit 99.1
TATA MOTORS LIMITED
Bombay House
24, Homi Mody Street,
Mumbai 400 001, Maharashtra, India
Submission of Investor presentation to be made to the Analysts/Investors
November 3, 2023, Mumbai: Reproduced herein below is the presentation to be made to the Analysts/Investors on the Audited Standalone Financial Results and Unaudited Consolidated Financial Results for the second quarter and half year ended September 30, 2023.
The same is also being made available on the Company’s website www.tatamotors.com.
This is for your information and records.
LOGO Tata Motors Group Results for quarter ended September 30, 2023
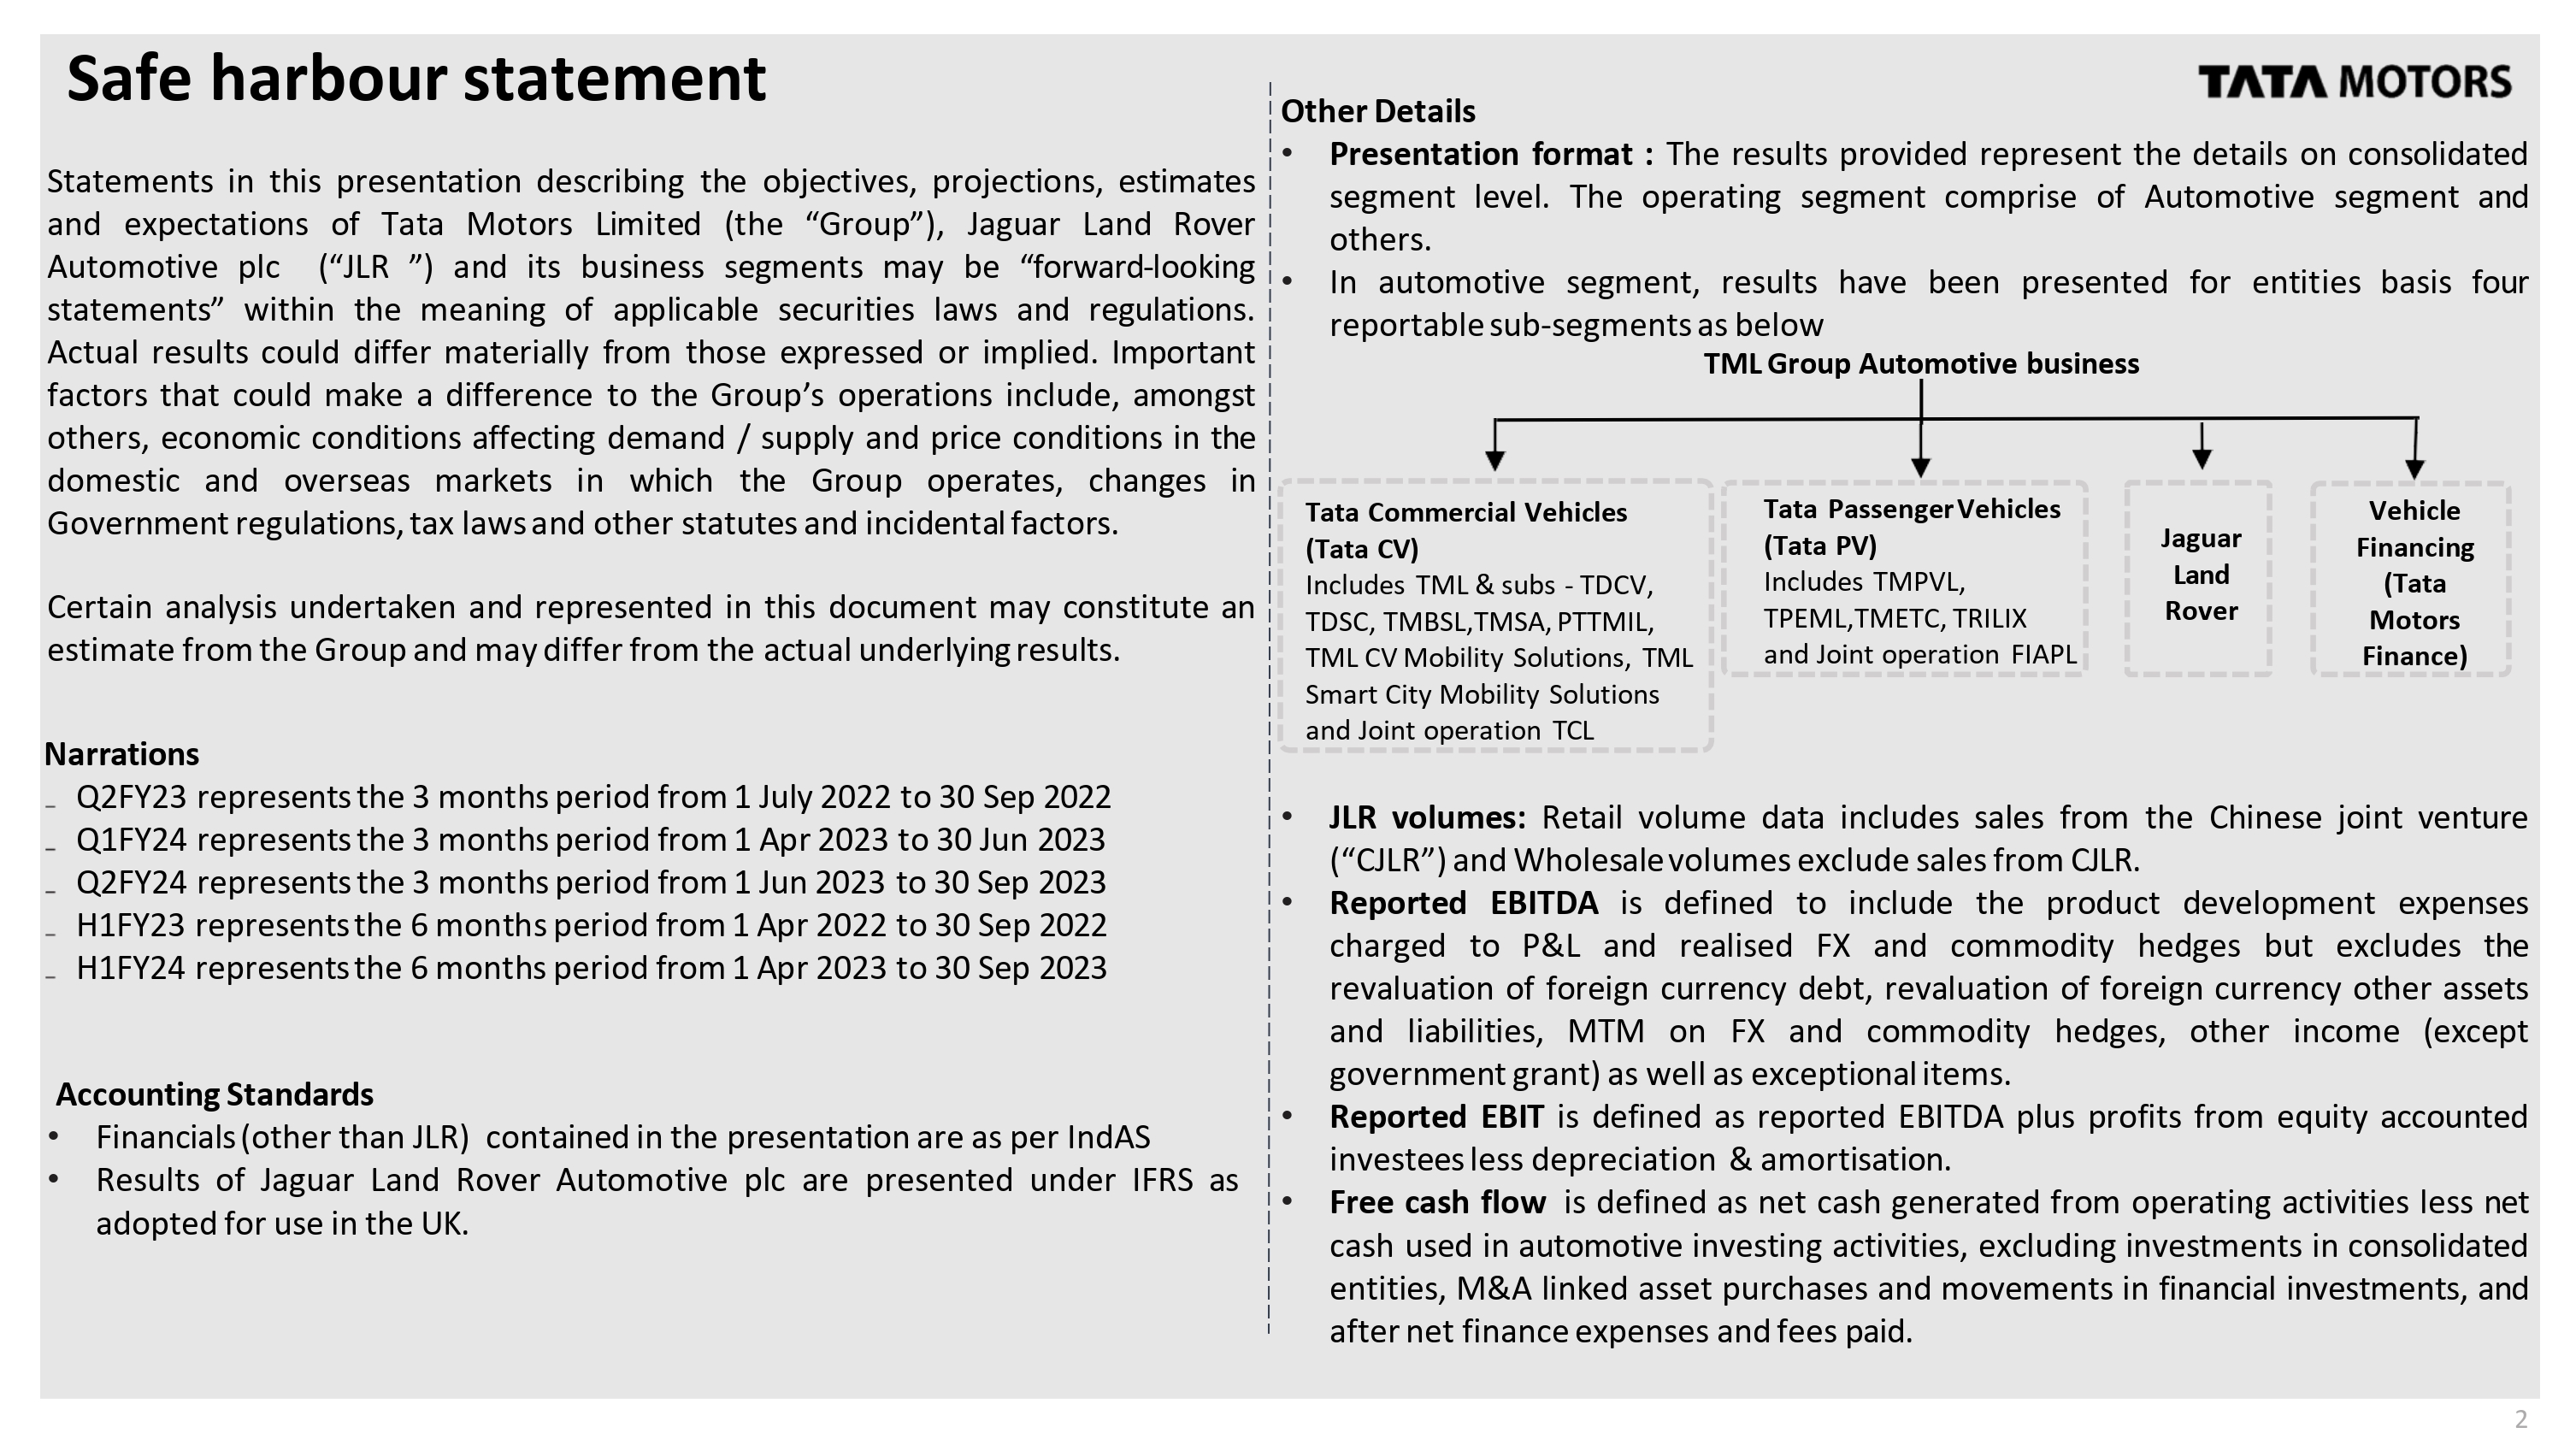
LOGO Safe harbour statement Statements in this presentation describing the objectives, projections, estimates and expectations of Tata Motors Limited (the “Group”), Jaguar Land Rover Automotive plc (“JLR ”) and its business segments may be “forward-looking statements” within the meaning of applicable securities laws and regulations. Actual results could differ materially from those expressed or implied. Important factors that could make a difference to the Group’s operations include, amongst others, economic conditions affecting demand / supply and price conditions in the domestic and overseas markets in which the Group operates, changes in Government regulations, tax laws and other statutes and incidental factors. Certain analysis undertaken and represented in this document may constitute an estimate from the Group and may differ from the actual underlying results. Narrations Q2FY23 represents the 3 months period from 1 July 2022 to 30 Sep 2022 Q1FY24 represents the 3 months period from 1 Apr 2023 to 30 Jun 2023 Q2FY24 represents the 3 months period from 1 Jun 2023 to 30 Sep 2023 H1FY23 represents the 6 months period from 1 Apr 2022 to 30 Sep 2022 H1FY24 represents the 6 months period from 1 Apr 2023 to 30 Sep 2023 Accounting Standards Financials (other than JLR) contained in the presentation are as per IndAS Results of Jaguar Land Rover Automotive plc are presented under IFRS as adopted for use in the UK. Other Details Presentation format : The results provided represent the details on consolidated segment level. The operating segment comprise of Automotive segment and others. In automotive segment, results have been presented for entities basis four reportable sub-segments as below TML Group Automotive business Tata Commercial Vehicles (Tata CV) Includes TML & subs - TDCV, TDSC, TMBSL,TMSA, PTTMIL, TML CV Mobility Solutions, TML Smart City Mobility Solutions and Joint operation TCL Tata Passenger Vehicles (Tata PV) Includes TMPVL, TPEML,TMETC, TRILIX and Joint operation FIAPL Jaguar Land Rover Vehicle Financing (Tata Motors Finance) JLR volumes: Retail volume data includes sales from the Chinese joint venture (“CJLR”) and Wholesale volumes exclude sales from CJLR. Reported EBITDA is defined to include the product development expenses charged to P&L and realised FX and commodity hedges but excludes the revaluation of foreign currency debt, revaluation of foreign currency other assets and liabilities, MTM on FX and commodity hedges, other income (except government grant) as well as exceptional items. Reported EBIT is defined as reported EBITDA plus profits from equity accounted investees less depreciation & amortisation. Free cash flow is defined as net cash generated from operating activities less net cash used in automotive investing activities, excluding investments in consolidated entities, M&A linked asset purchases and movements in financial investments, and after net finance expenses and fees paid.

Product and other highlights LOGO Portfolio of CNG products; Twin-cylinder technology, no compromise on boot space Major facelifts of Nexon, Nexon.EV, Harrier and Safari Supplied 1000 e-Buses till date and delivered first Hydrogen cell powered bus JLR opens new state-of-the-art future energy lab JLR order book remains strong: 168k units $400m of bonds bought back in October

Q2: Revenue ₹ 105.1KCr, EBITDA 13.7%, PBT(bei) ₹ 6.1KCr LOGO Business continues its profitable, cash accretive growth momentum (Bar_Chart_1) (Bar_Chart_2) (Bar_Chart_3) (Bar_Chart_4) (Bar_Chart_5) (Bar_Chart_6) (Bar_Chart_7) (Bar_Chart_8)

EBIT 7.5%; Net Auto Debt reduces to ₹ 38.7 KCr LOGO All auto verticals continue their growth trajectory Q2 FY24 | Consolidated | IndAS (Bar_Chart_1) (Bar_Chart_2) (Bar_Chart_3) Entities ₹KCr TML India(1) 7.6 JLR 22.8 TML Holdings 9.5 Smart City Mobility business(2) 0.3 Others and adj (1.5) Total 38.7 (1)Includes CV+PV+EV+Joint operations+ (2) IncludesTML Smart City Mobility+ TML CV Mobility
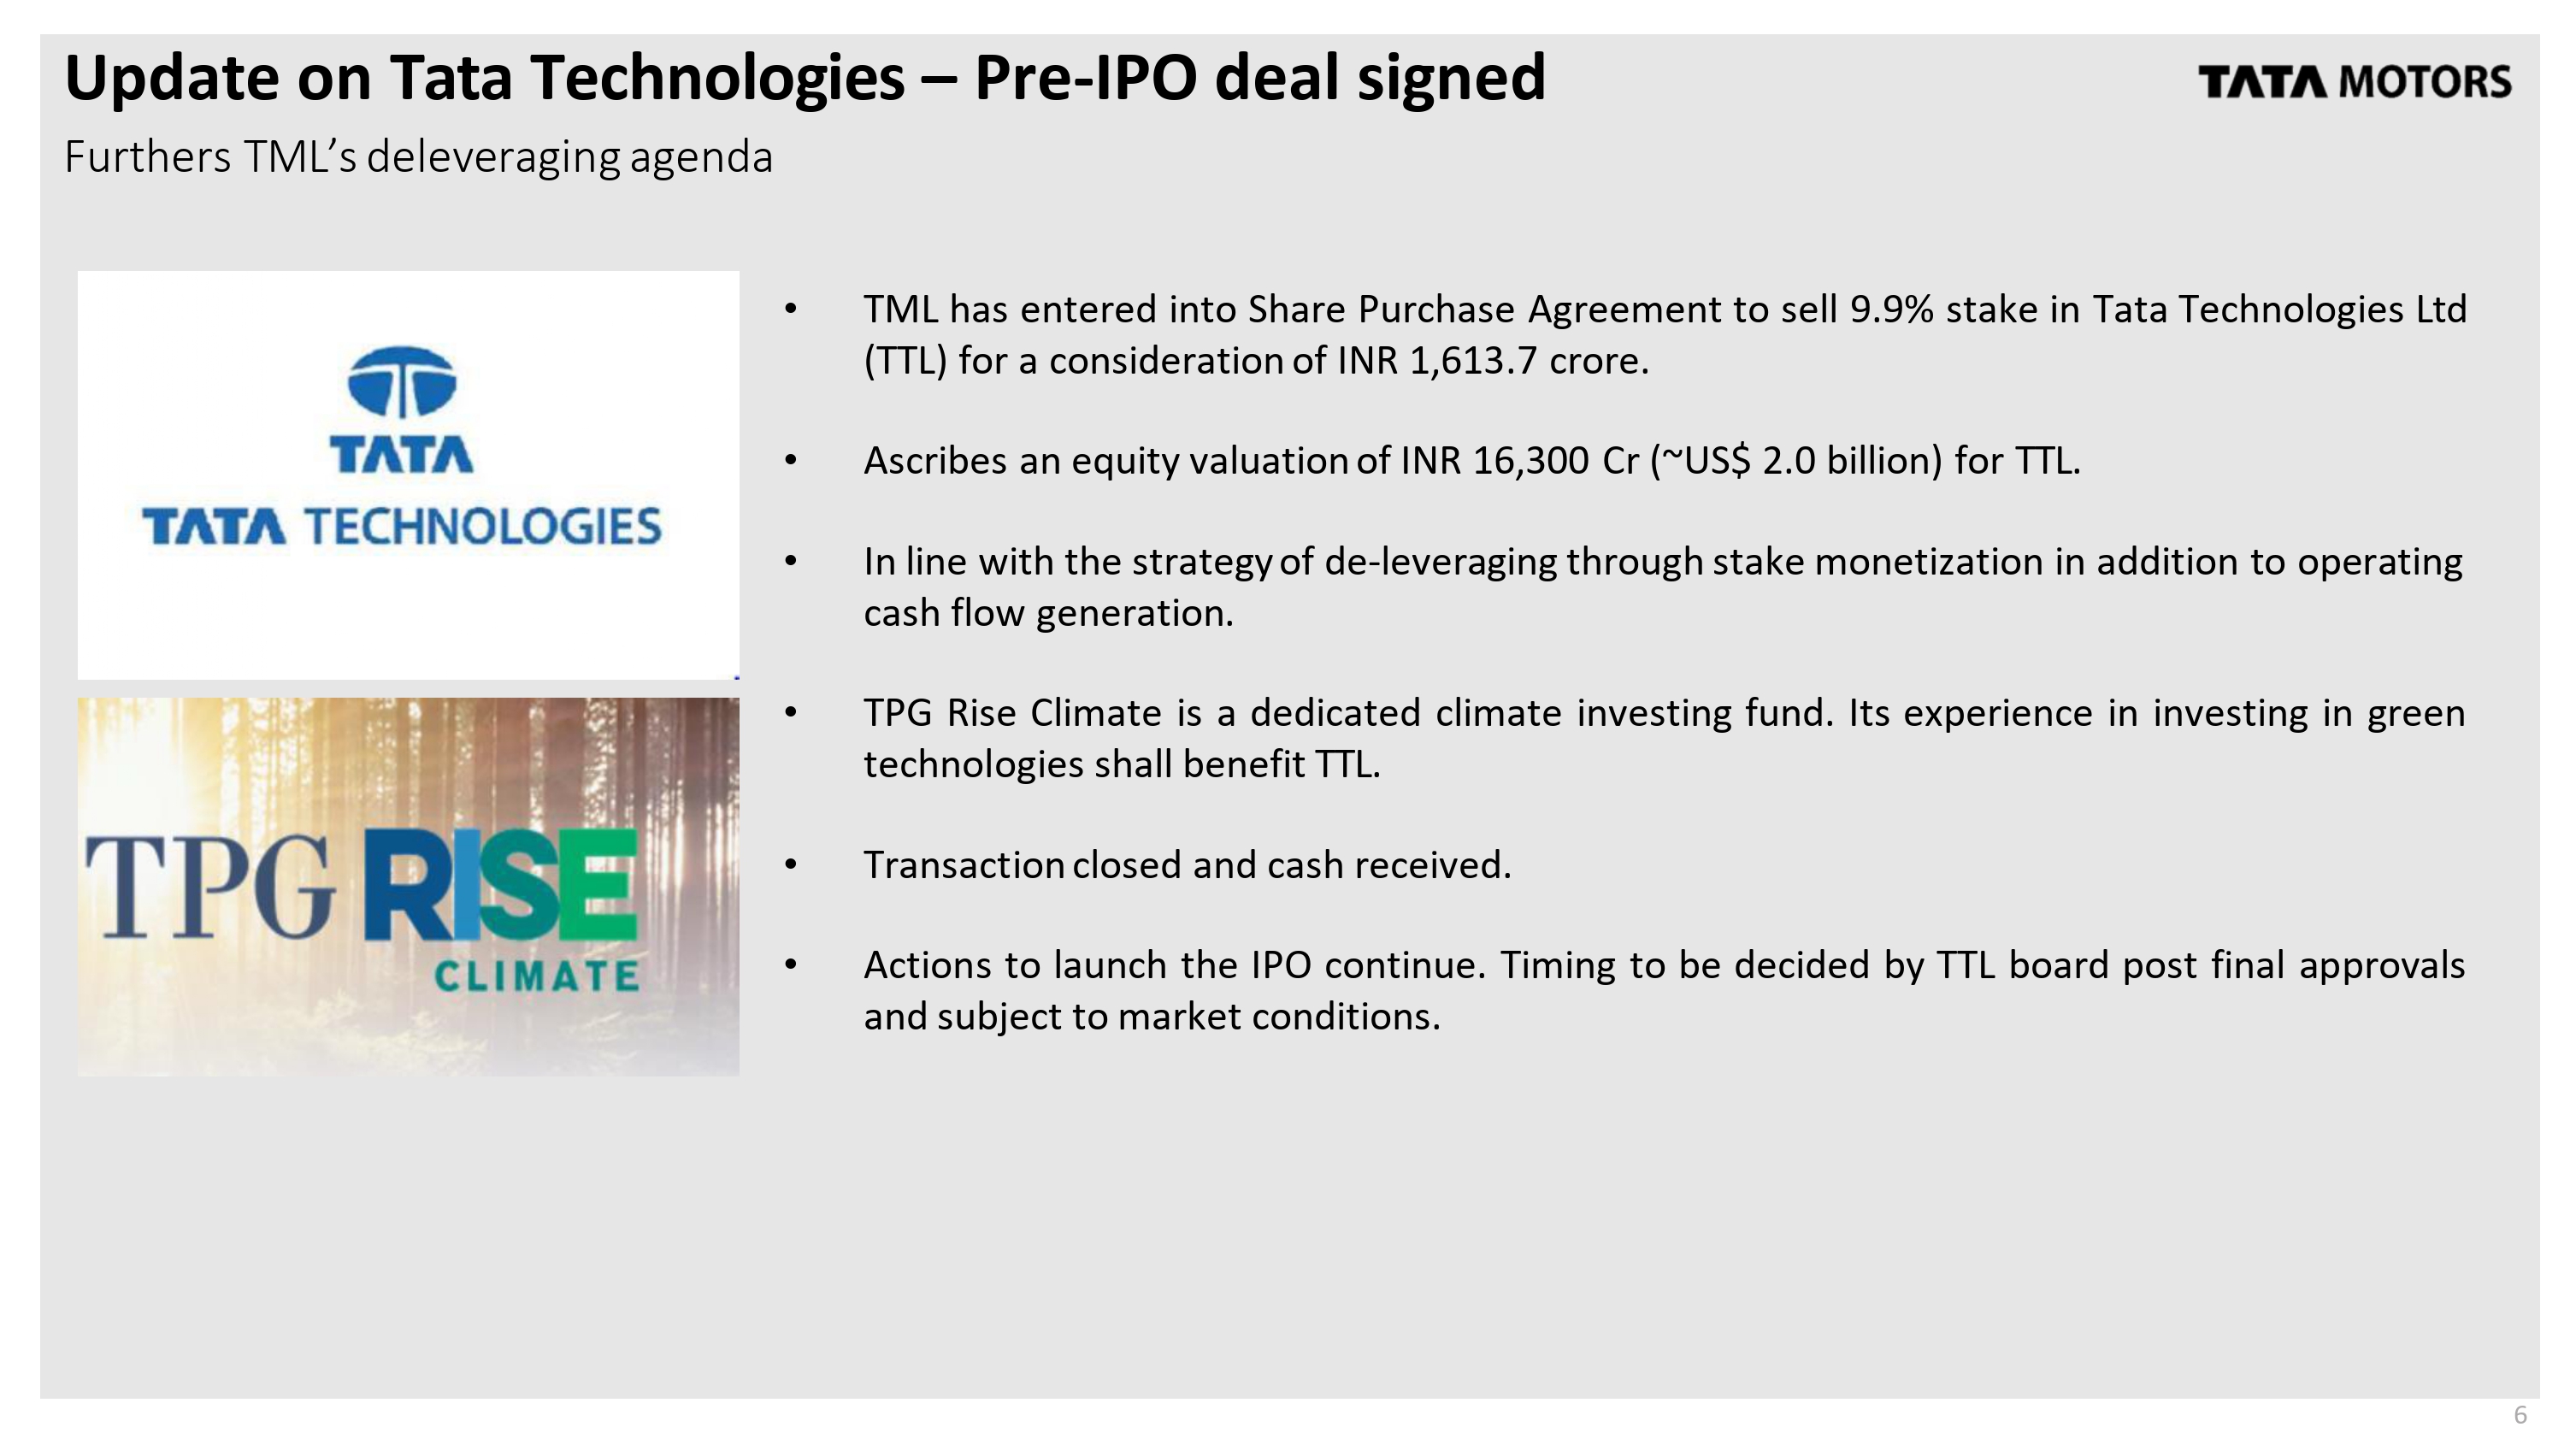
Update on Tata Technologies – Pre-IPO deal signed Furthers TML’s deleveraging agenda LOGO TML has entered into Share Purchase Agreement to sell 9.9% stake in Tata Technologies Ltd (TTL) for a consideration of INR 1,613.7 crore. Ascribes an equity valuation of INR 16,300 Cr (~US$ 2.0 billion) for TTL. In line with the strategy of de-leveraging through stake monetization in addition to operating cash flow generation. TPG Rise Climate is a dedicated climate investing fund. Its experience in investing in green technologies shall benefit TTL. Transaction closed and cash received. Actions to launch the IPO continue. Timing to be decided by TTL board post final approvals and subject to market conditions.

Acquisition of ~27% stake in Freight Tiger Fleet Edge + Freight Tiger to provide an end-to-end solution by integrating the truck and trip eco-systems LOGO Fleet Edge is on 4.8 lakhs trucks 10m+ trips being facilitated by Freight Tiger (annualized run-rate) 1 – McKinsey Global Institute The opportunity Indian freight market is massive and fragmented ($120B with 12% CAGR 1). Significant investments made in road infrastructure and in truck capabilities. However, process of freight ordering, management and settlement remains under invested leading to inefficiencies. “Fleet Edge”, our connected vehicle platform, provides trucking solutions to fleet operators and drivers. “Freight Tiger” provides digital market-place solutions for shippers, intermediaries and fleet operators. Integrating these platforms addresses the freight management issue comprehensively by creating a seamless, end-to-end, digital marketplace solution for all stakeholders in the truck and trip eco-system. Benefits to stakeholders Lower freight cost from ‘matching’ Better transparency on freight availability Faster payments Enhanced visibility, reliability and speed Create customised solutions for shippers The transaction TML to invest ₹ 150 Cr for a 26.79% post acquisition stake. In the next 2-3 years, TML to invest an additional ₹ 100 Cr as required at the then FMV. Between FY28, FY29 - TML will have the right to buy other investors at the then FMV
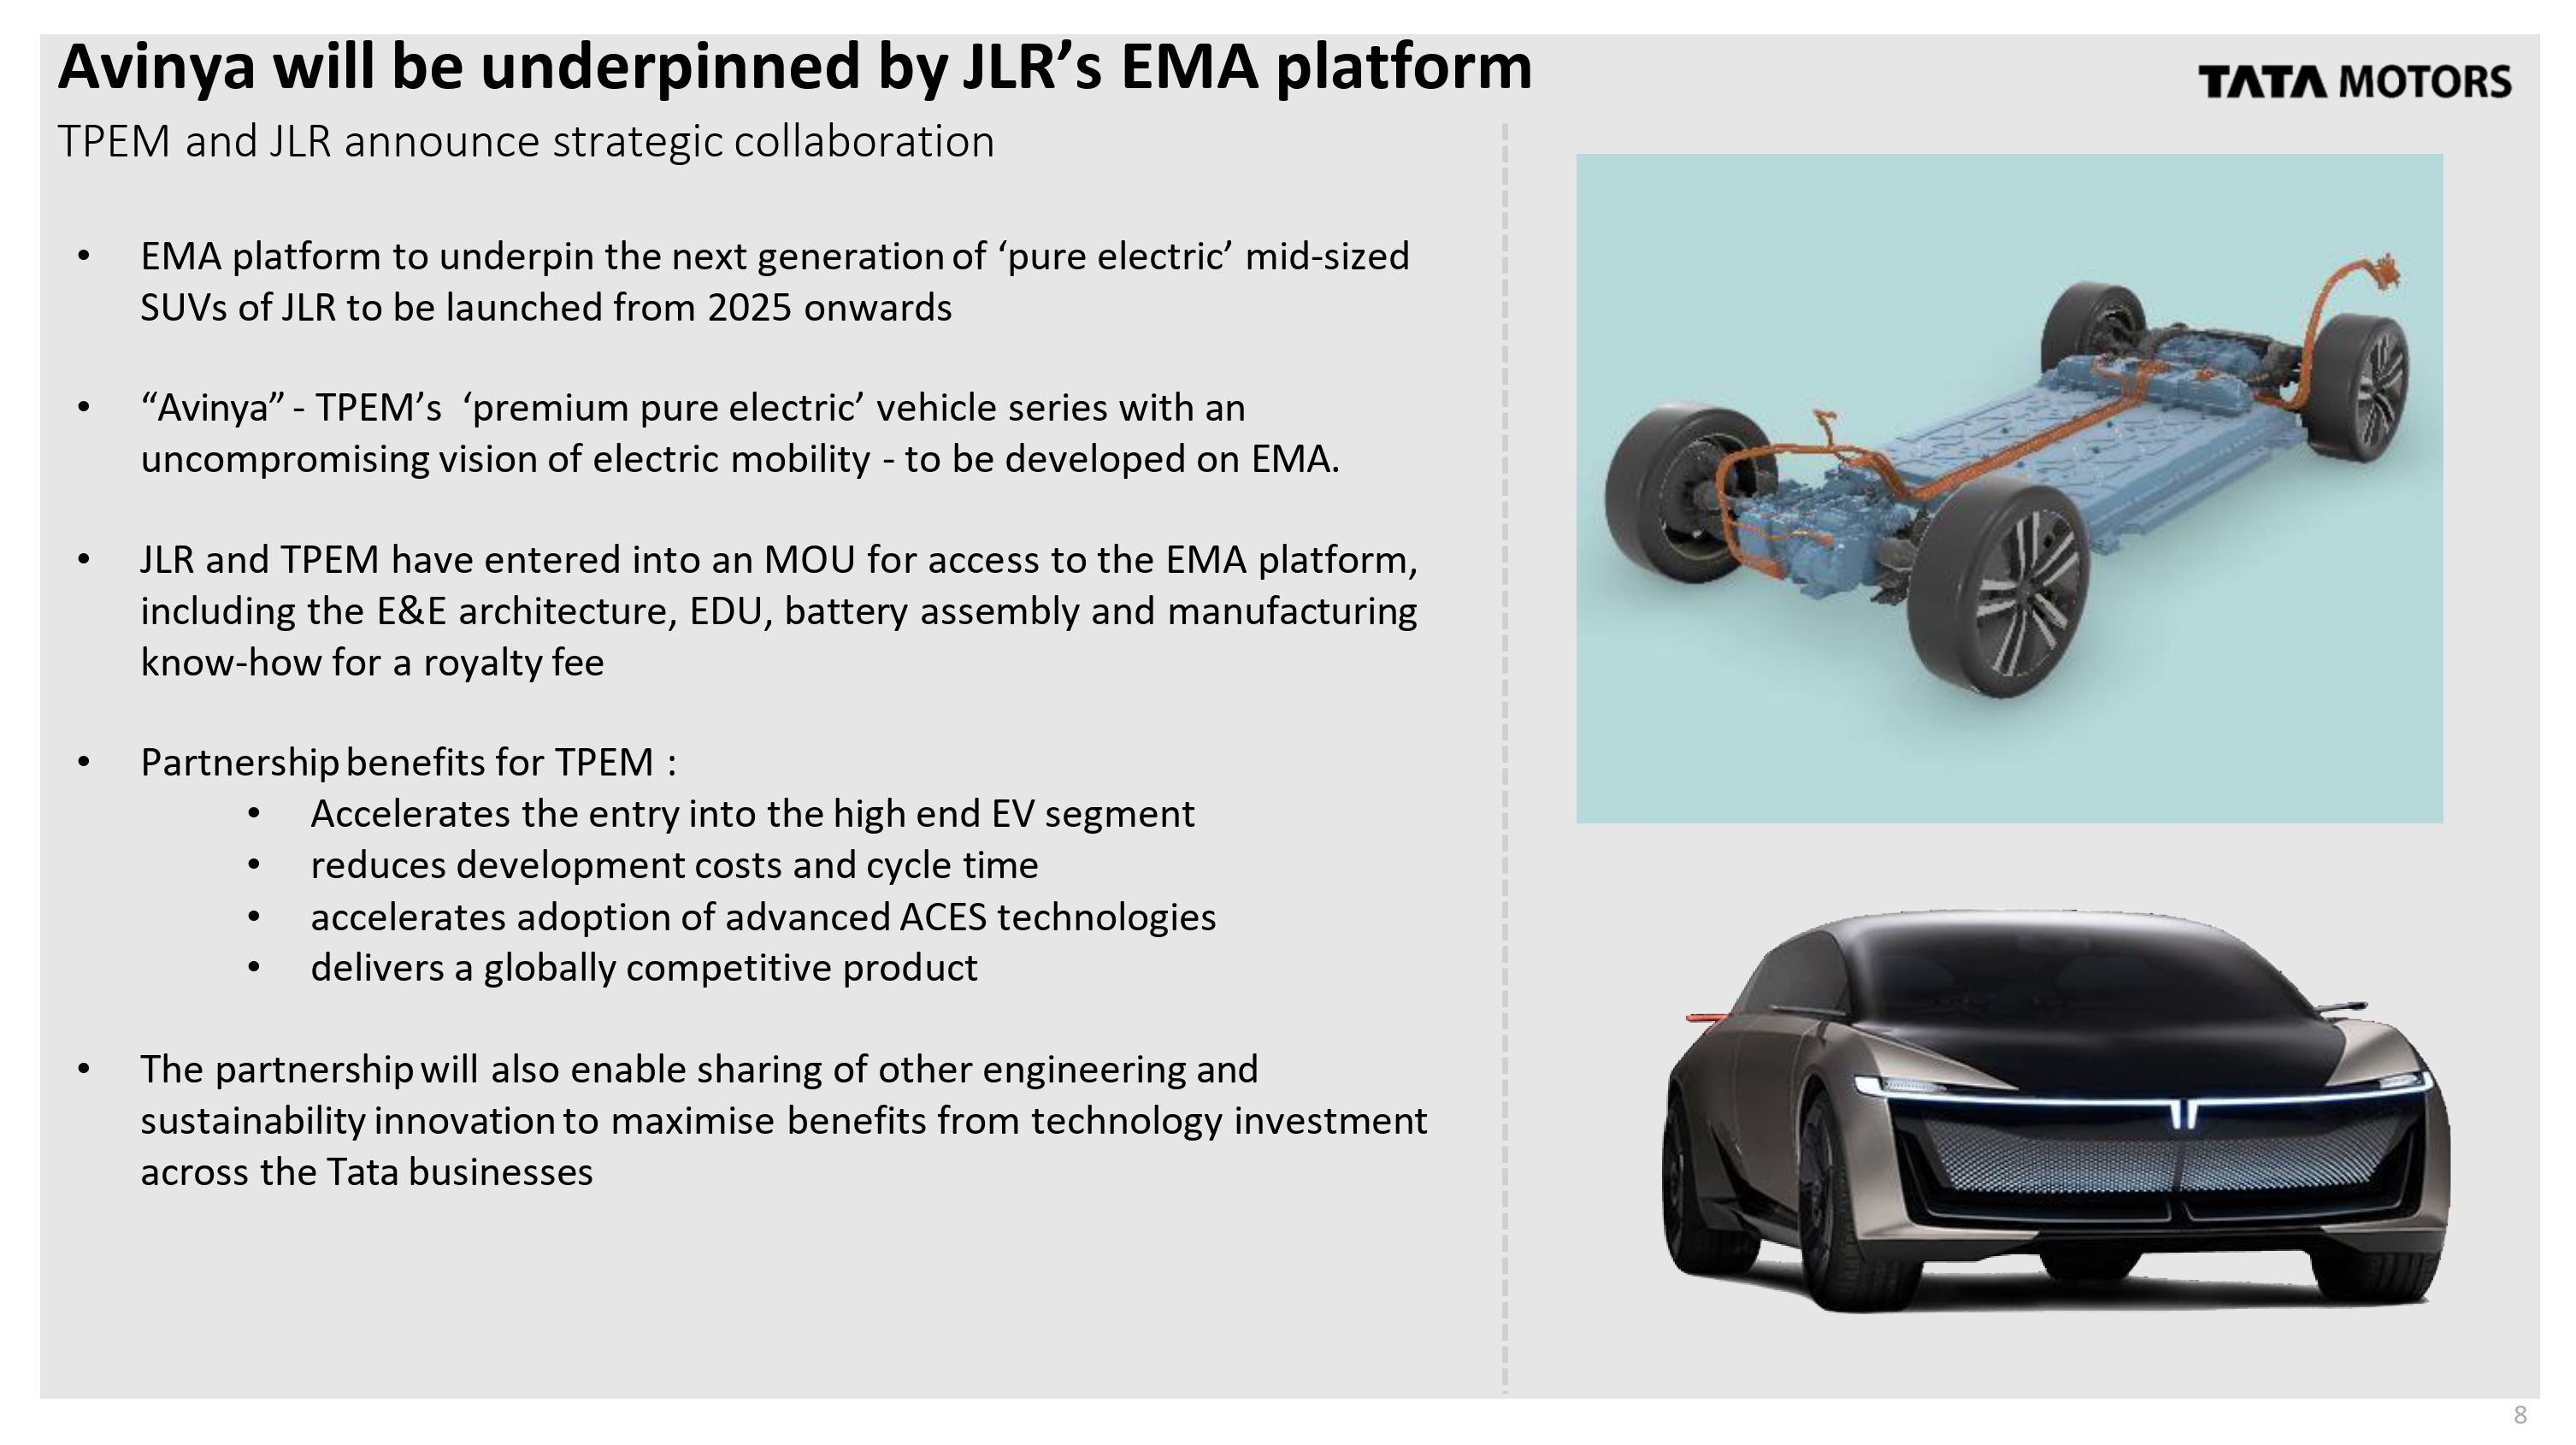
Avinya will be underpinned by JLR’s EMA platform LOGO TPEM and JLR announce strategic collaboration EMA platform to underpin the next generation of ‘pure electric’ mid-sized SUVs of JLR to be launched from 2025 onwards “Avinya” - TPEM’s ‘premium pure electric’ vehicle series with an uncompromising vision of electric mobility - to be developed on EMA. JLR and TPEM have entered into an MOU for access to the EMA platform, including the E&E architecture, EDU, battery assembly and manufacturing know-how for a royalty fee Partnership benefits for TPEM : Accelerates the entry into the high end EV segment reduces development costs and cycle time accelerates adoption of advanced ACES technologies delivers a globally competitive product The partnership will also enable sharing of other engineering and sustainability innovation to maximise benefits from technology investment across the Tata businesses

LOGO JAGUAR LAND ROVER AUTOMOTIVE PLC Results for the quarter ended September 30, 2023 RICHARD MOLYNEUX Chief Financial Officer

Q2 Revenue £6.9b, EBIT 7.3%, PBT(bei) £442m LOGO Strong Q2 & H1 performance compared to prior year with all H1 metrics significantly higher Q2 FY24 | Jaguar Land Rover | IFRS, £m (Bar_Chart_1) (Bar_Chart_2) (Bar_Chart_3) (Bar_Chart_4) (Bar_Chart_5) (Bar_Chart_6) (Bar_Chart_7) (Bar_Chart_8) 1 PBT before exceptional items. Exceptional items are : £155m in FY23 YTD. 2 Q2 FY23 EBITDA re-stated from 10.3 % and FY23 YTD EBITDA re-stated from 8.5% due to change in Accounting treatment of Gr a n t s . 3 FY23 YTD FCF re - stated from £ (784) m following a change in definition to Free Cash Flow.
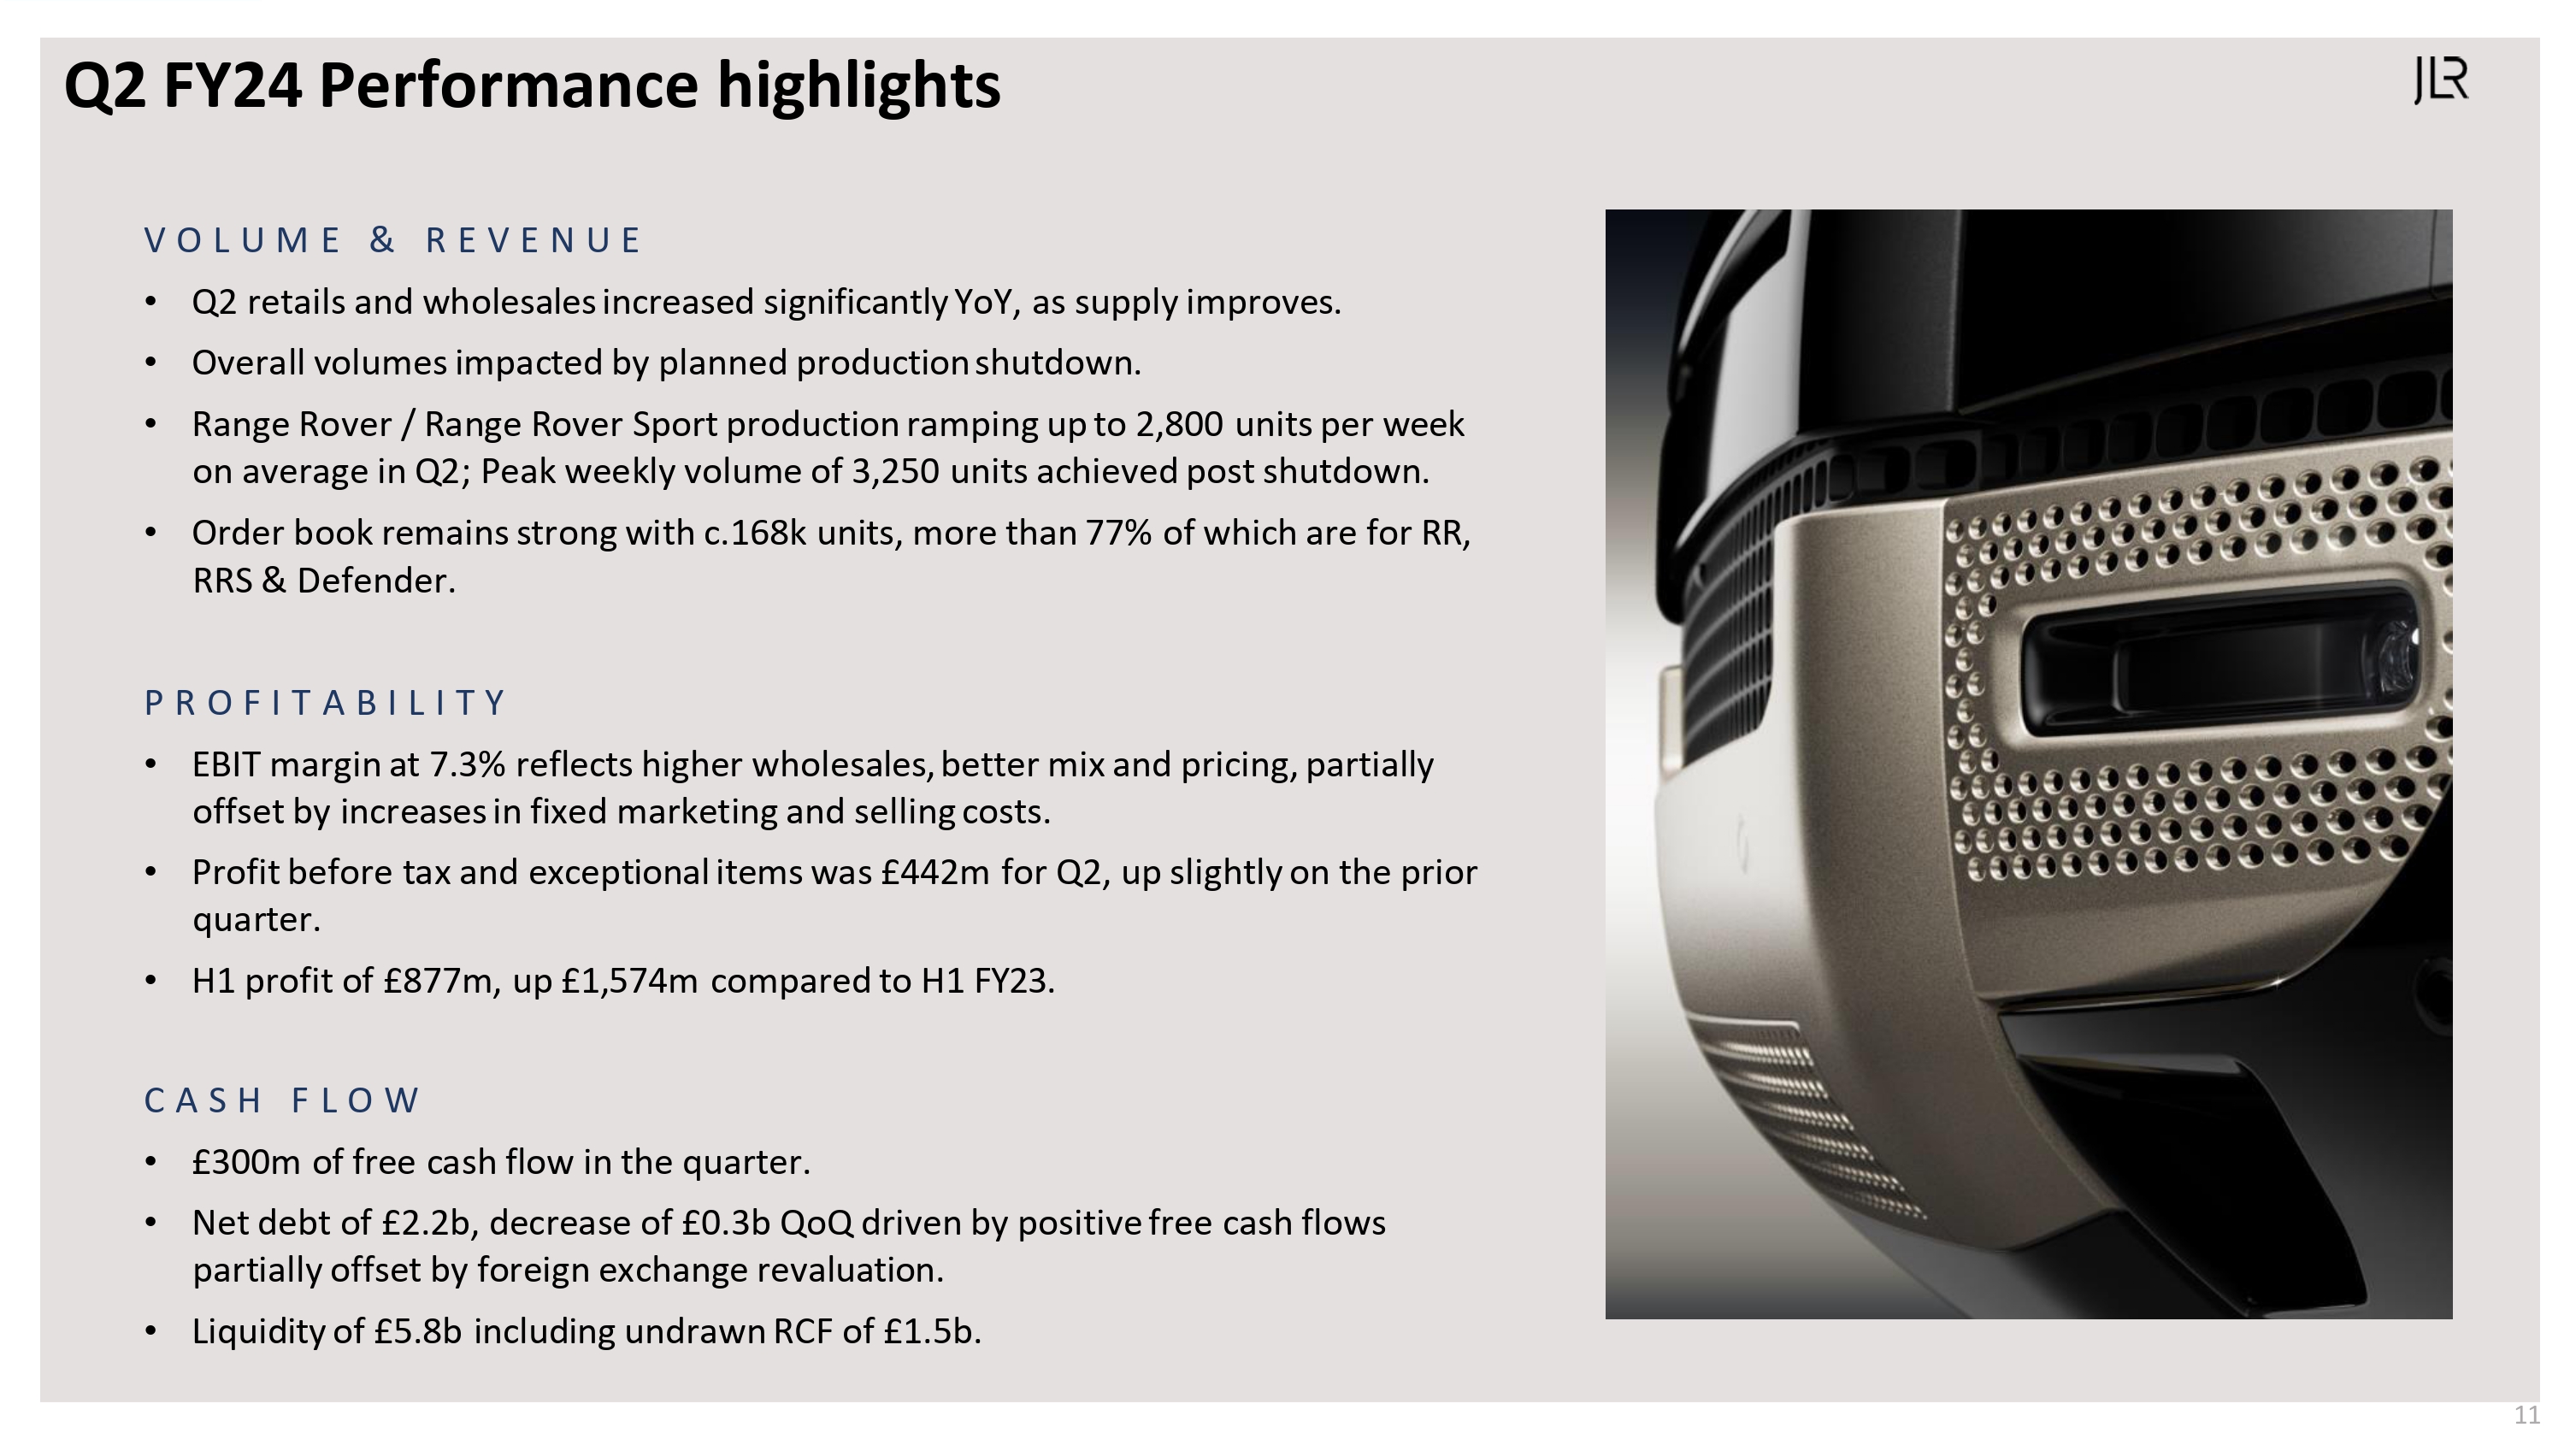
Q2 FY24 Performance highlights V O L U M E & R E V E N U E Q2 retails and wholesales increased significantly YoY, as supply improves. Overall volumes impacted by planned production shutdown. Range Rover / Range Rover Sport production ramping up to 2,800 units per week on average in Q2; Peak weekly volume of 3,250 units achieved post shutdown. Order book remains strong with c.168k units, more than 77% of which are for RR, RRS & Defender. PROFITABILITY EBIT margin at 7.3% reflects higher wholesales, better mix and pricing, partially offset by increases in fixed marketing and selling costs. Profit before tax and exceptional items was £442m for Q2, up slightly on the prior quarter. H1 profit of £877m, up £1,574m compared to H1 FY23. CASH FLOW £300m of free cash flow in the quarter. Net debt of £2.2b, decrease of £0.3b QoQ driven by positive free cash flows partially offset by foreign exchange revaluation. Liquidity of £5.8b including undrawn RCF of £1.5b.JLR.

Q2 wholesales of 97K, up 29% yoy and up 4% qoq H1 Wholesales of 190k, up 29% year-on year FY 24 |Who lesales Brands | Units in 000 ’ s Range Rover Defender Discovery Jaguar Total Q2 37.4 45.7 44.3 Q2 FY23 Q1 FY24 Q2 FY24 17.5 28.3 30.5 Q2 FY23 Q1 FY24 Q2 FY24 8.4 9.0 8.5 12.0 10.3 13.5 Q2 FY23 Q1 FY24 Q2 FY24 75.3 93.3 96.8 Q2 FY23 Q1 FY24 Q2 FY24 FY24 YTD 70.4 89.9 FY23 FY24 35.2 58.8 FY23 FY24 18.6 17.5 FY23 FY24 22.9 23.9 FY23 FY24 147.1 190.1 FY23 FY24 * Wholesale volumes exclude sales from unconsolidated Chinese joint venture JLR.

UK N. AMEIACA EUROPE CHINA OVERSEAS JLR POWERTRAIN MIX (RETAILS) Q2 FY24YTD FY23 FY24 FY23 FY24 FY23 FY24 FY23 FY24 FY23 FY24 Q2 Wholesales up in North America, China Europe compared to Q1 YTD Wholesales higher in all regions compared to the prior year FY 24 |Wh o lesales Region s Un i t s i n 000 s 11.9 15.7 13.3 11.9 17.0 22.5 22.4 20.4 11.5 22.0 16.5 26.3 21.1 13.2 19.7 28.2 36.1 37.2 21.3 24.3 33.5 48.7 41.5 24.6 41.8 Q2 Q1 Q2 Q2 Q1 Q2 Q2 Q1 Q2 Q2 Q1 Q2 Q2 Q1 Q2 FY23 FY24 FY24 FY23 FY24 FY24 FY23 FY24 FY24 FY23 FY24 FY24 FY23 FY24 FY24 Q * Wholesale volumes exclude sales from unconsolidated Chinese joint venture 13 F 35% 26% 28% 54% 61% 59% 11% 13% 13% Q2 FY23 Q1 FY24 Q2 FY24.72% electrified BEV %PHEV MHEV ICE JLR.
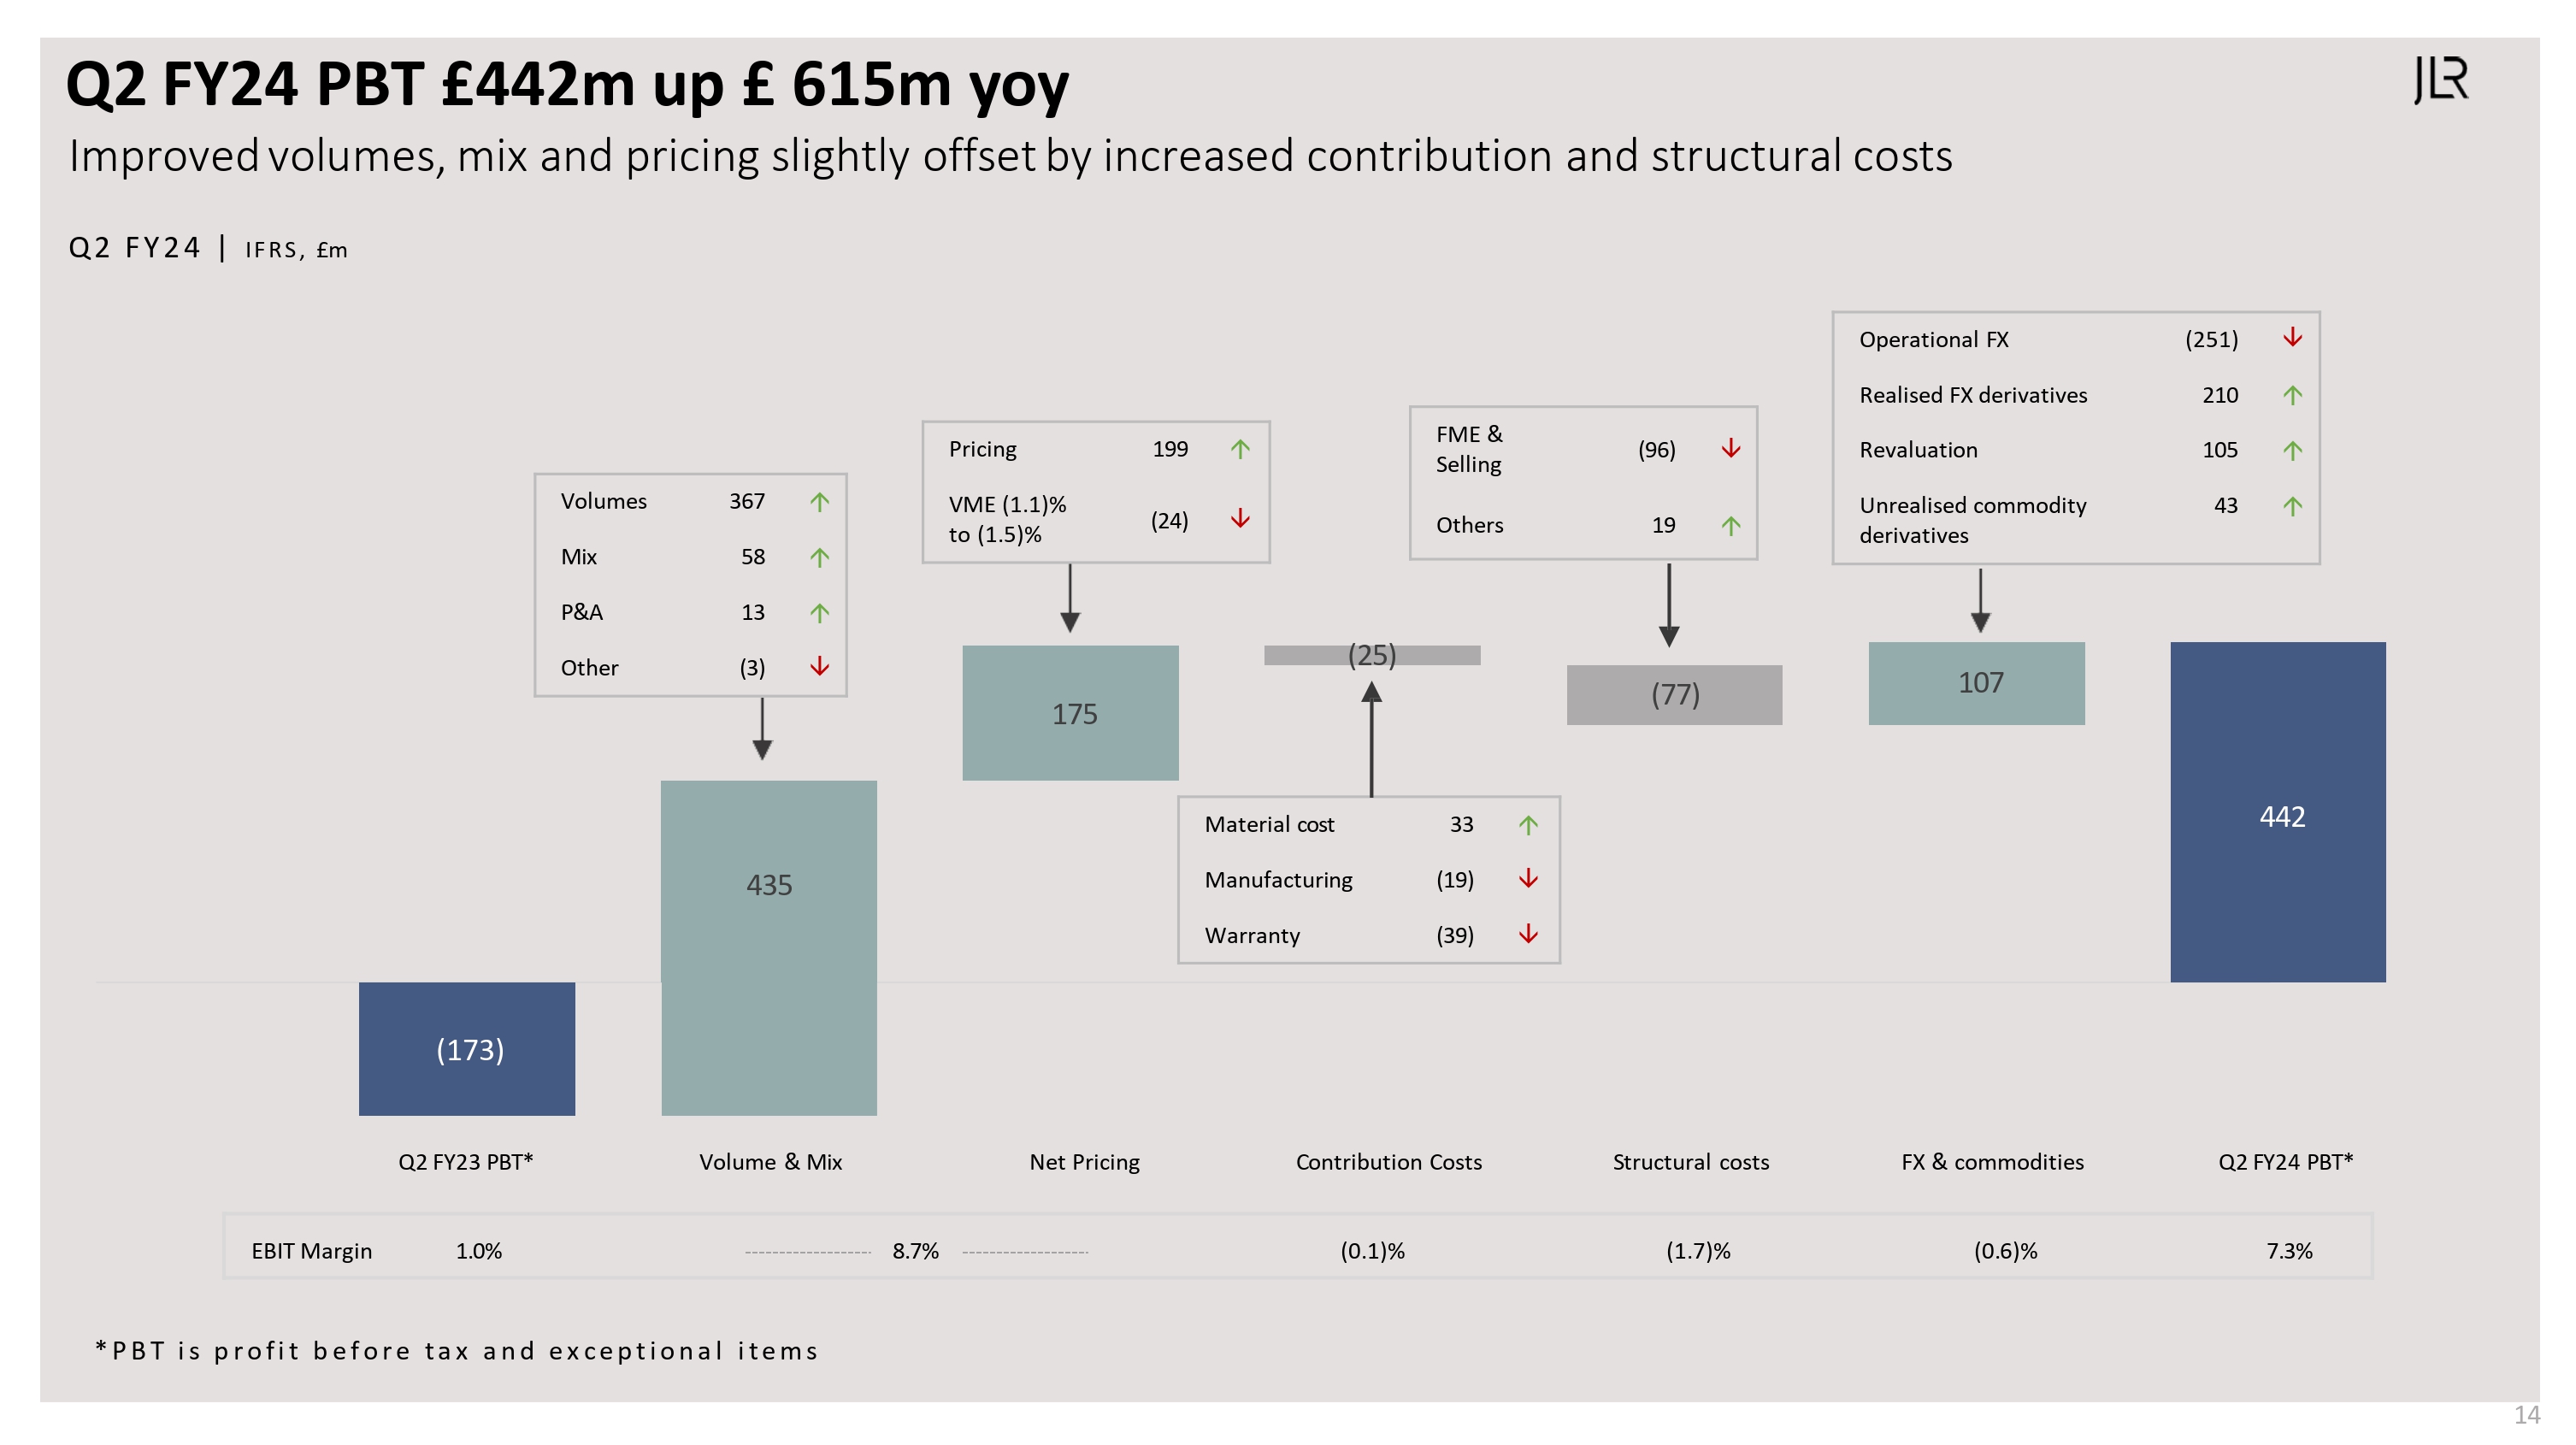
Q2 FY24 PBT £442m up £ 615m yoy Improved volumes, mix and pricing slightly offset by increased contribution and structural costs Q2 FY 24 | IFRS, £m Volumes 367 Mix 58 P&A 13 Other (3) Pricing 199 VME (1.1)% to (1.5)% (24) FME & Selling (96) Others 19 Operational FX (251) Realised FX derivatives 210 Revaluation 105 Unrealised commodity derivatives 43 Material cost 33 Manufacturing (19) Warranty (39) (173) 435 175 (25) (77) 107 442 EBIT Margin 1.0% 8.7% (0.1)% (1.7)% (0.6)% 7.3% Q2FY23 PBT* Volume& Mix Net Pricing Contribution costs structural costs FX & commodities q2 fy24 PBT * PBT is profit before tax and exceptional items JLR.
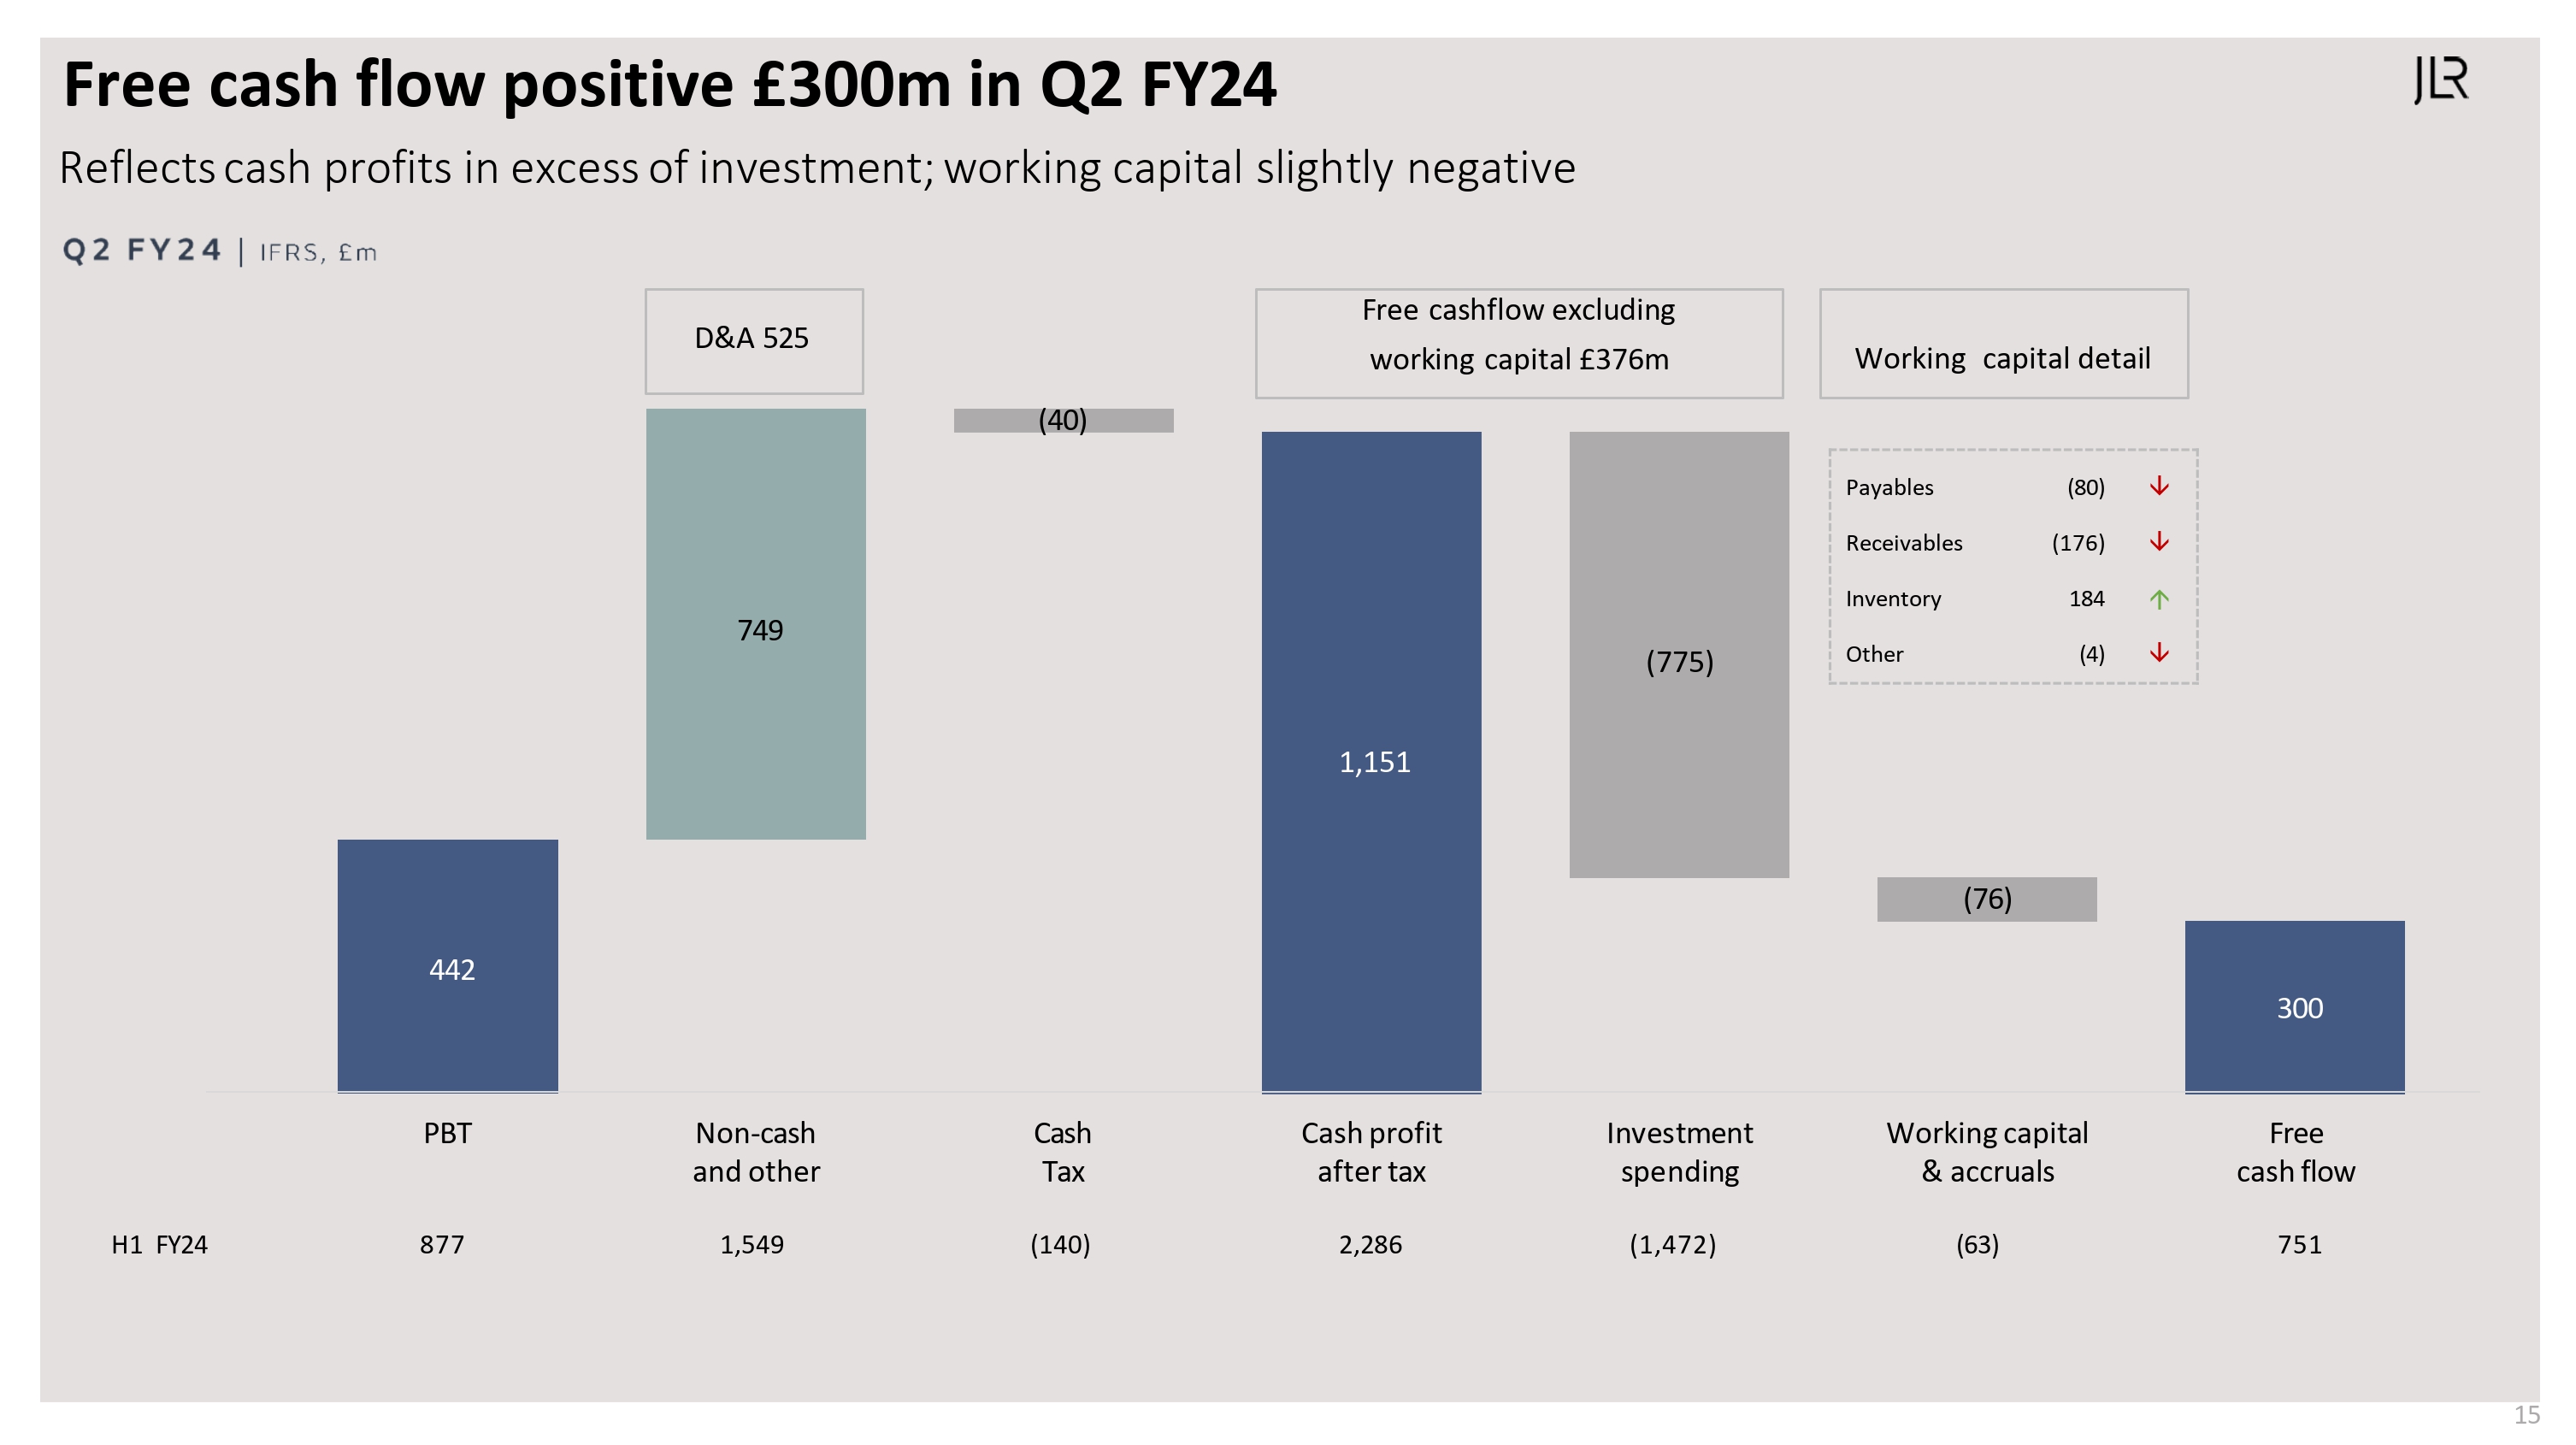
Free cash flow positive £300m in Q2 FY24 Reflects cash profits in excess of investment; working capital slightly negative Q2 FY 24|IFPS, £m D&A 525 Free cashflow excluding working capital £376m (40) Working capital detail H1 FY24 PBT Non-cash and other Cash Tax Cash profit after tax investment spending Working capital & accruals Free cash flow 442 749 1,151 (775) (76) 300 877 1,549 (140) 2,286 (1,472) (63) 751 Payables (80) Receivables (176) Inventory 184 Other (4) JLR.
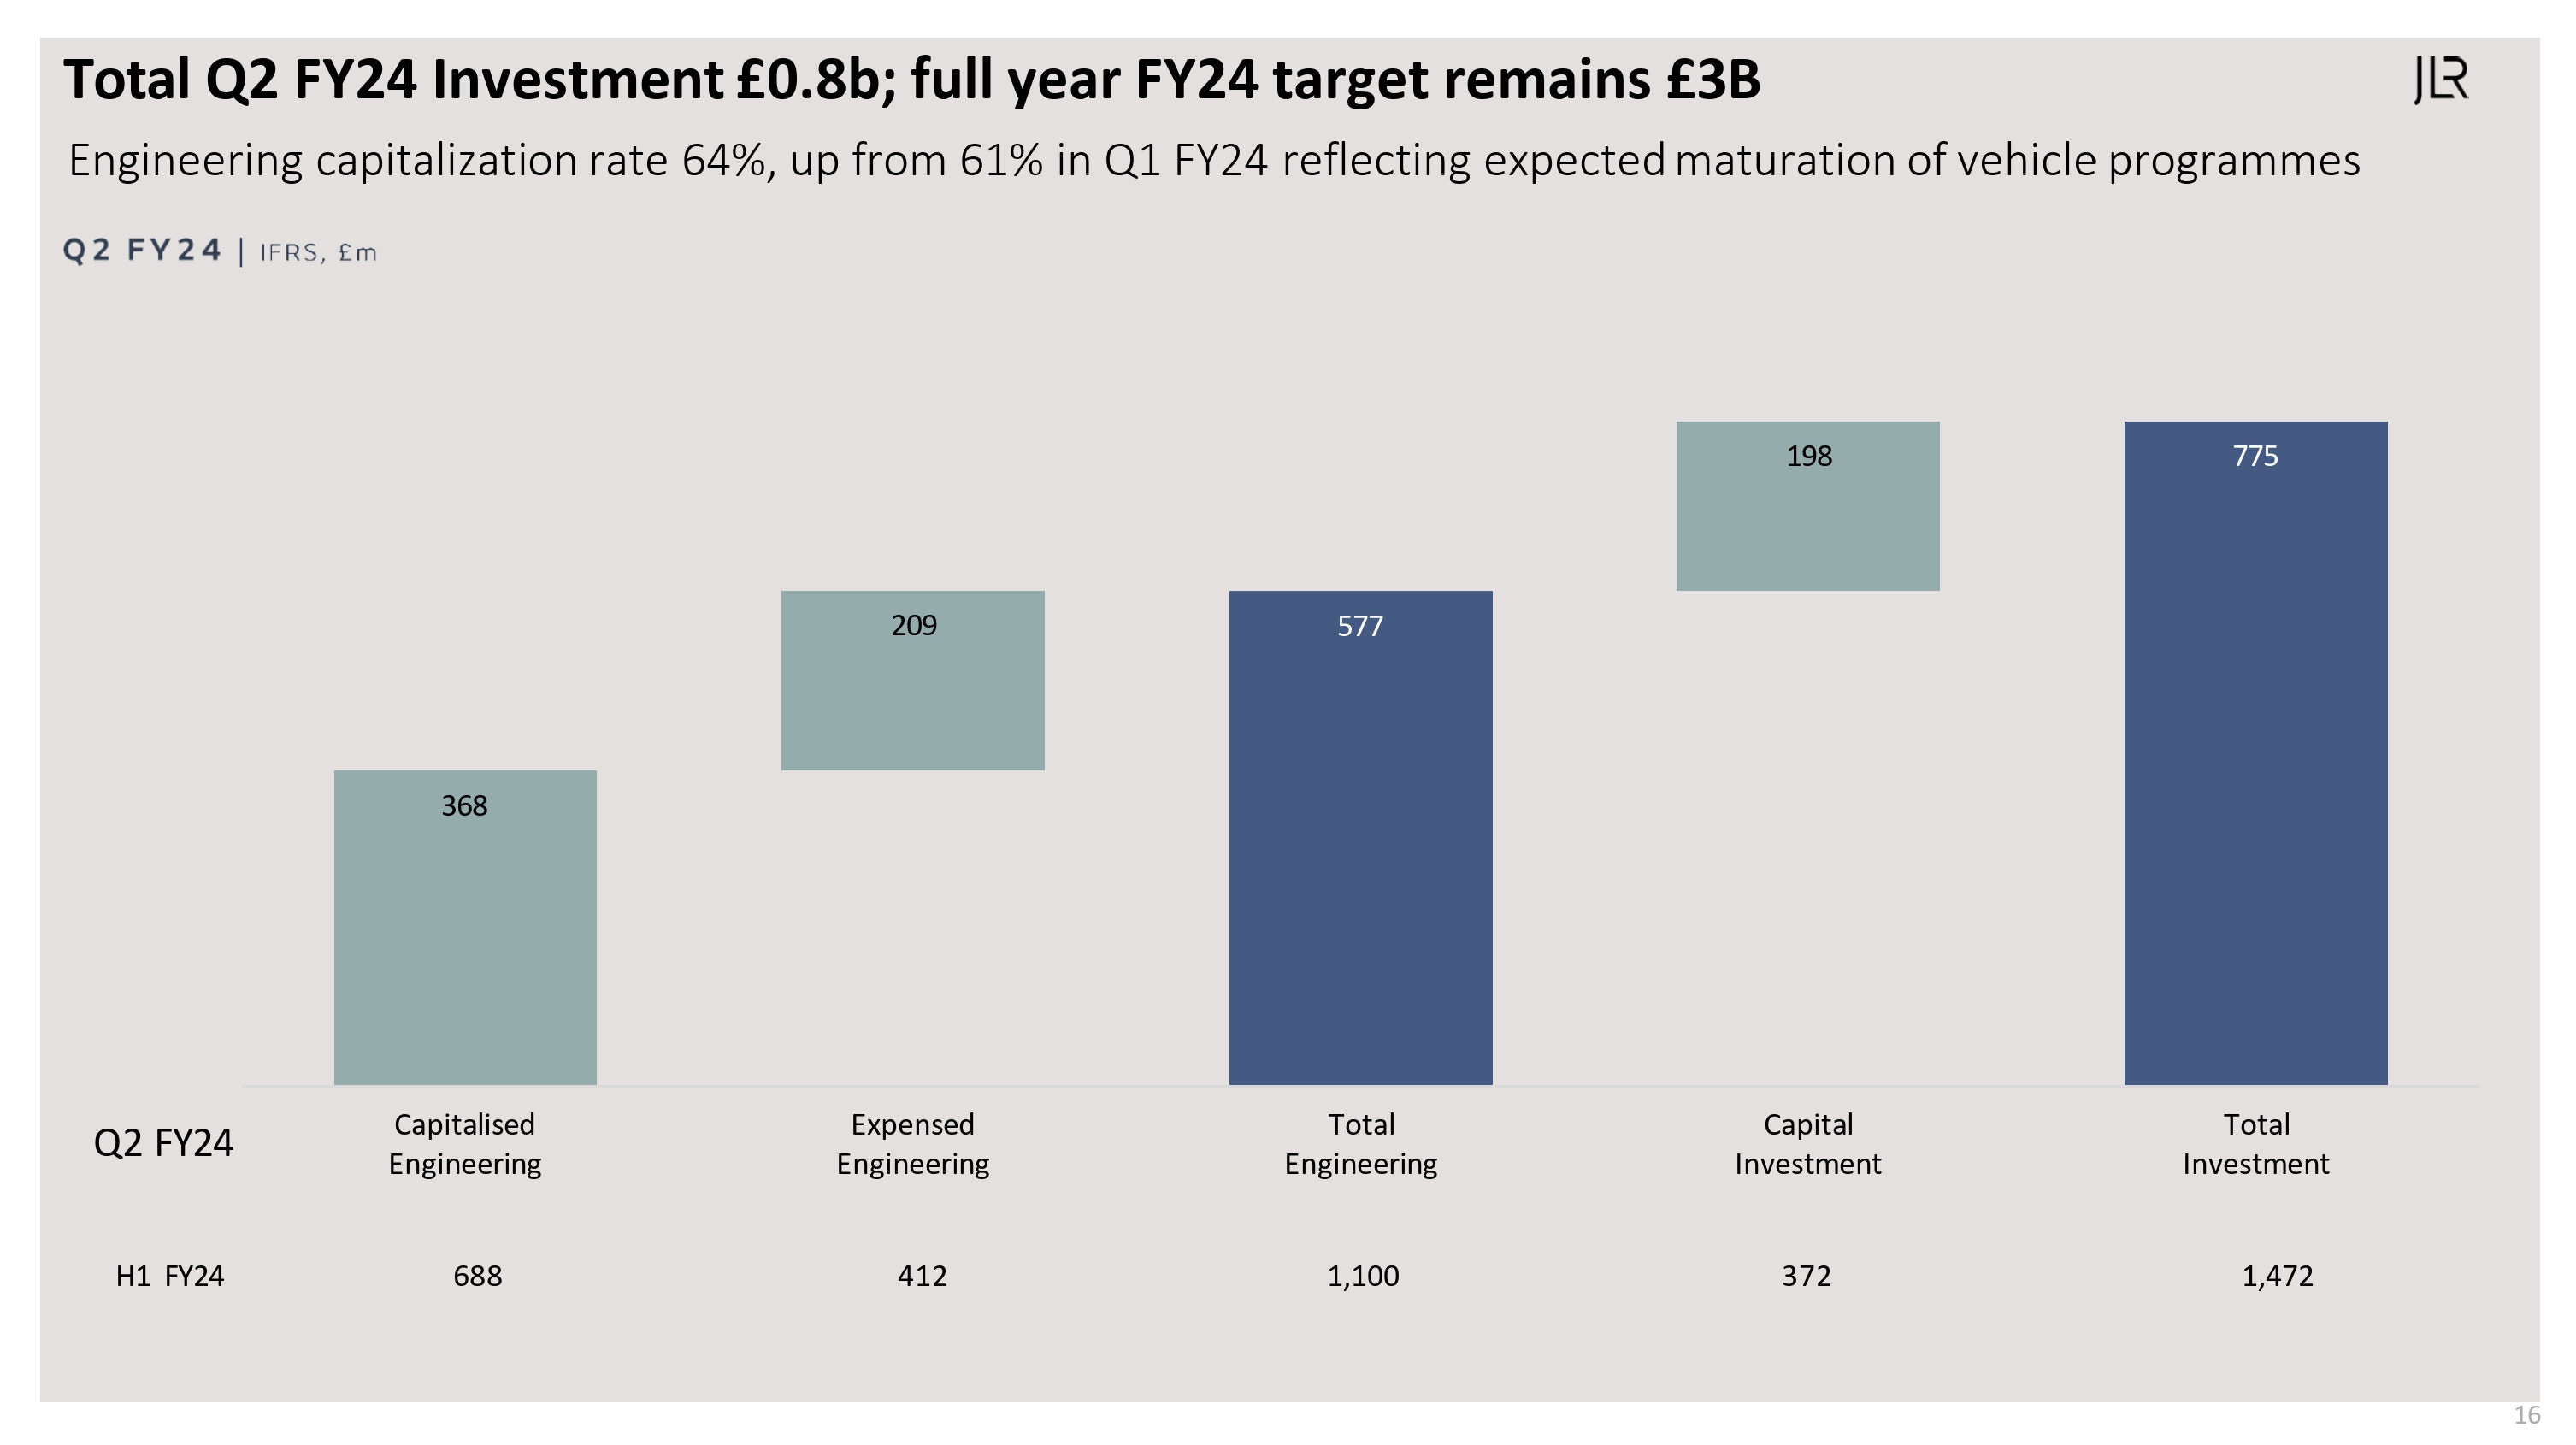
Total Q2 FY24 Investment £0.8b; full year FY24 target remains £3B Engineering capitalization rate 64%, up from 61% in Q1 FY24 reflecting expected maturation of vehicle programmes Q2 FY24 IFPS, £m Q2 FY24 H1 FY24 688 412 1,100 372 1,472 368 209 577 198 775 Capitalised Engineering Expensed Engineering Total Engineering Capital Investment Total Investment JLR.

BUSINESS UPDATE JAGUAR LAND ROVER AUTOMOTIVE PLC JLR.

Easing of Chip and other supply constraints continues Reflects partnership agreements and stronger relationships with key suppliers Units 000 ’ s COMMENTARY Chip and other supply constraints continue to ease in Q2 with the benefit of agreements and relationships with key suppliers Successfully responded to supply chain challenges during the quarter by utilizing better analytics and improved supplier relationships Expect gradual improvement to continue over FY24, but active management still required Q3 & Q4 production and wholesale volumes are expected to improve further WHOLESALE VOLUME Q1 Q2 Q3 Q4 Q1 Q2 Q3 Q4 FY22 FY22 FY22 FY22 FY23 FY23 FY23 FY23 Q1 FY24 Q2 FY24 50 55 60 65 70 75 80 85 90 95 100 JLR.
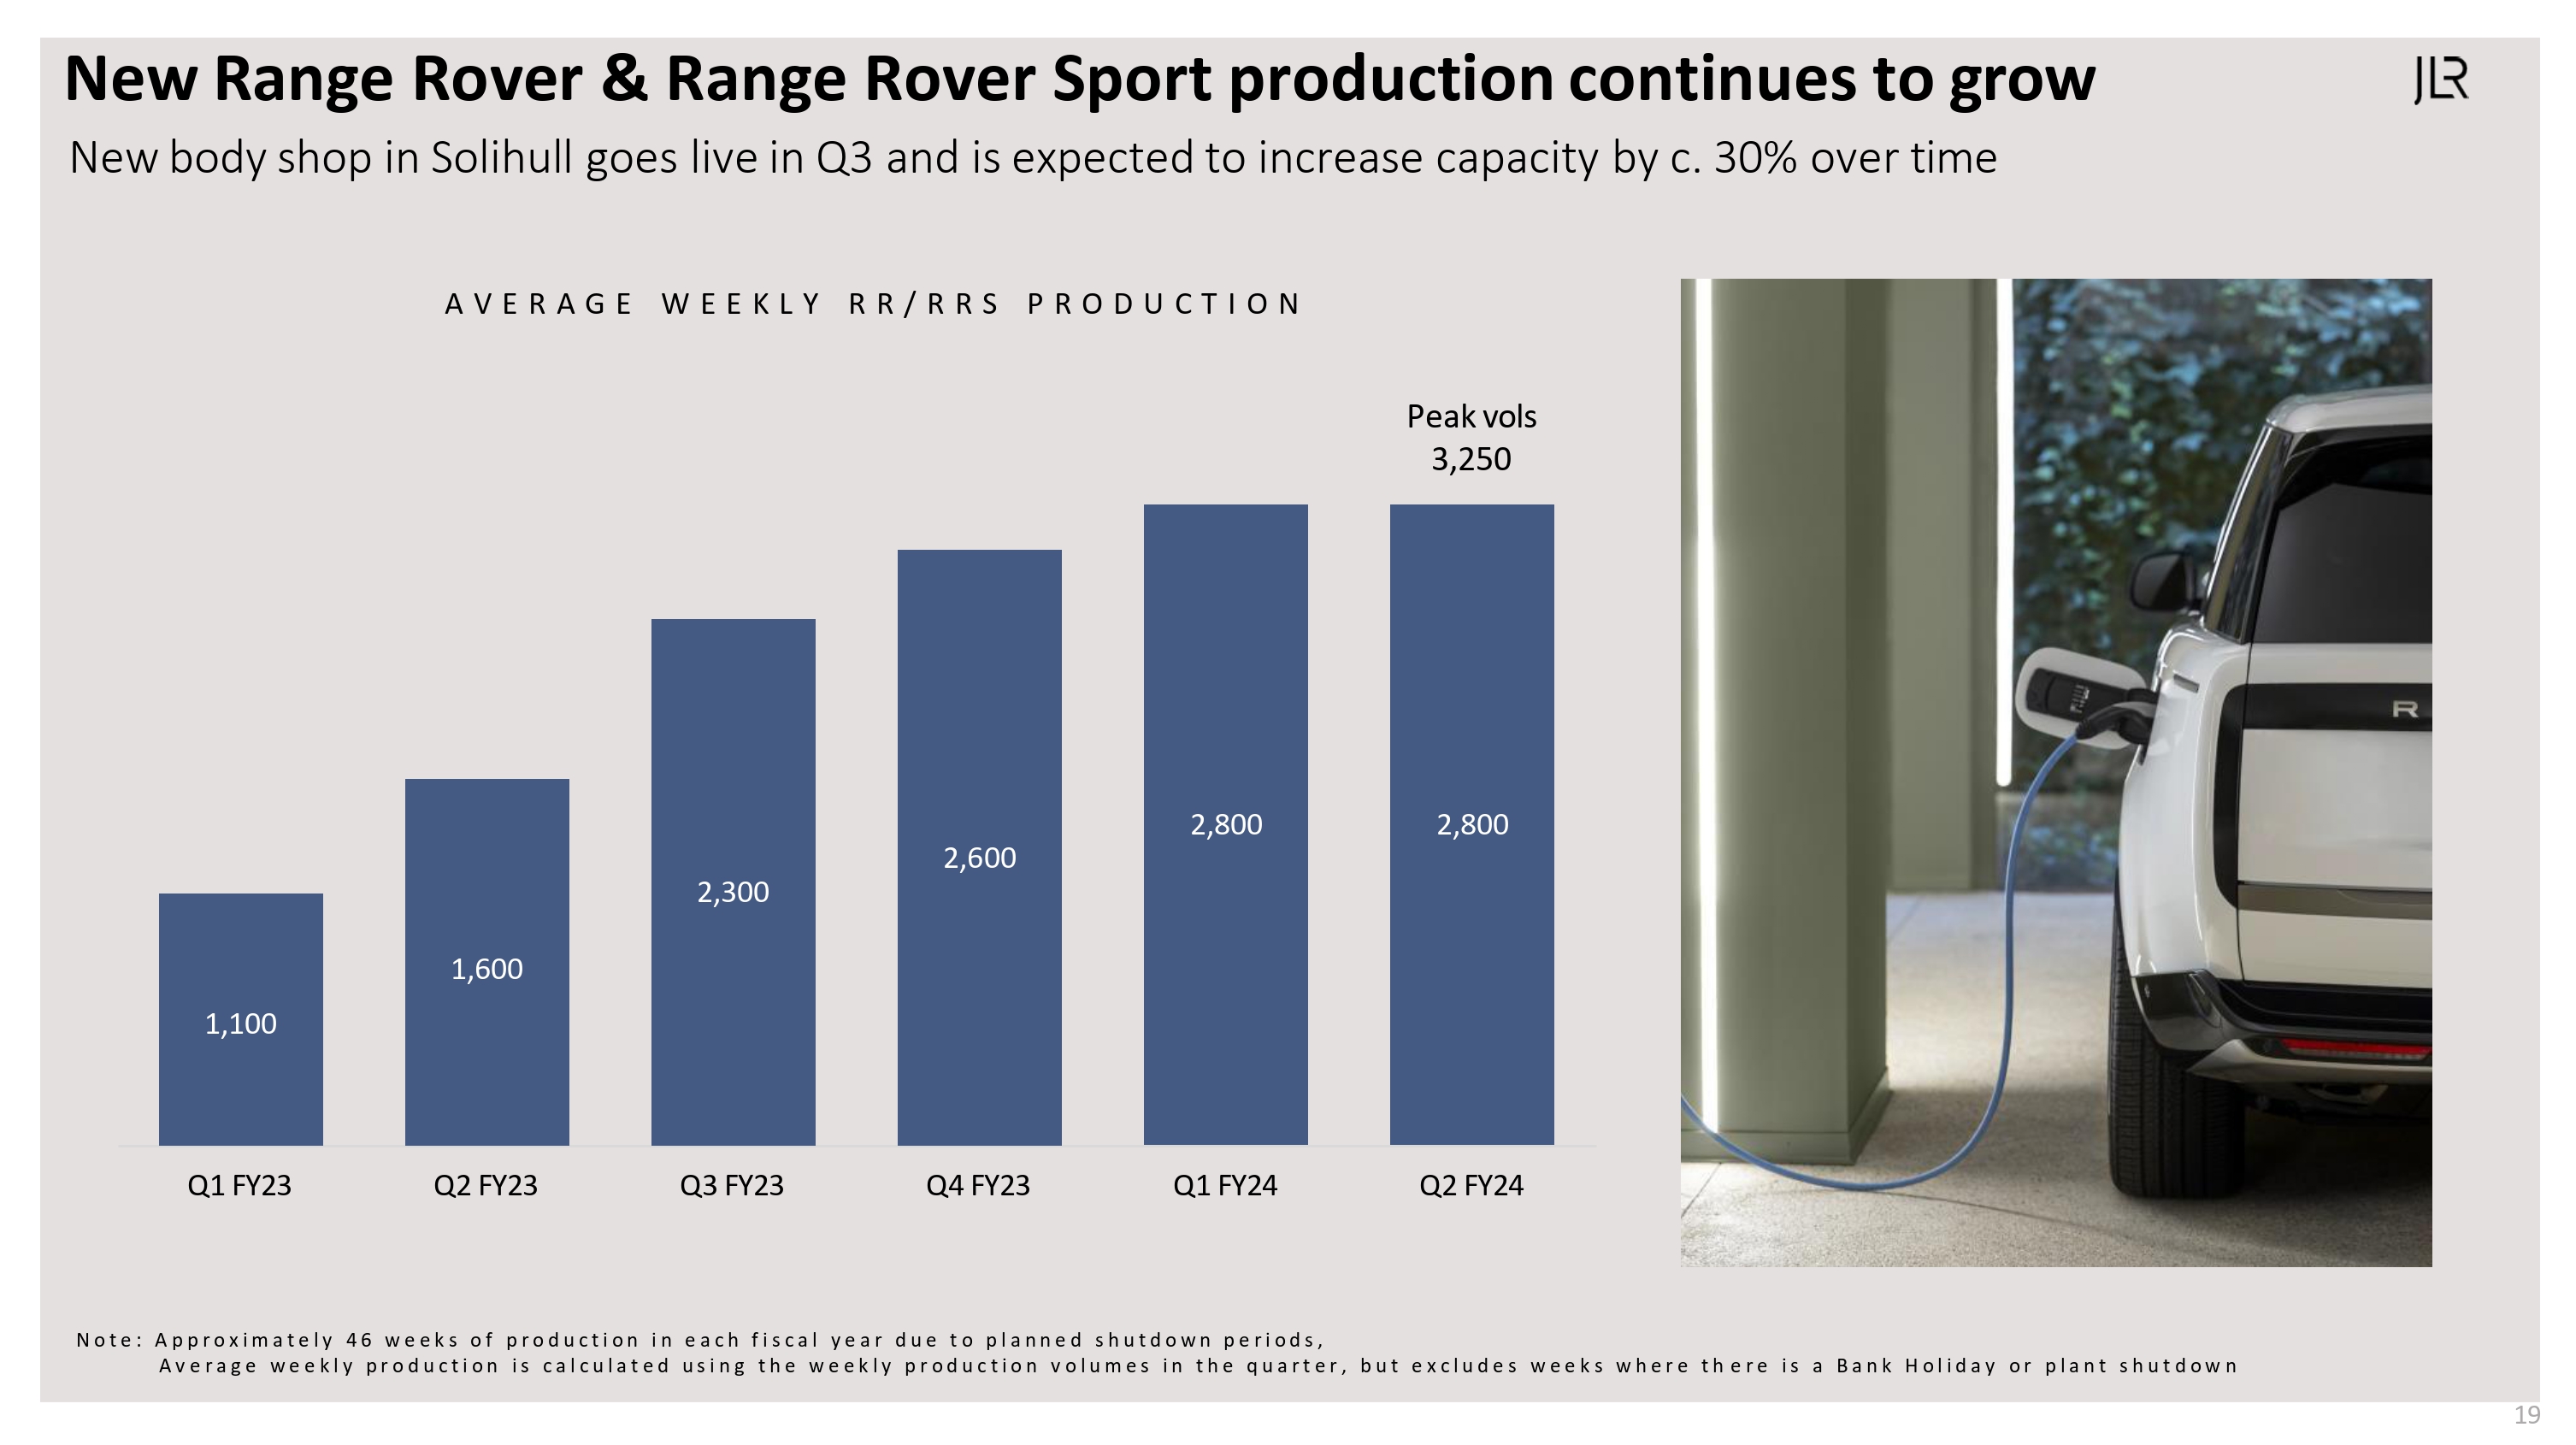
New Range Rover & Range Rover Sport production continues to grow New body shop in Solihull goes live in Q3 and is expected to increase capacity by c. 30% over time AVERAGE WEEKLY RR/RRS PRODUCTION Peak vols 3,250 1,100 1,600 2,300 2,600 2,800 2,800 Q1 FY23 Q2 FY23 Q3 FY23 Q4 FY23 Q1 FY24 Q2 FY24 Note : Approximately 46 weeks of production in each fiscal year due to planned shutdown periods , Average weekly production is calculated using the weekly production volumes in the quarter, but excludes weeks where there is a Bank Holiday or plant shutdown JLR.

Looking ahead Expect improved profitability in FY24 relative to prior guidance OUTLOOK FOR H2 FY 24 Gradual recovery in volumes to continue Expect inflation to moderate EBIT margin now expected to improve to around 8% for FY24 compared to prior guidance of 6% plus Net debt to reduce to <£1bn by end of FY24 PRIORITIES Continue to improve supply availability Focus on brand activation to secure order book Execute Reimagine plans flawlessly JLR.
Tata Commercial Vehicles (Includes Tata CV India, Tata Cummins JO results and Tata CV International) Girish Wagh & PB Balaji 21
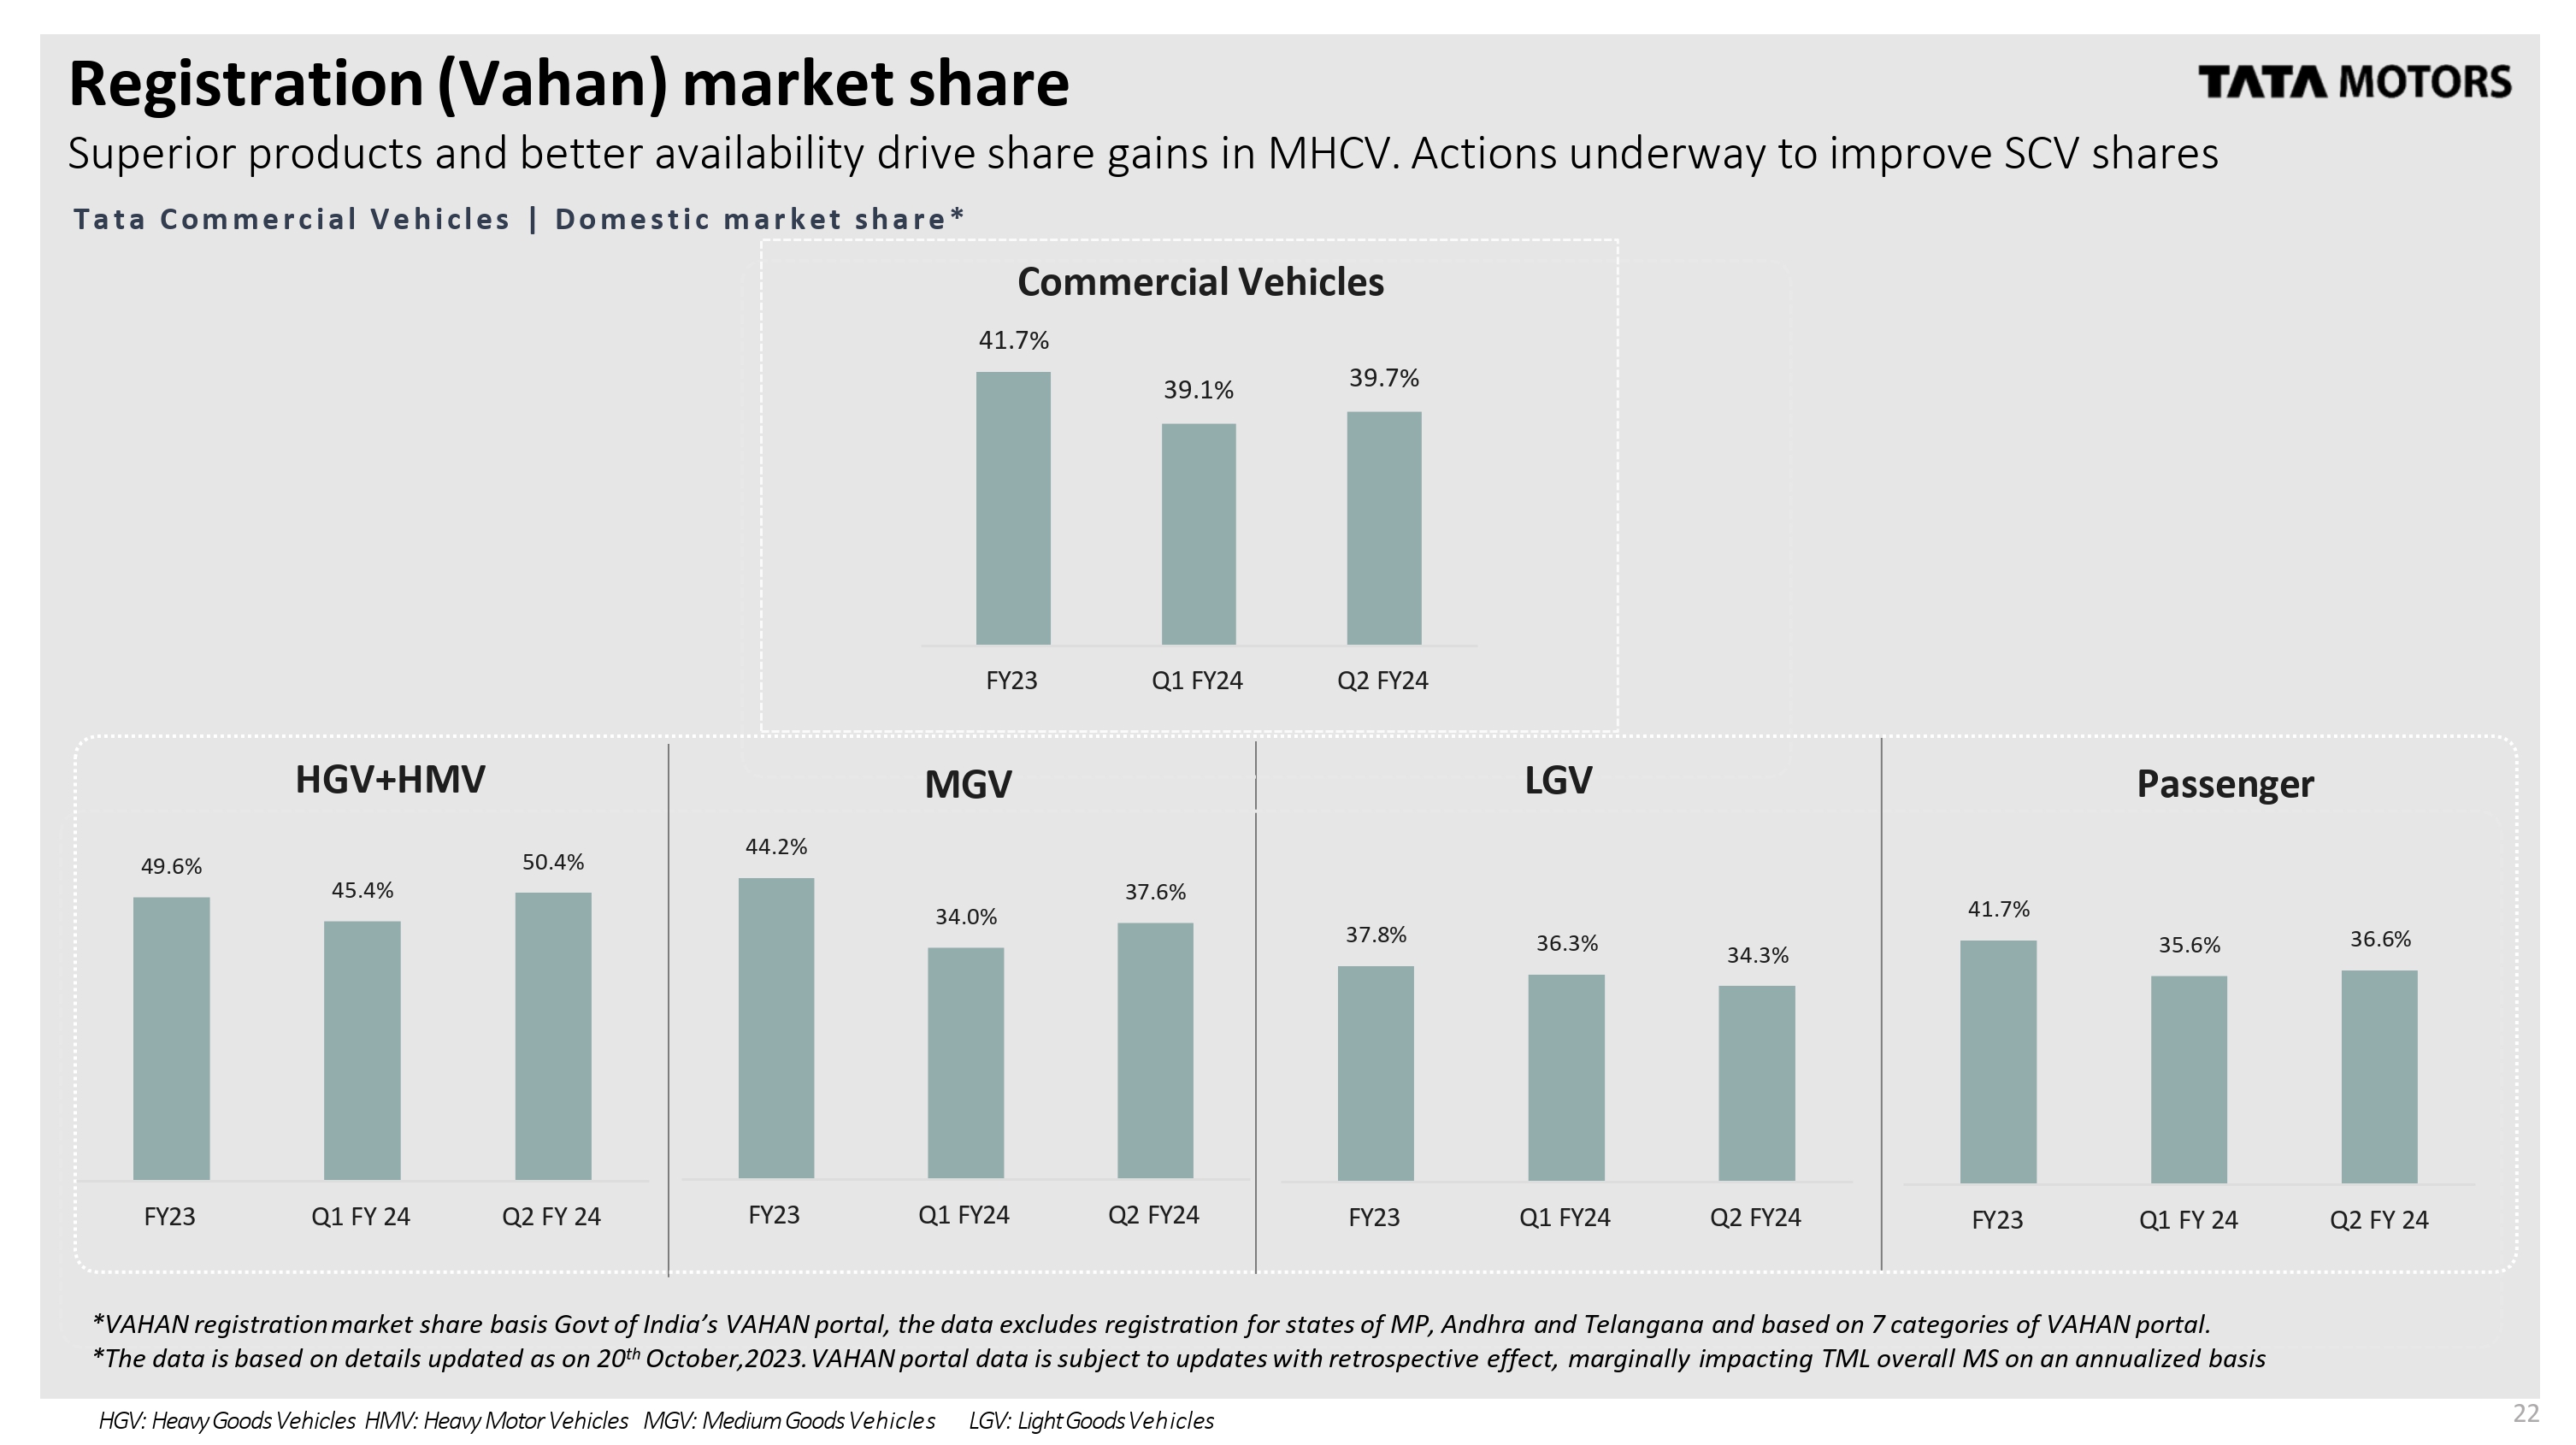
22 Registration (Vahan) market share *VAHAN registration market share basis Govt of India’s VAHAN portal, the data excludes registration for states of MP, Andhra and Telangana and based on 7 categories of VAHAN portal. *The data is based on details updated as on 20th October,2023. VAHAN portal data is subject to updates with retrospective effect, marginally impacting TML overall MS on an annualized basis HGV: Heavy Goods Vehicles HMV: Heavy Motor Vehicles MGV: Medium Goods Vehicles LGV: Light Goods Vehicles 39.1% 39.7% FY23 Q1 FY24 Q2 FY24 Superior products and better availability drive share gains in MHCV. Actions underway to improve SCV shares Tata Commercial Vehicles | Domestic market share * Commercial Vehicles 41.7% 49.6% 45.4% 50.4% FY23 Q1 FY 24 Q2 FY 24 HGV+HMV 44.2% 34.0% 37.6% FY23 Q1 FY24 Q2 FY24 MGV 37.8% 36.3% 34.3% FY23 Q1 FY24 Q2 FY24 LGV 41.7% 35.6% 36.6% FY23 Q1 FY 24 Q2 FY 24 Passenger
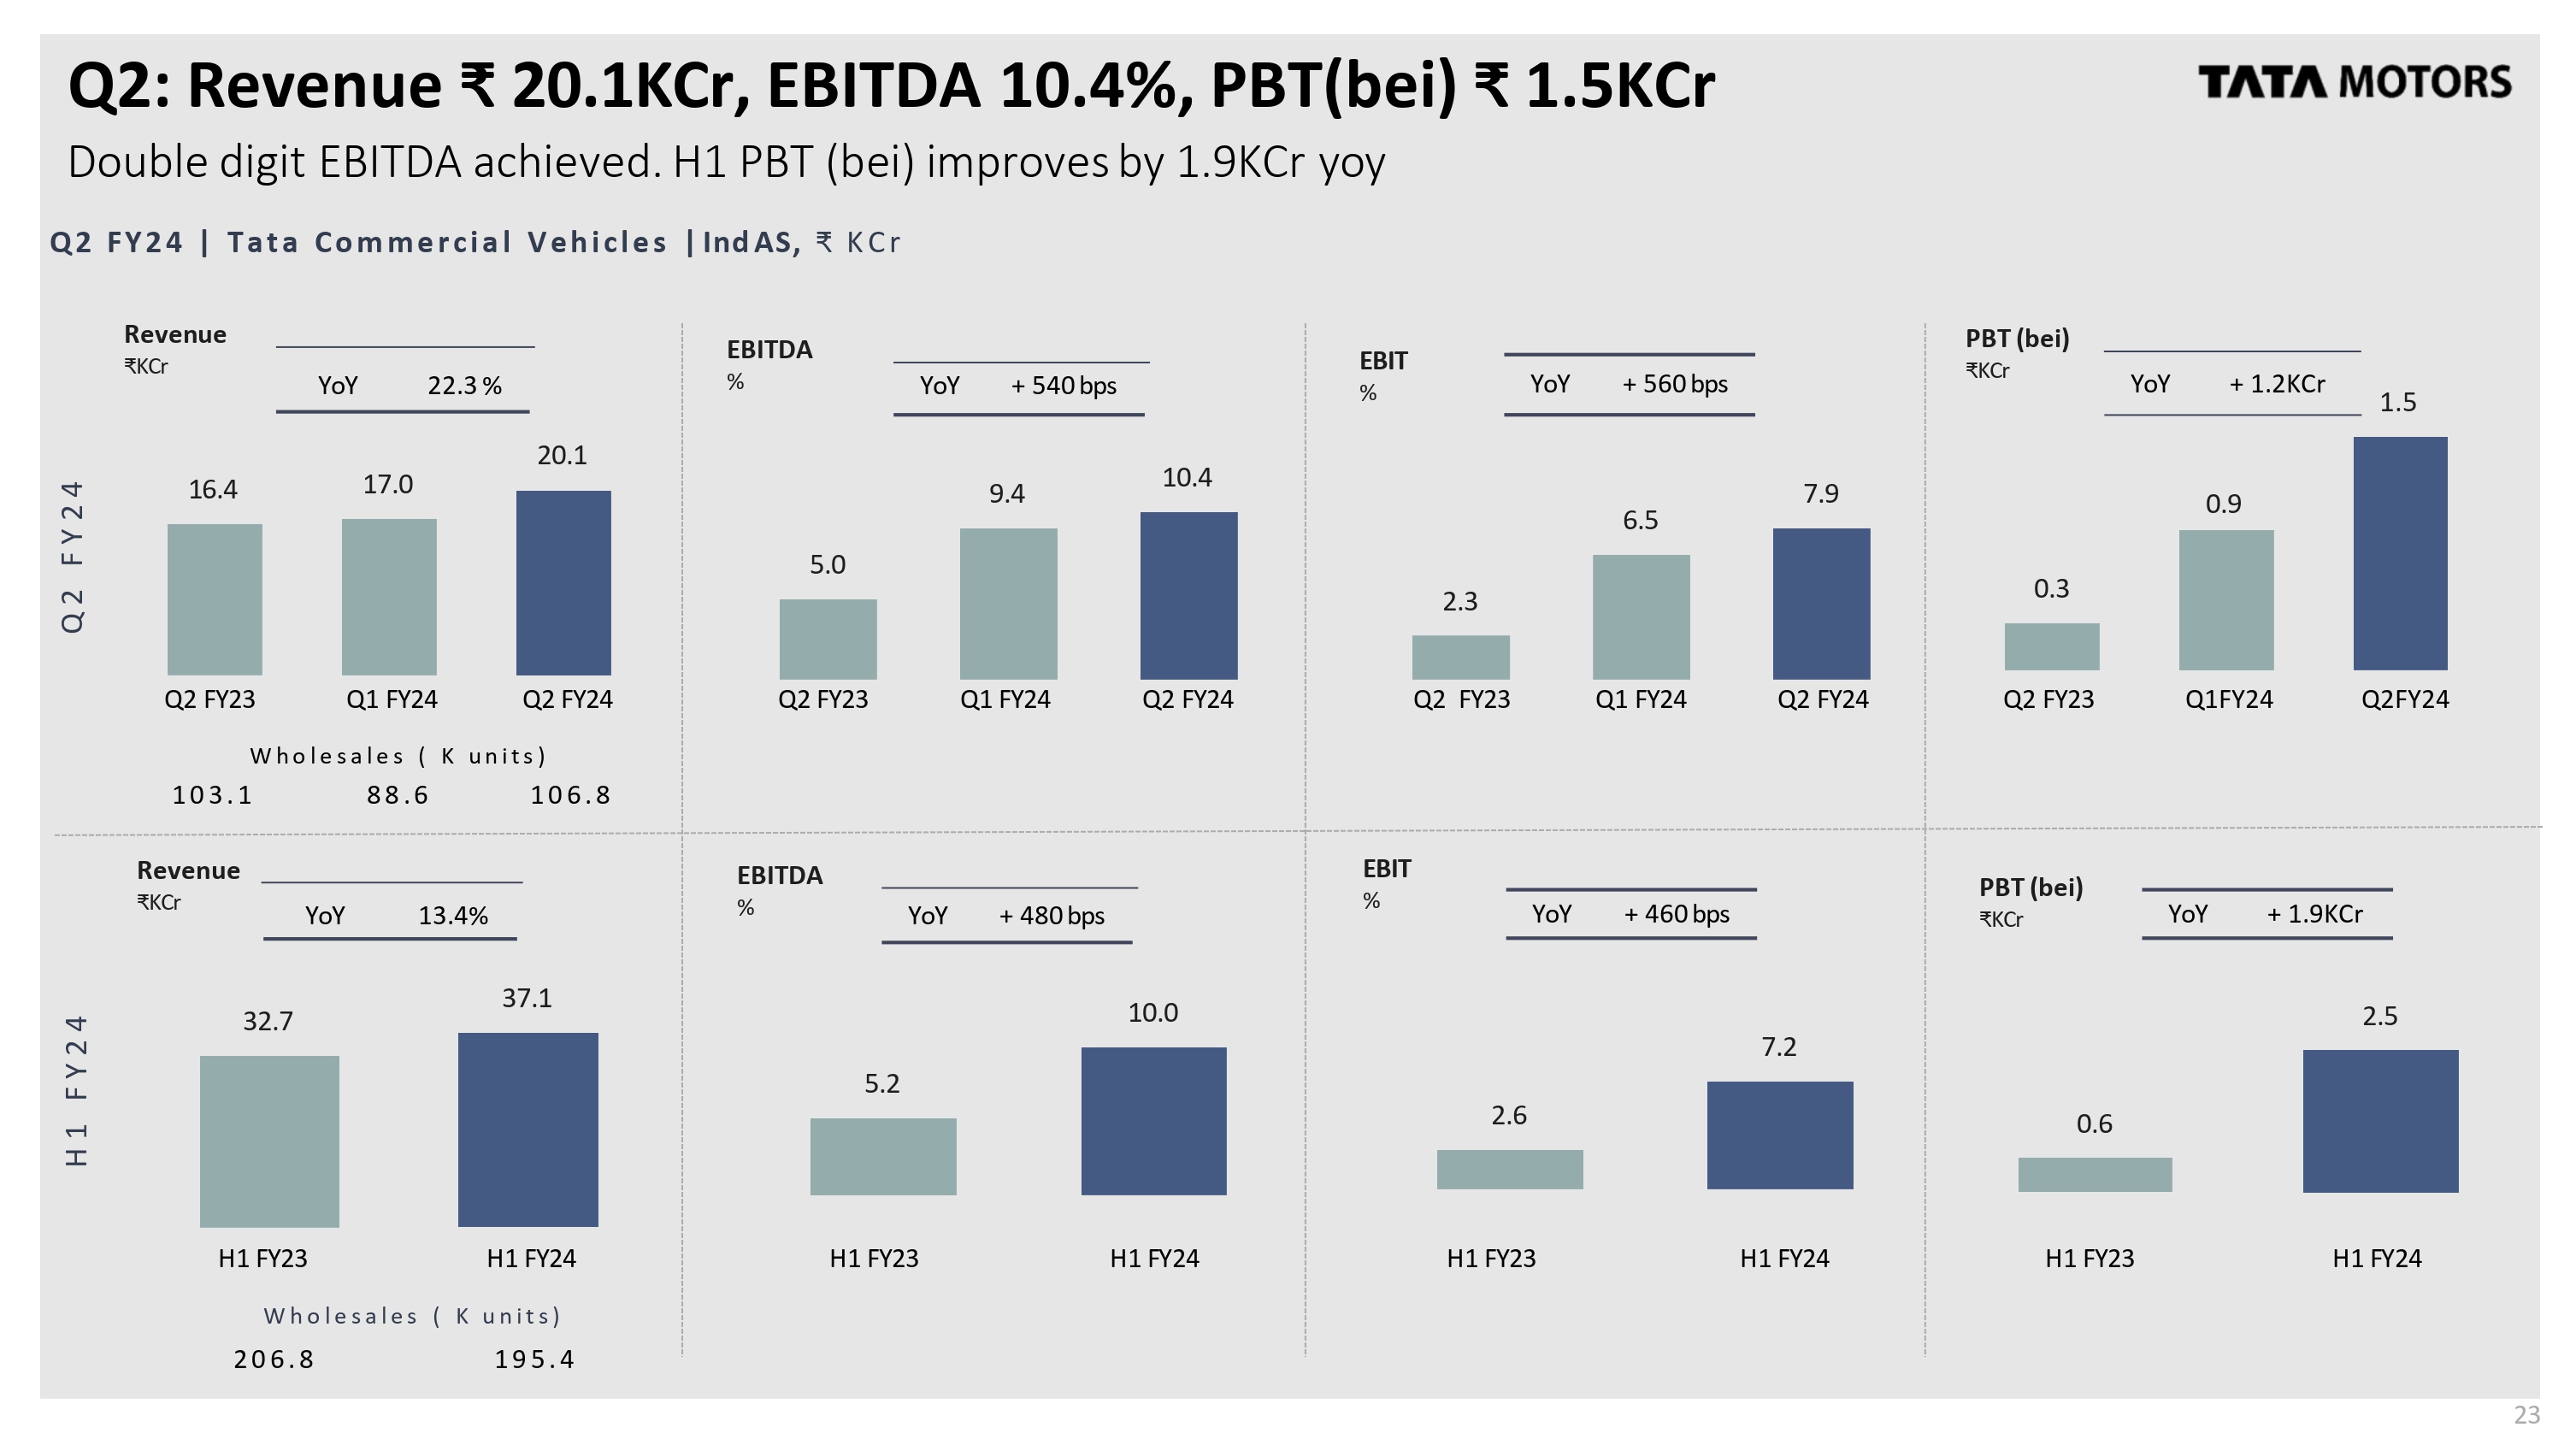
Q2: Revenue ₹ 20.1KCr, EBITDA 10.4%, PBT (bei) ₹ 1.5KCr Double digit EBITDA achieved. H1 PBT (bei) improves by 1.9KCr yoy Q 2 F Y 2 4 | T a t a C o m m e r c i a l V e h i c l e s | Ind AS, ₹ K C r 0.3 0.9 1.5 PBT (bei) ₹KCr 16.4 17.0 20.1 Revenue ₹KCr 5.0 9.4 10.4 EBITDA % YoY 22.3 % YoY + 540 bps 1 0 6. 8 Q 2 F Y 2 4 H 1 F Y 2 4 0.6 2.5 PBT (bei) ₹KCr 32.7 37.1 5.2 10.0 EBITDA % YoY 13.4% YoY + 480 bps Q2 FY23 Q1 FY24 Q2 FY24 Wholesales (K units) Q2 FY23 Q1 FY24 Q2 FY24 Q2 FY23 Q1 FY24 Q2 FY24 Q2 FY23 Q1FY24 Q2FY24 H1 FY23 H1 FY24 H1 FY23 H1 FY24 H1 FY23 H1 FY24 2.3 23 6.5 7.9 EBIT % YoY + 560 bps 2.6 7.2 EBIT % YoY + 460 bps YoY + 1.9KCr 1 0 3. 1 8 8. 6 Revenue ₹KCr H1 FY23 H1 FY24 Wholesales (K units) 2 0 6. 8 1 9 5. 4 YoY + 1.2KCr
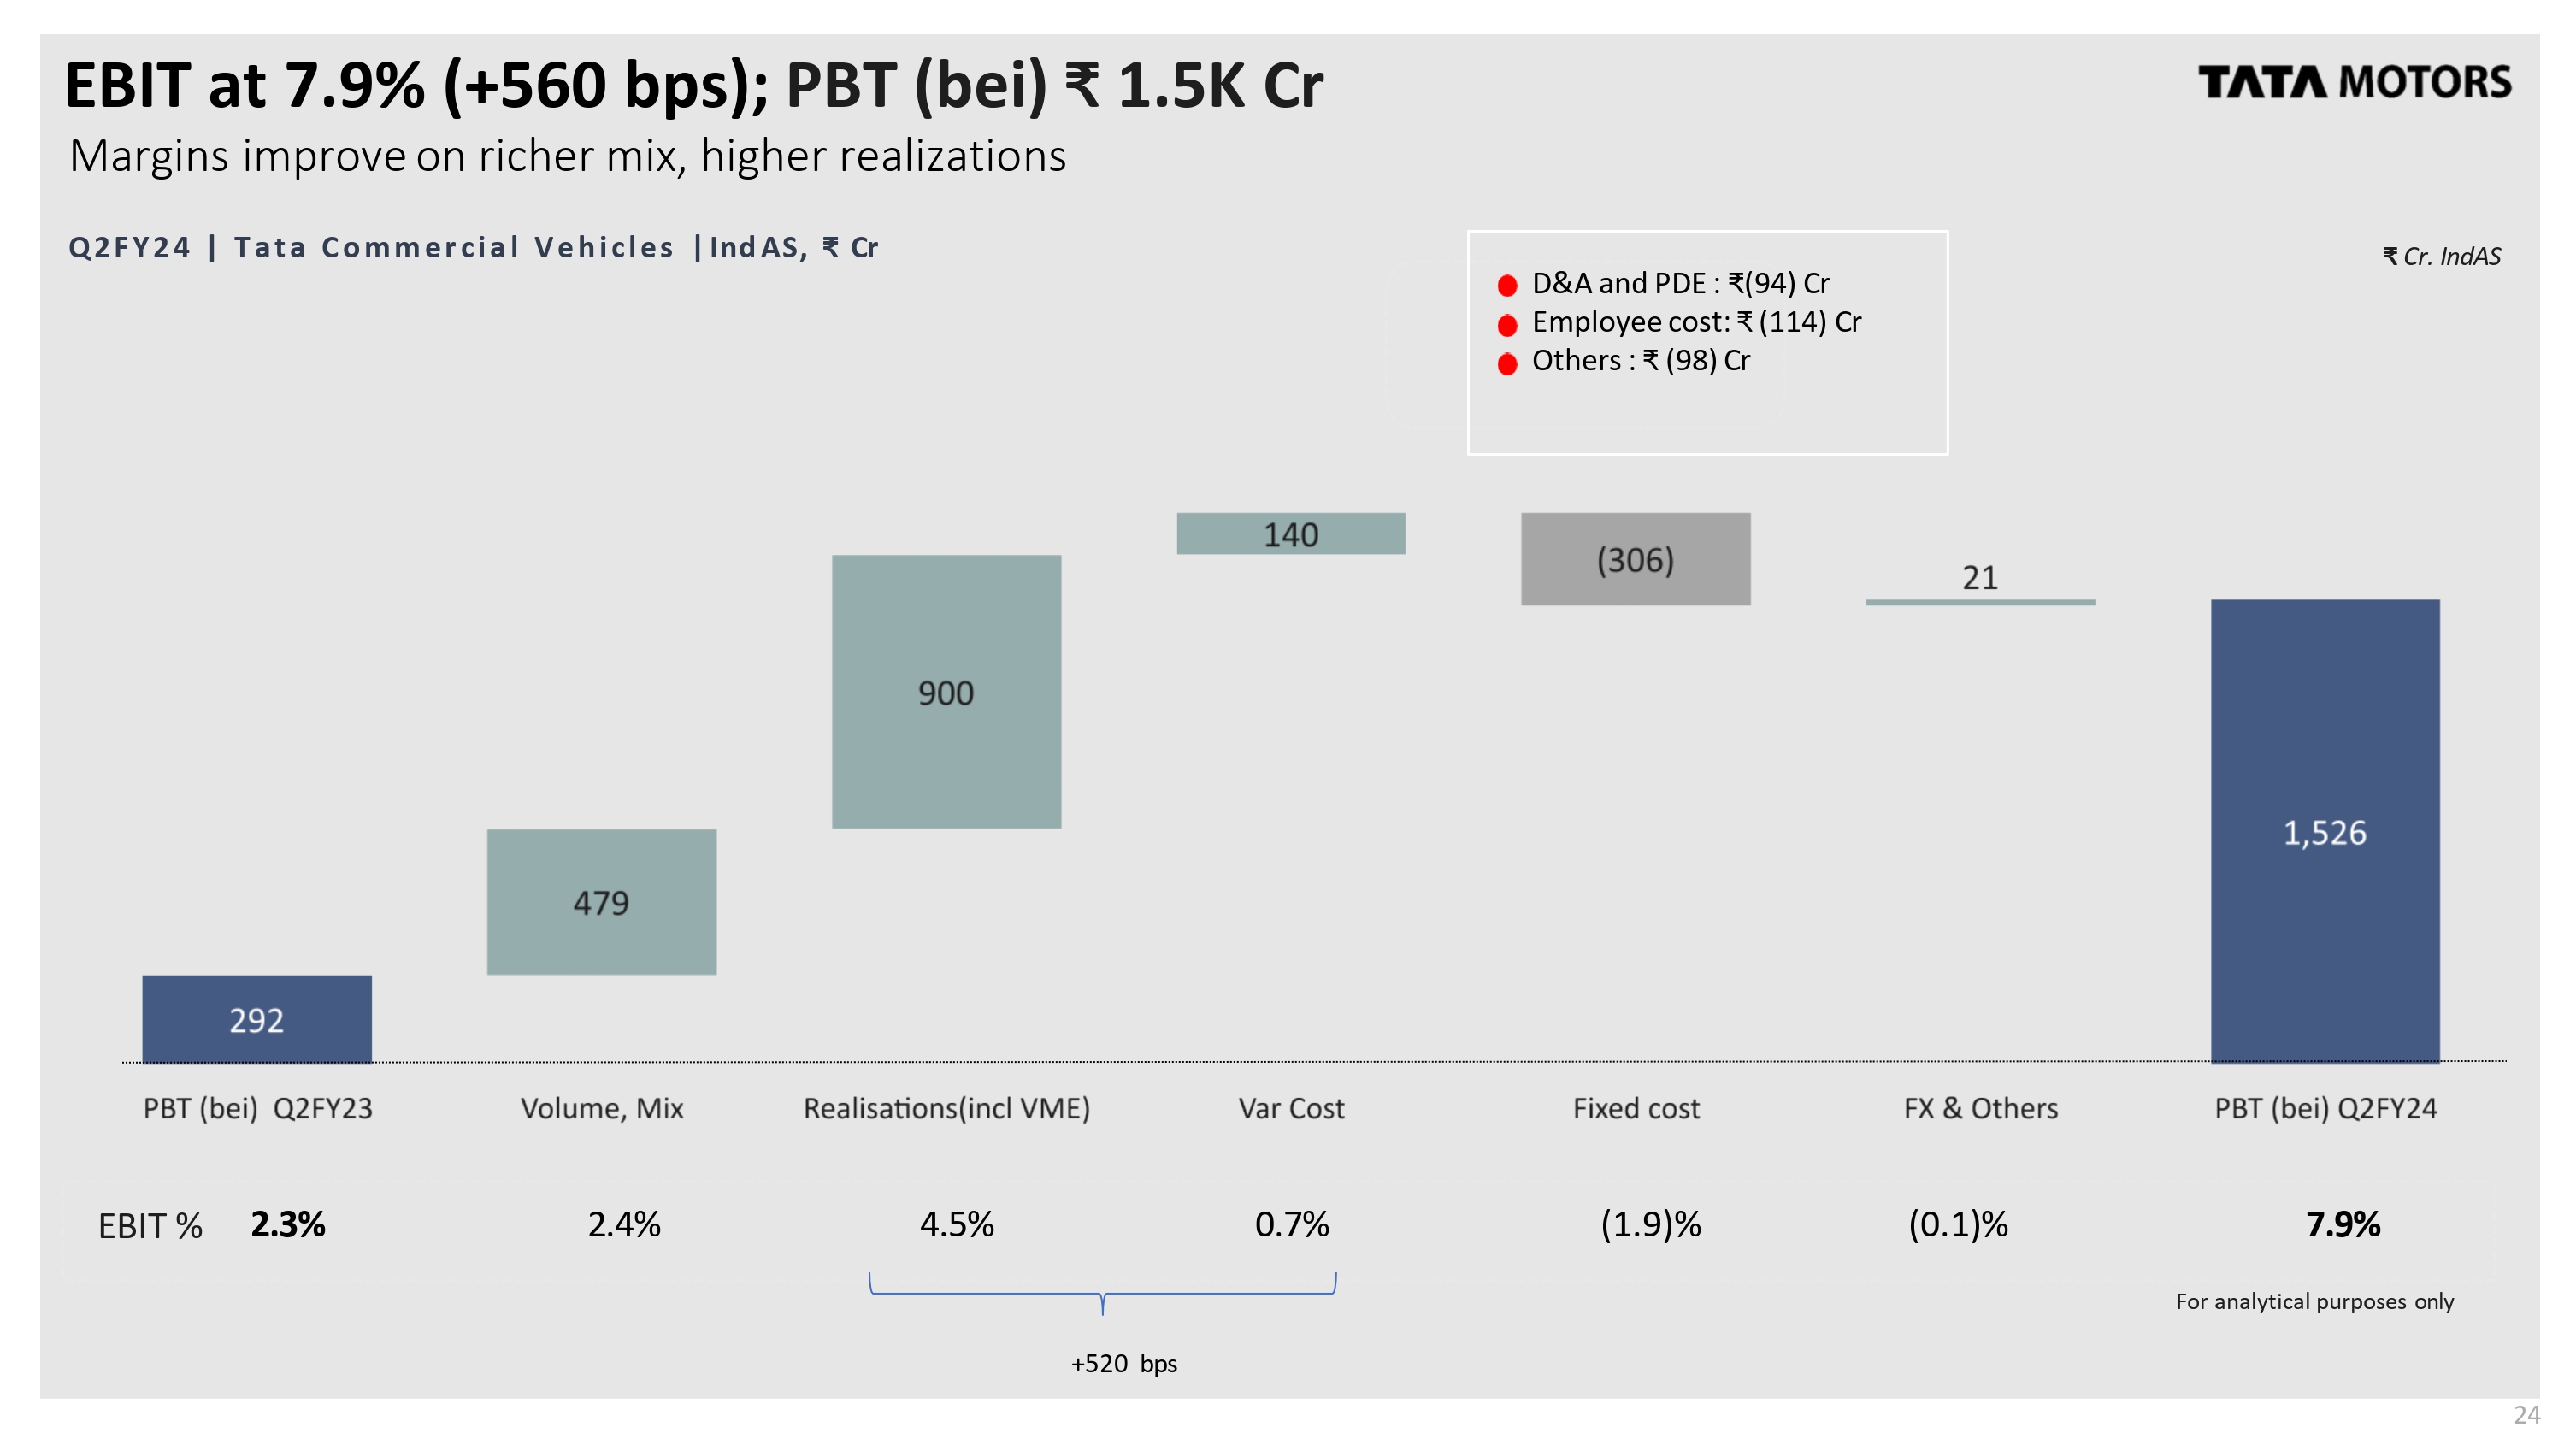
EBIT at 7.9% (+560 bps); PBT (bei) ₹ 1.5K Cr Margins improve on richer mix, higher realizations For analytical purposes only EBIT % 2.3% 2.4% 4.5% 0.7% (1.9)% (0.1)% 7.9% ₹ Cr. Ind AS D&A and PDE : ₹(94) Cr Employee cost: ₹ (114) Cr Others : ₹ (98) Cr Q2FY24 | Tata Commercial Vehicles | Ind AS, ₹ Cr 24 +520 bps PBT (bei) Q2FY23 Volume, mix realizations(incl VME) var Cost Fixed cost FX & Others PBT (bei) Q2FY24 292 479 900 140 (306) 21 1,526

Tata Commercial Vehicles – Business update Key Highlights Bright Spots Focus areas • Customer Sentiment Index, remained firm or improved across segments 25 • All the production bottlenecks have been addressed, and additional 223 variants have been introduced in Q2 • Commodity softened in Q2 thereby providing tailwind for the margins, in addition to significant cost reduction efforts and improving realizations • Improved VAHAN share in Q2 vs Q1 FY24, after impacted by BS6 Phase 2 availability constraints in Q1. • Gained share month over month in HCV, ILMCV and CVP, but dropped in SCVPU in Q2. Action plans underway to fix the same • MHCVs grew by 24% over Q2 FY23. Passenger carriers by 32% over Q2 FY23 • Non-vehicle-business revenue grew by 20% over Q2 FY23. • 17% of sales were generated through digital channels. • Continue to drive realization improvement and grow Vahan share leveraging superior product range • Differentiated focus on SCV portfolio to drive profitable competitive growth. • Scale up EV supplies (ACE EV & E-Buses) • Continue growth in downstream with increase in service and spare penetration • International markets: Focus on maintaining market shares, margins and channel health as most markets operate at lower volumes
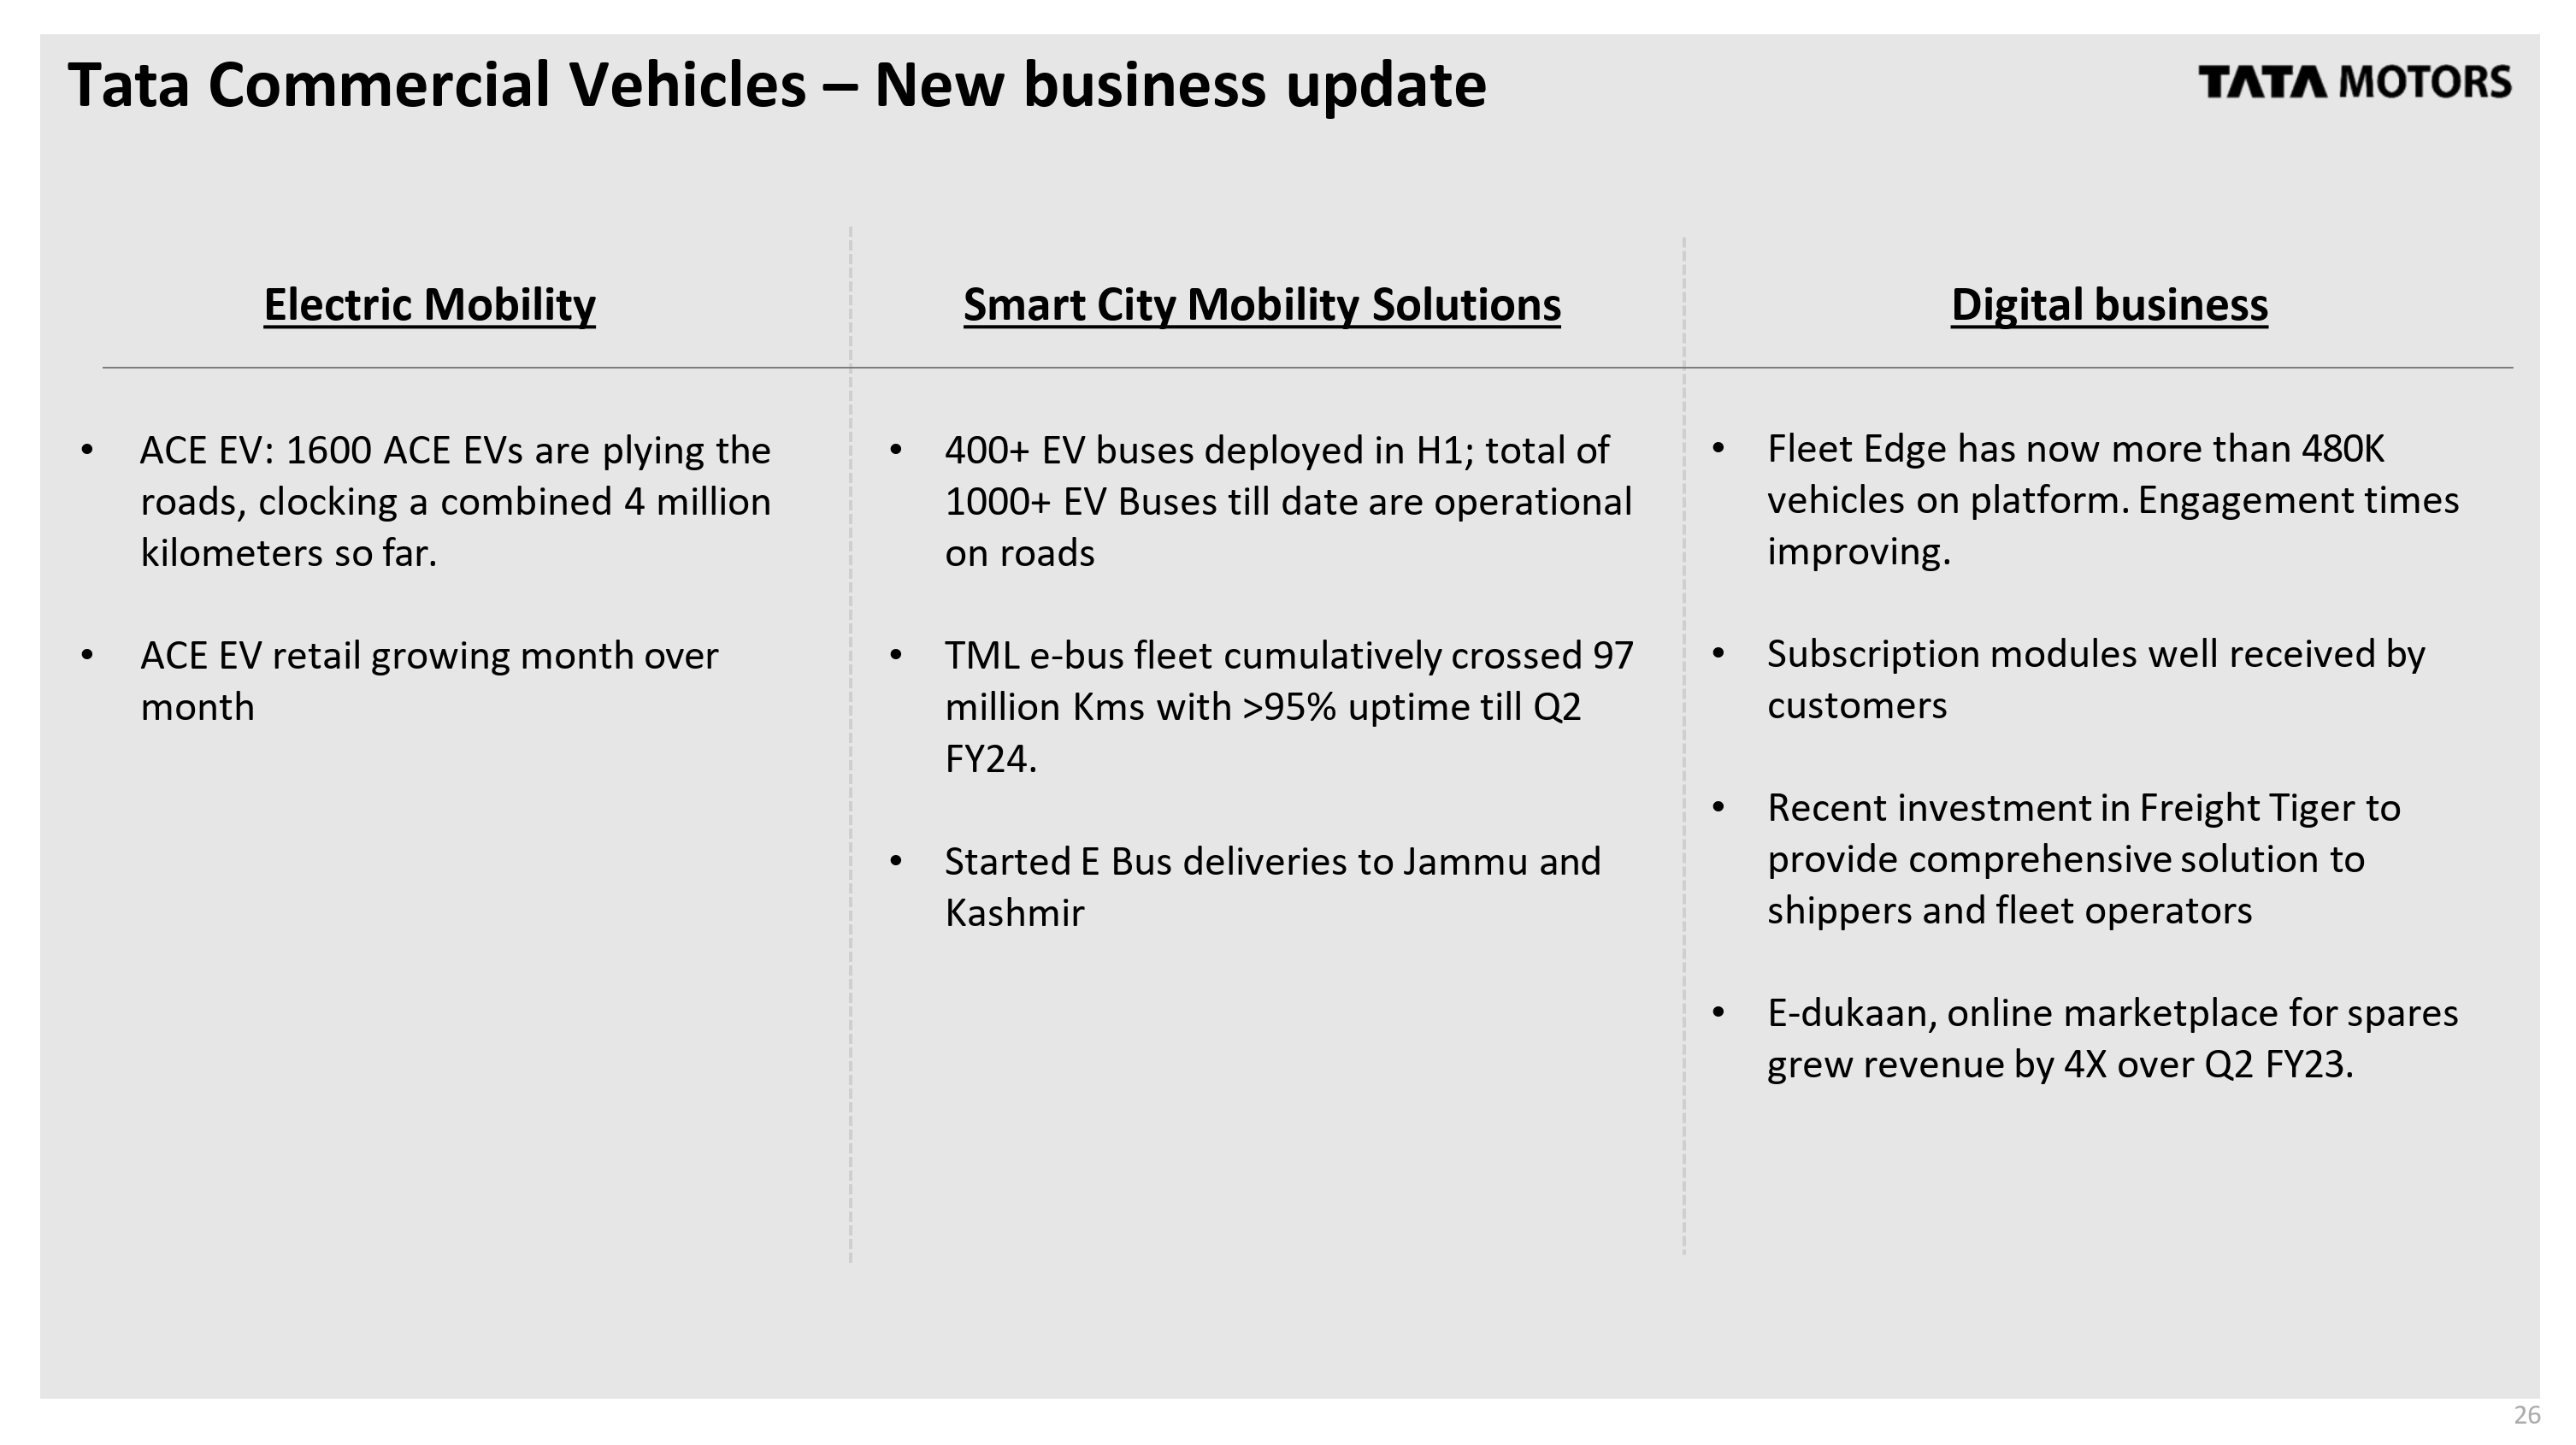
Tata Commercial Vehicles – New business update Electric Mobility Smart City Mobility Solutions Digital business • 400+ EV buses deployed in H1; total of 1000+ EV Buses till date are operational on roads 26 • TML e-bus fleet cumulatively crossed 97 million Kms with >95% uptime till Q2 FY24. • Started E Bus deliveries to Jammu and Kashmir • ACE EV: 1600 ACE EVs are plying the roads, clocking a combined 4 million kilometers so far. • ACE EV retail growing month over month • Fleet Edge has now more than 480K vehicles on platform. Engagement times improving. • Subscription modules well received by customers • Recent investment in Freight Tiger to provide comprehensive solution to shippers and fleet operators • E-dukaan, online marketplace for spares grew revenue by 4X over Q2 FY23.
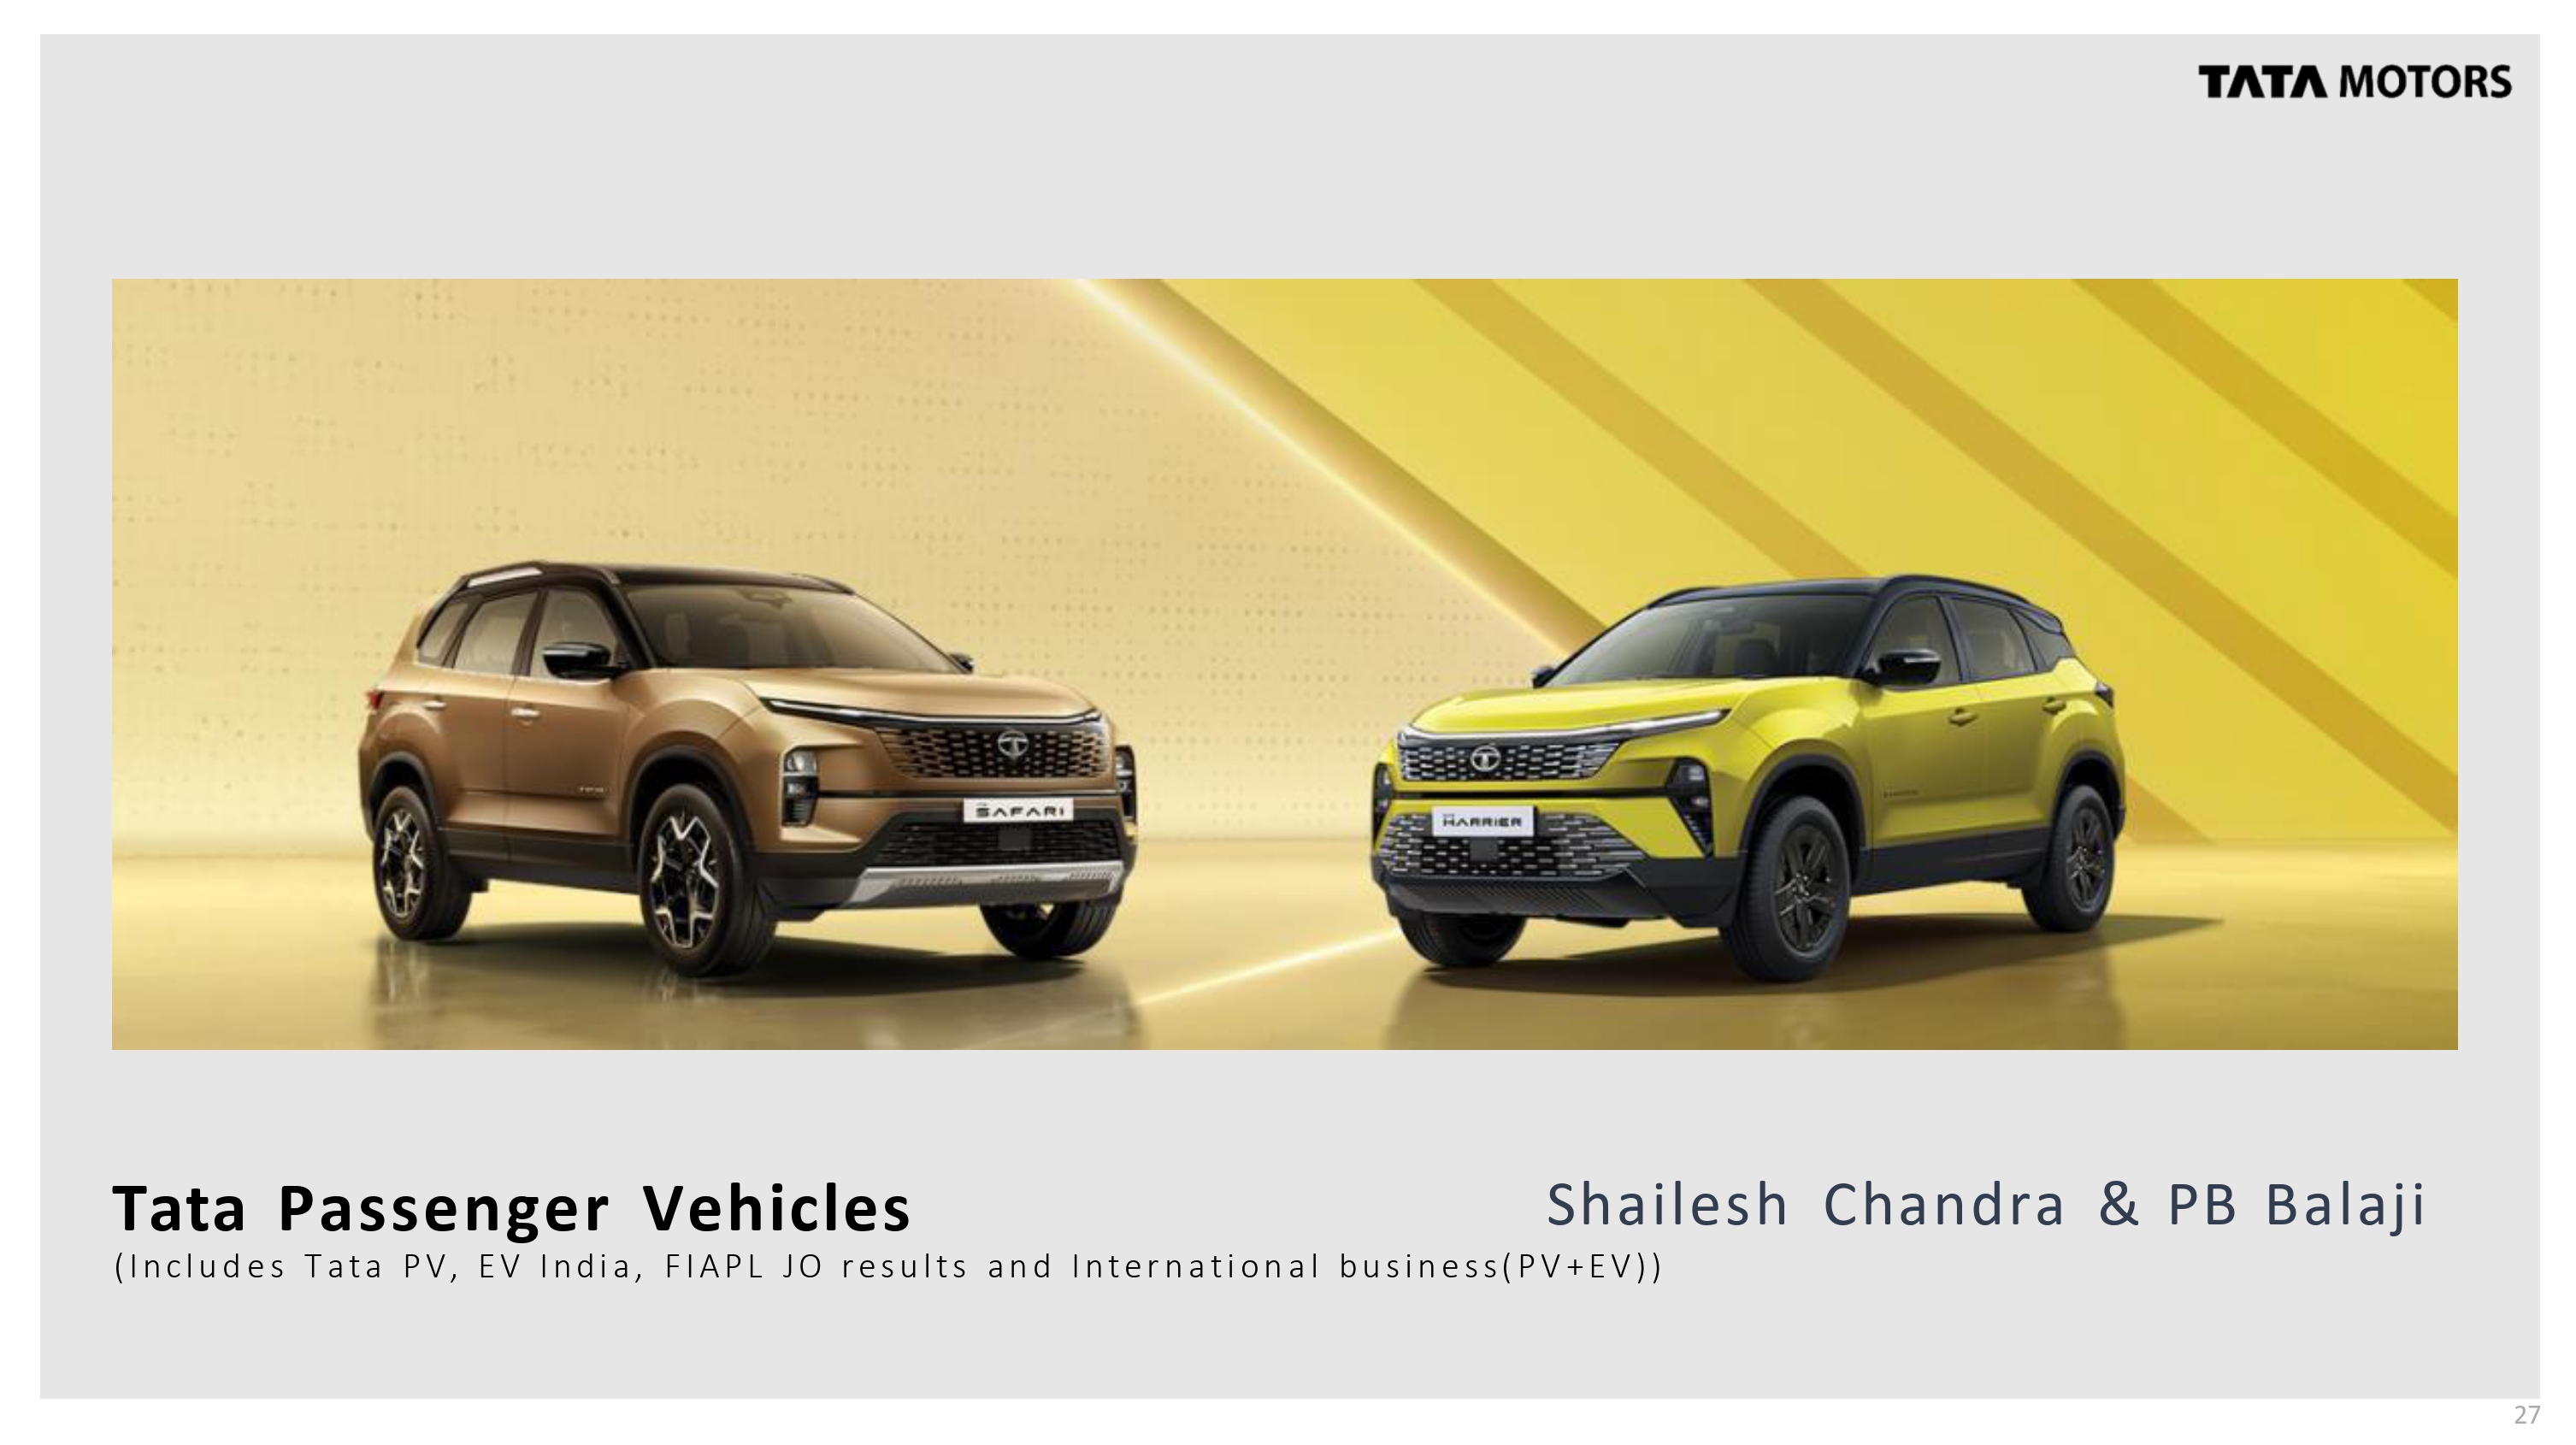
Tata Passenger Vehicles Shailesh Chandra & PB Balaji (Includes Tata PV, EV India, FIAPL JO results and international business (PV+EV)) 27
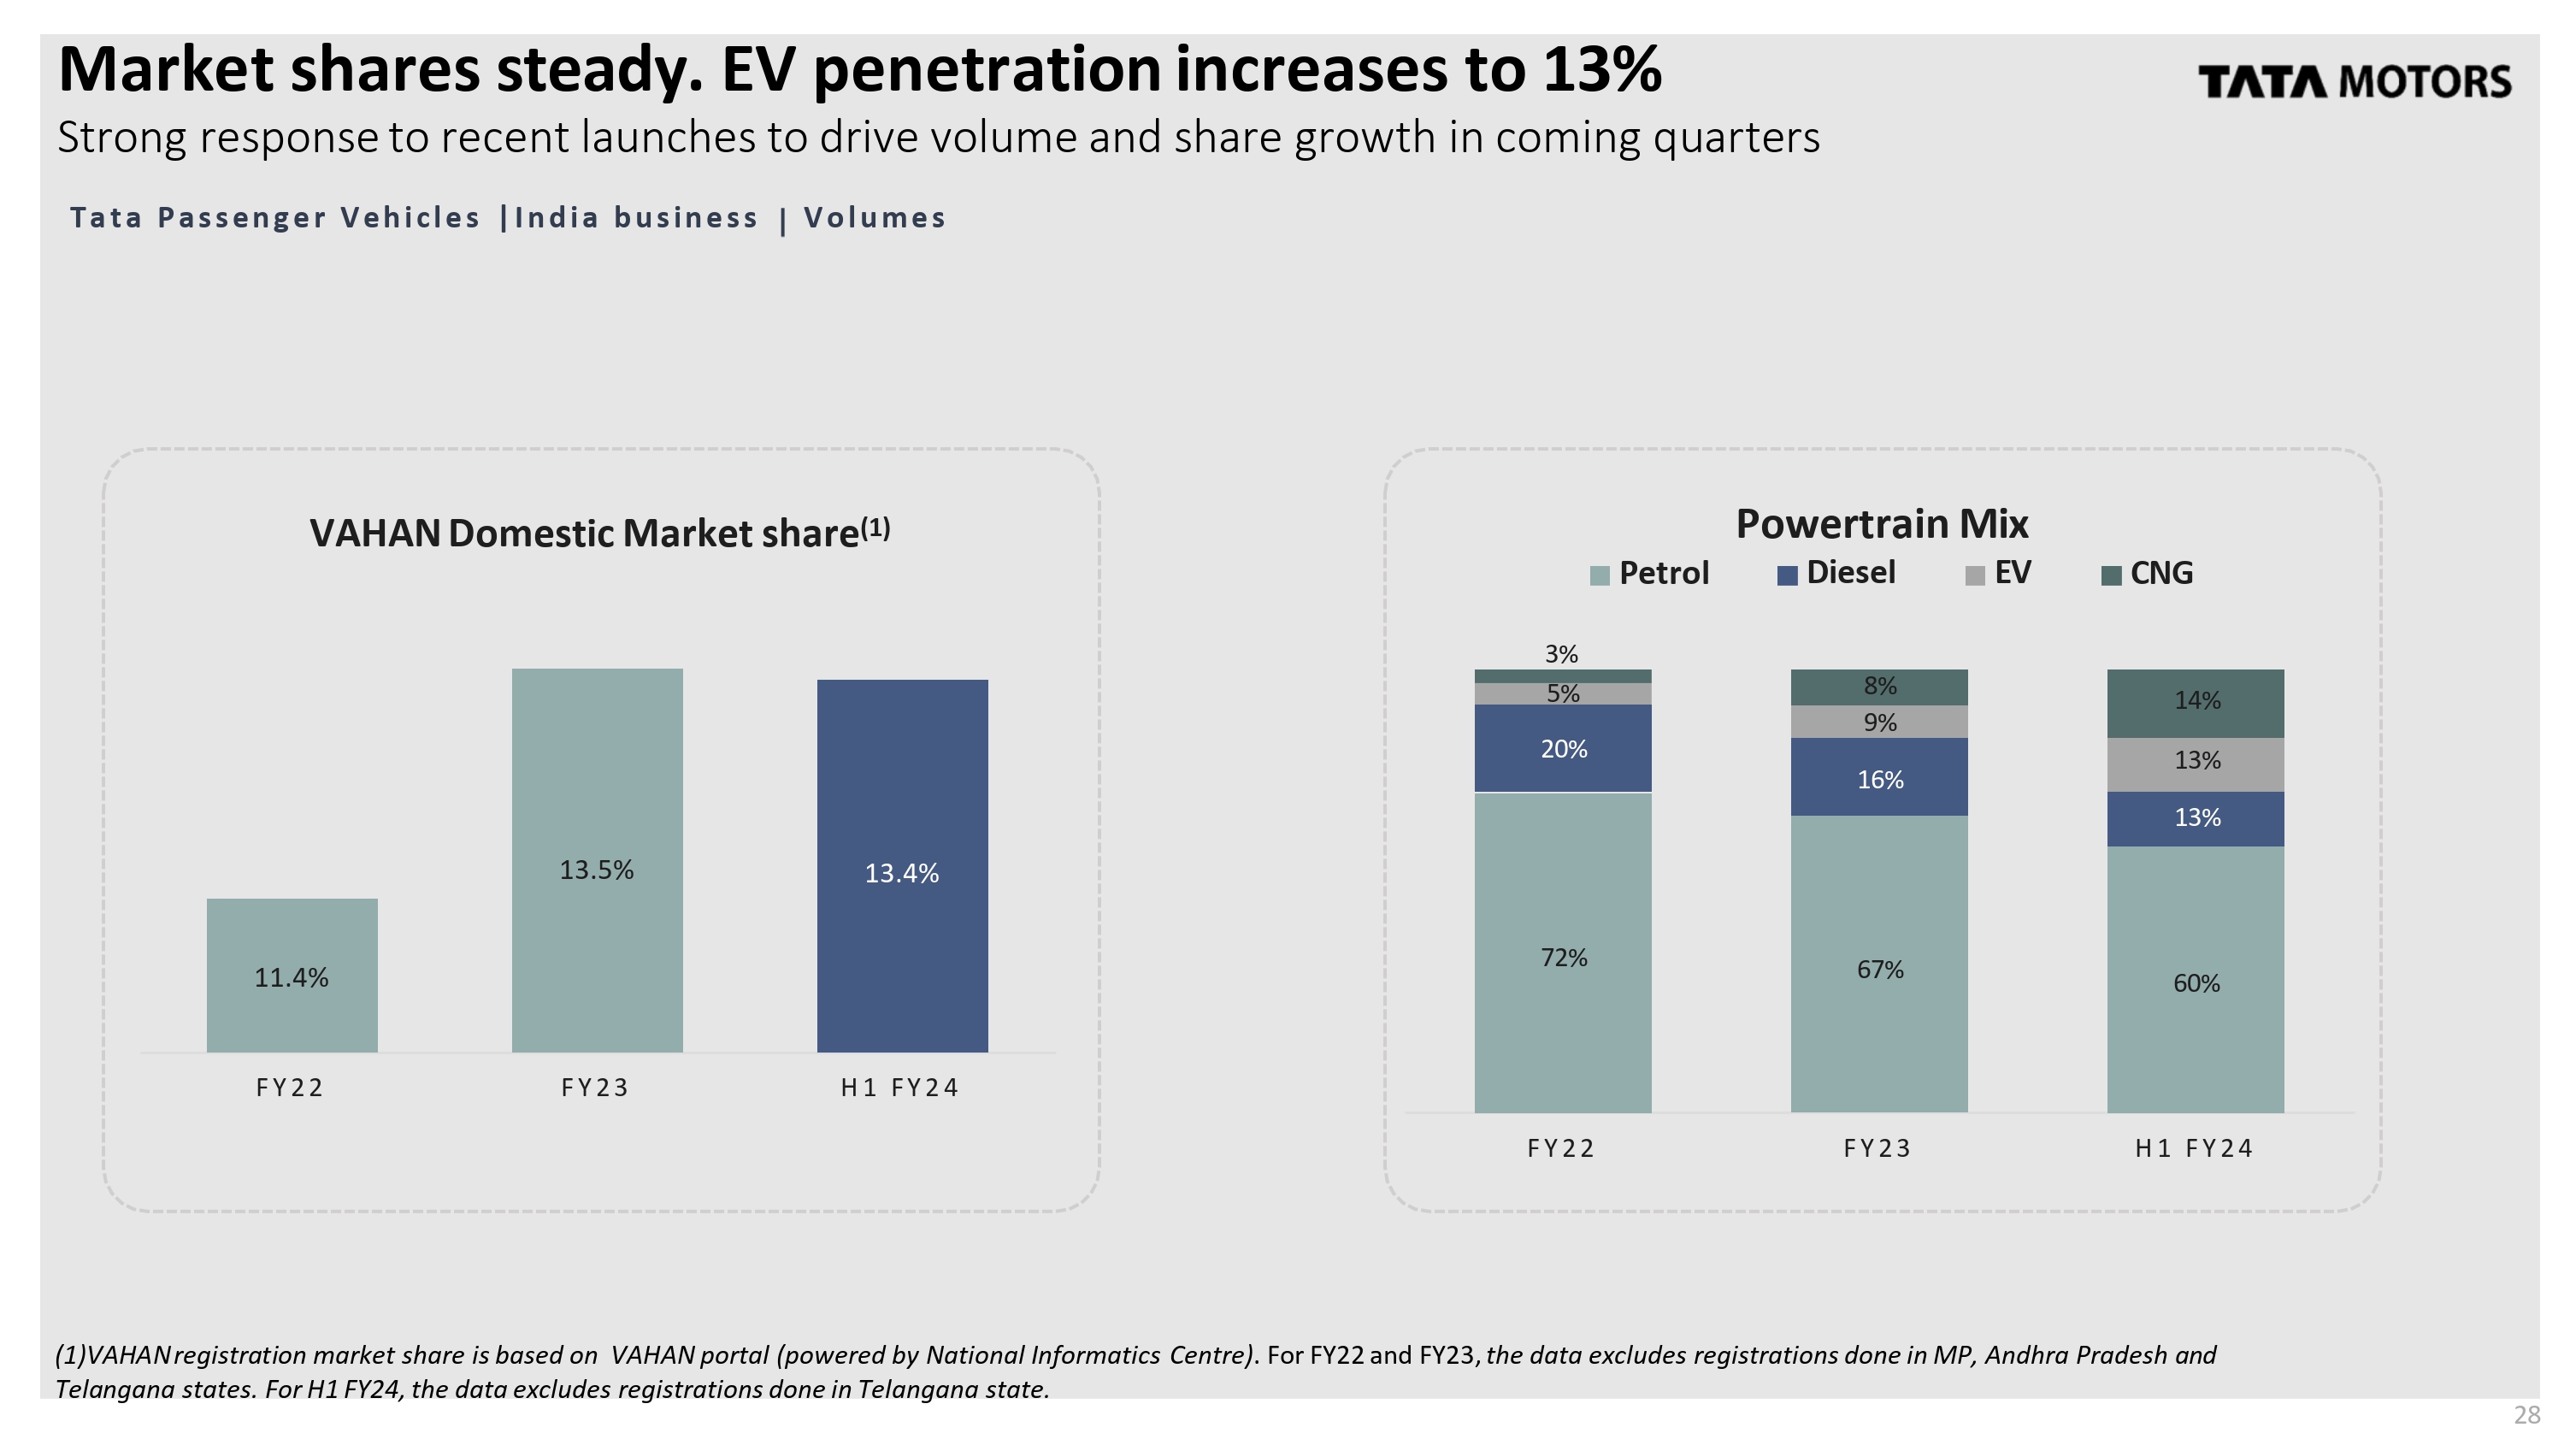
11.4% 13.5% 13.4% FY22 FY23 H1 FY24 Market shares steady. EV penetration increases to 13% VAHAN Domestic Market share (1) 72% 67% 60% 20% 16% 13% 5% 9% 13% 3% 8% 14% FY22 FY23 H1 FY24 Petrol Powertrain Mix Diesel EV CNG Strong response to recent launches to drive volume and share growth in coming quarters Tata Passenger Vehicles | India business Volumes (1) VAHAN registration market share is based on VAHAN portal (powered by National Informatics Centre). For FY22 and FY23, the data excludes registrations done in MP, Andhra Pradesh and Telangana states. For H1 FY24, the data excludes registrations done in Telangana state. 28

EVs continue to grow with ~55% YoY volume increase Tata Passenger Electric Vehicles 2,000 5,314 7,773 FY22 FY23 H1 FY24 Charging infra 75 165 192 143 250 287 FY22 FY23 H1 FY24 Network Cities Dealerships VAHAN registration market share (1) EV Volumes 86.5% 83.9% 73.4% FY22 FY23 H1 FY24 YoY 54.6% 12.0 (1) VAHAN registration market share is based on VAHAN portal (powered by National Informatics Centre). For FY22 and FY23, the data excludes registrations done in MP, Andhra Pradesh and Telangana states. For H1 FY24, the data excludes registrations done in Telangana state. 29 19.3 18.6 Q2 FY23 Q1 FY24 Q2 FY24 Wholesales (incl. exports) (K units) Growing dealer and charging infra network to accelerate adoption.
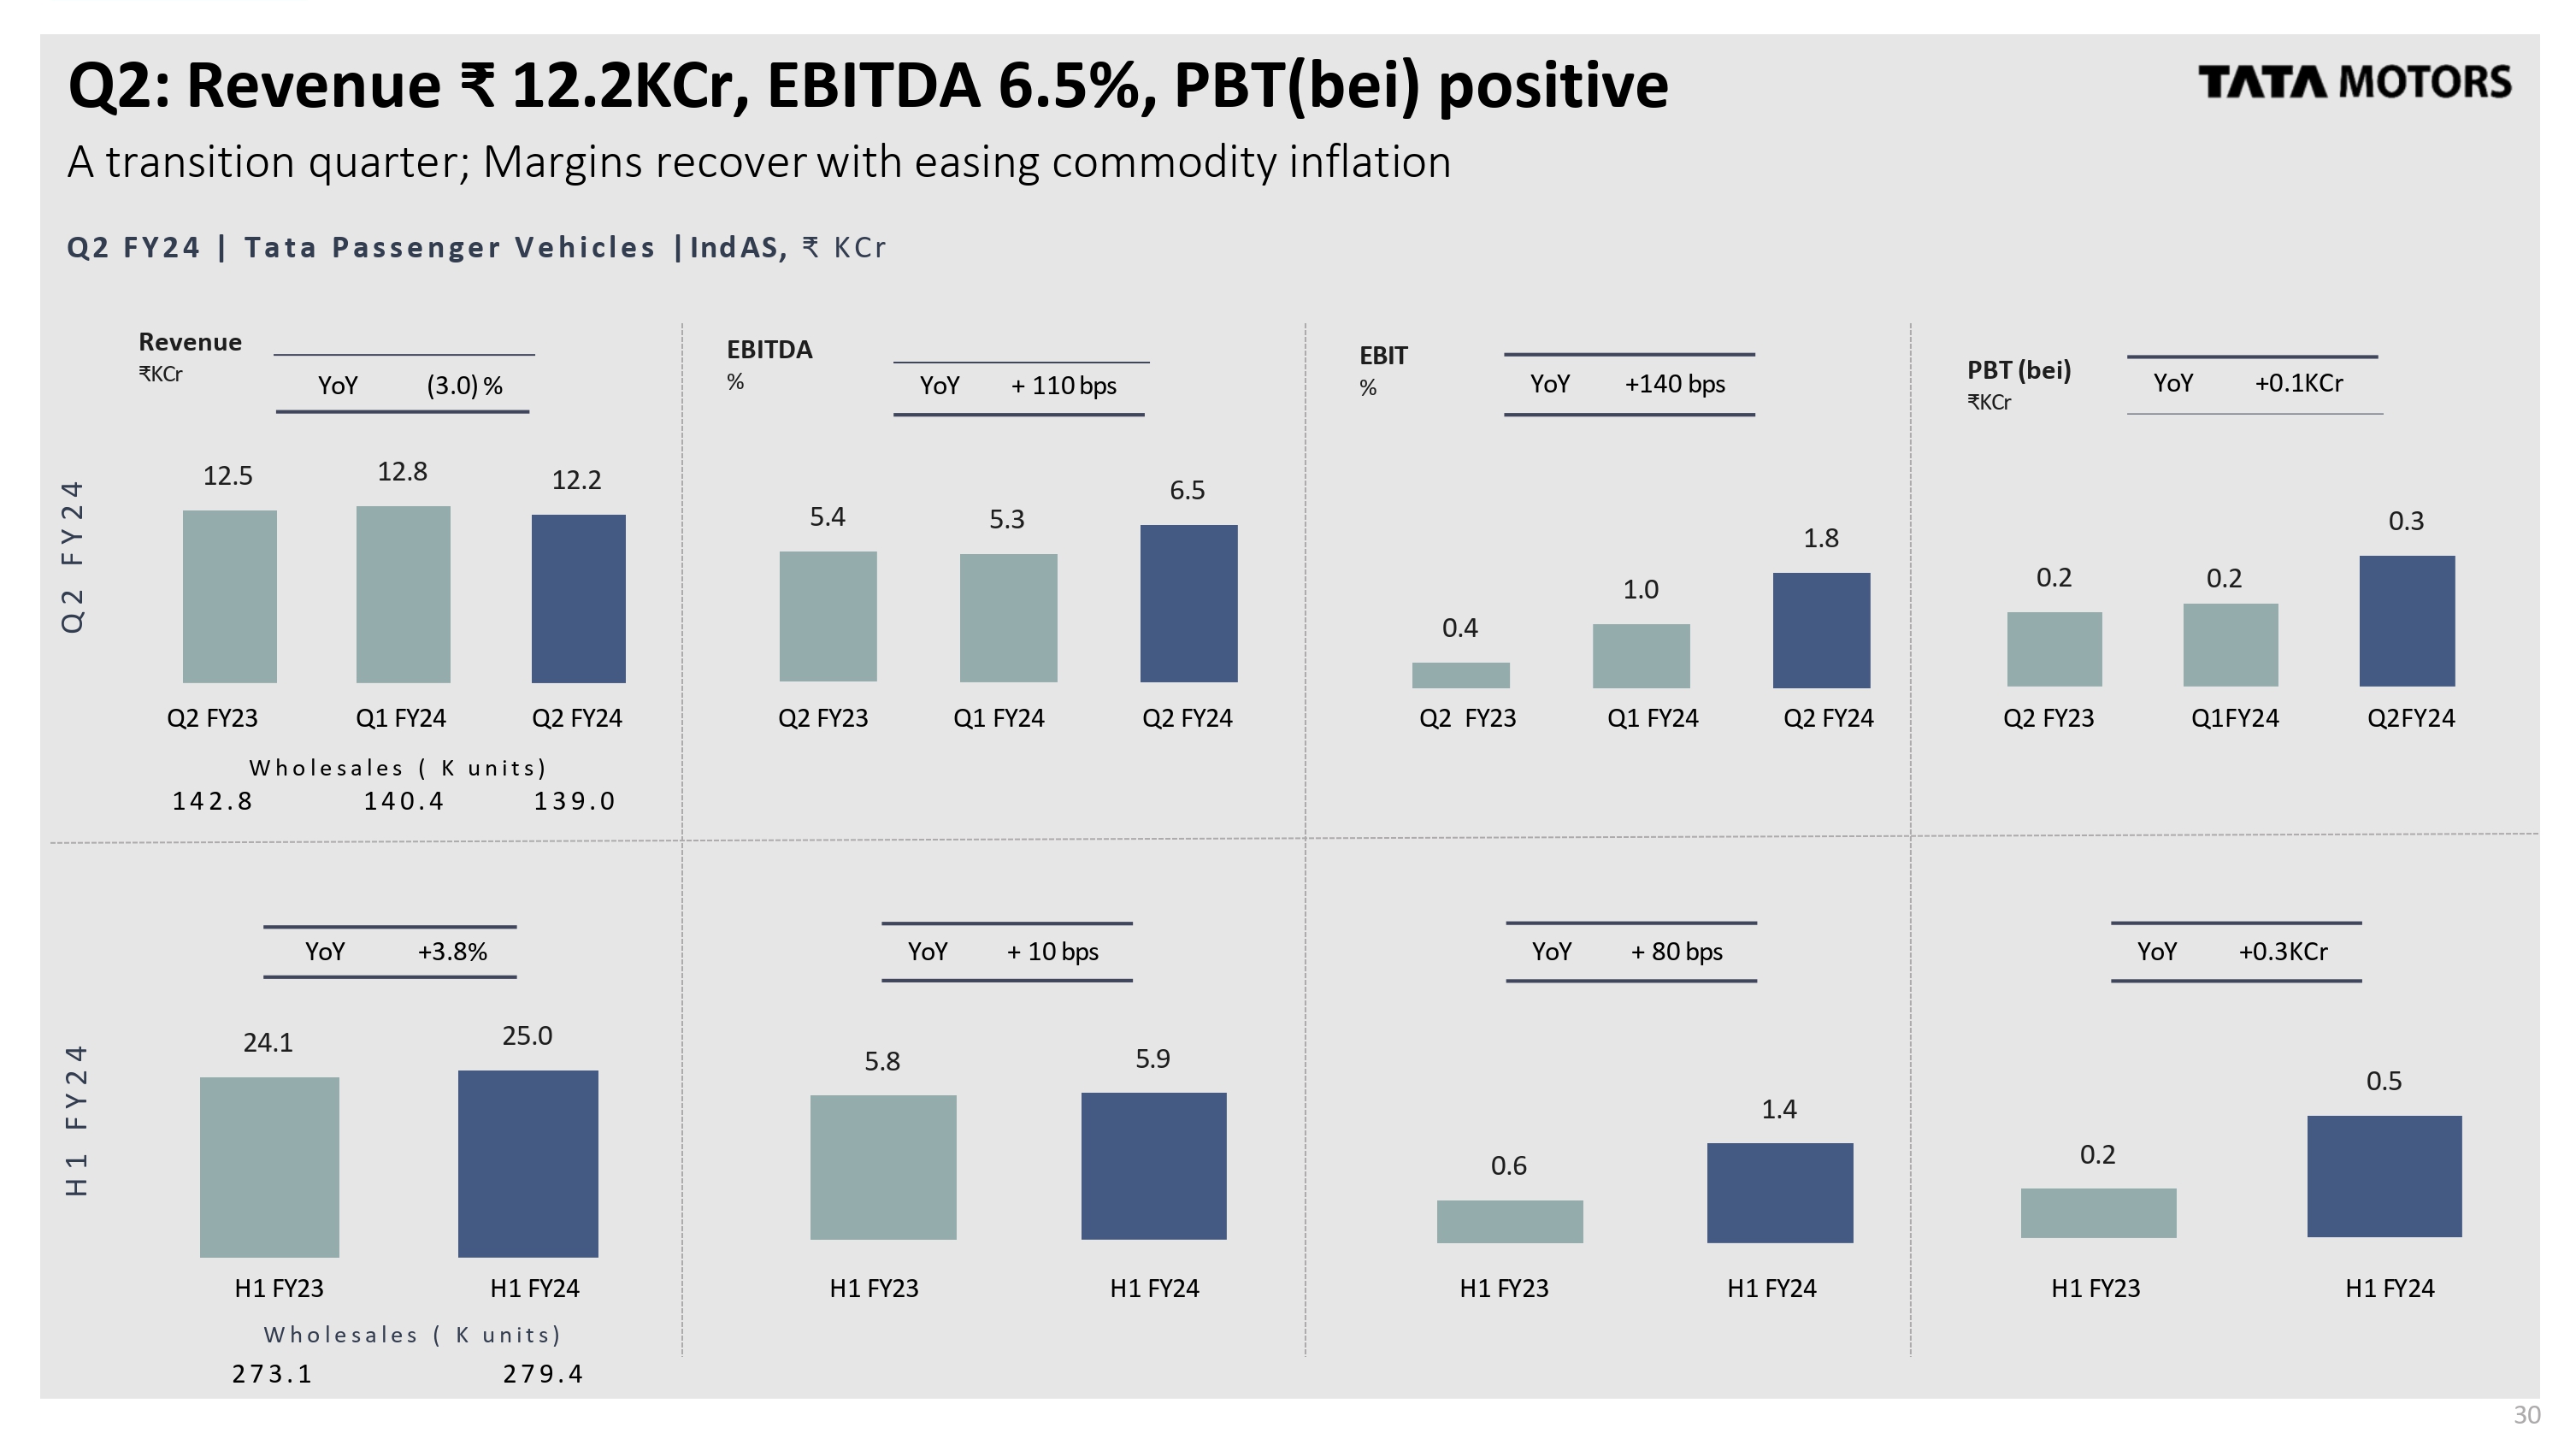
Q2: Revenue ₹ 12.2KCr, EBITDA 6.5%, PBT (bei) positive A transition quarter; Margins recover with easing commodity inflation 0.2 0.2 0.3 PBT (bei) ₹KCr 12.5 12.8 12.2 Revenue ₹KCr 5.4 5.3 6.5 EBITDA % YoY (3.0) % YoY + 110 bps 1 3 9. 0 W h o l e s a l e s ( K u n i t s ) Q 2 F Y 2 4 H 1 F Y 2 4 0.2 0.5 24.1 25.0 5.8 5.9 YoY +3.8% YoY + 10 bps Q2 FY23 Q1 FY24 Q2 FY24 Q2 FY23 Q1 FY24 Q2 FY24 Q2 FY23 Q1 FY24 Q2 FY24 Q2 FY23 Q1FY24 Q2FY24 H1 FY23 H1 FY24 H1 FY23 H1 FY24 H1 FY23 H1 FY24 0.4 30 1.0 1.8 EBIT % YoY +140 bps 0.6 1.4 YoY + 80 bps Q 2 F Y 2 4 | Tata Passenger Vehicles | Ind AS, ₹ K C r 1 4 2. 8 1 4 0. 4 YoY +0.3KCr H1 FY23 H1 FY24 Wholesales (K units) 2 7 3. 1 2 7 9. 4 YoY +0.1KCr
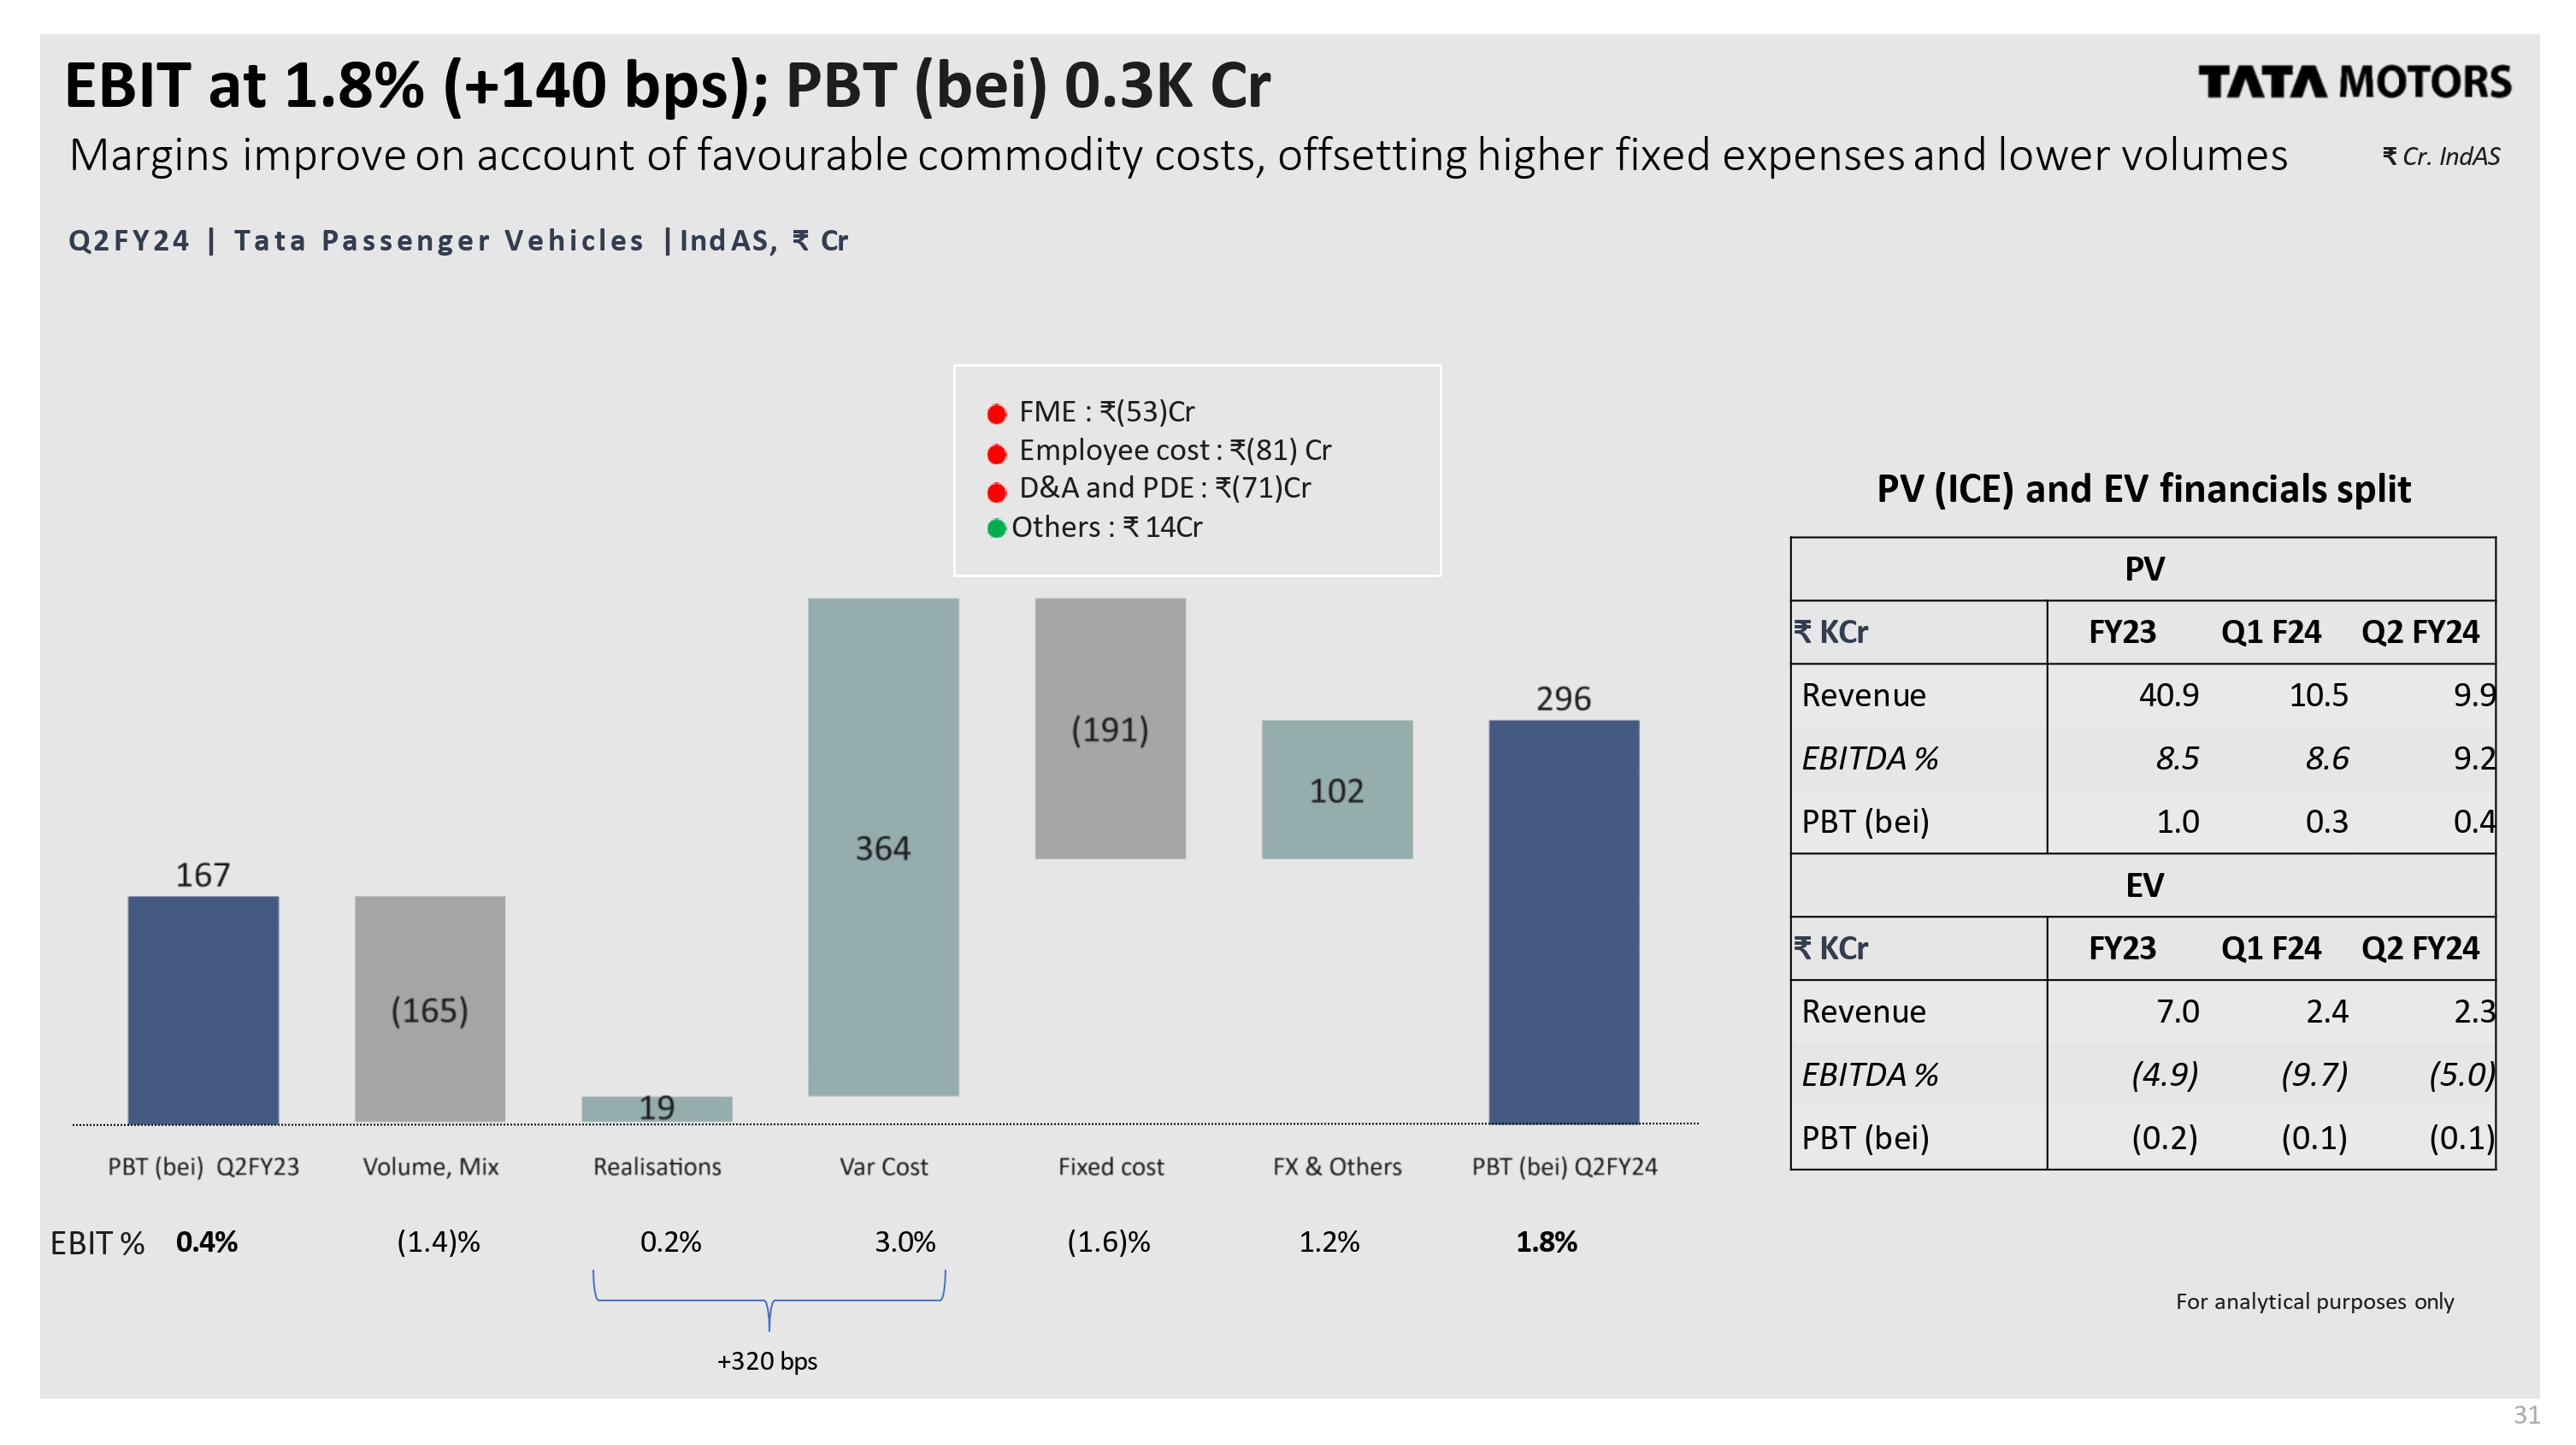
EBIT at 1.8% (+140 bps); PBT (bei) 0.3K Cr Margins improve on account of favourable commodity costs, offsetting higher fixed expenses and lower volumes For analytical purposes only EBIT % 0.4% (1.4)% 0.2% 3.0% (1.6)% 1.2% 1.8% ₹ Cr. IndAS FME : ₹(53)Cr Employee cost : ₹(81) Cr D&A and PDE : ₹(71)Cr Others : ₹ 14Cr Q 2 F Y 2 4 | Tata Passenger Vehicles | IndAS, ₹ Cr +320 bps 1 PV (ICE) and EV financials split PV ₹ KCr FY23 Q1 F24 Q2 FY24 Revenue 40.9 10.5 9.9 EBITDA % 8.5 8.6 9.2 PBT (bei) 1.0 0.3 0.4 EV ₹ KCr FY23 Q1 F24 Q2 FY24 Revenue 7.0 2.4 2.3 EBITDA % (4.9) (9.7) (5.0) PBT (bei) (0.2) (0.1) (0.1) (Bar_chart)
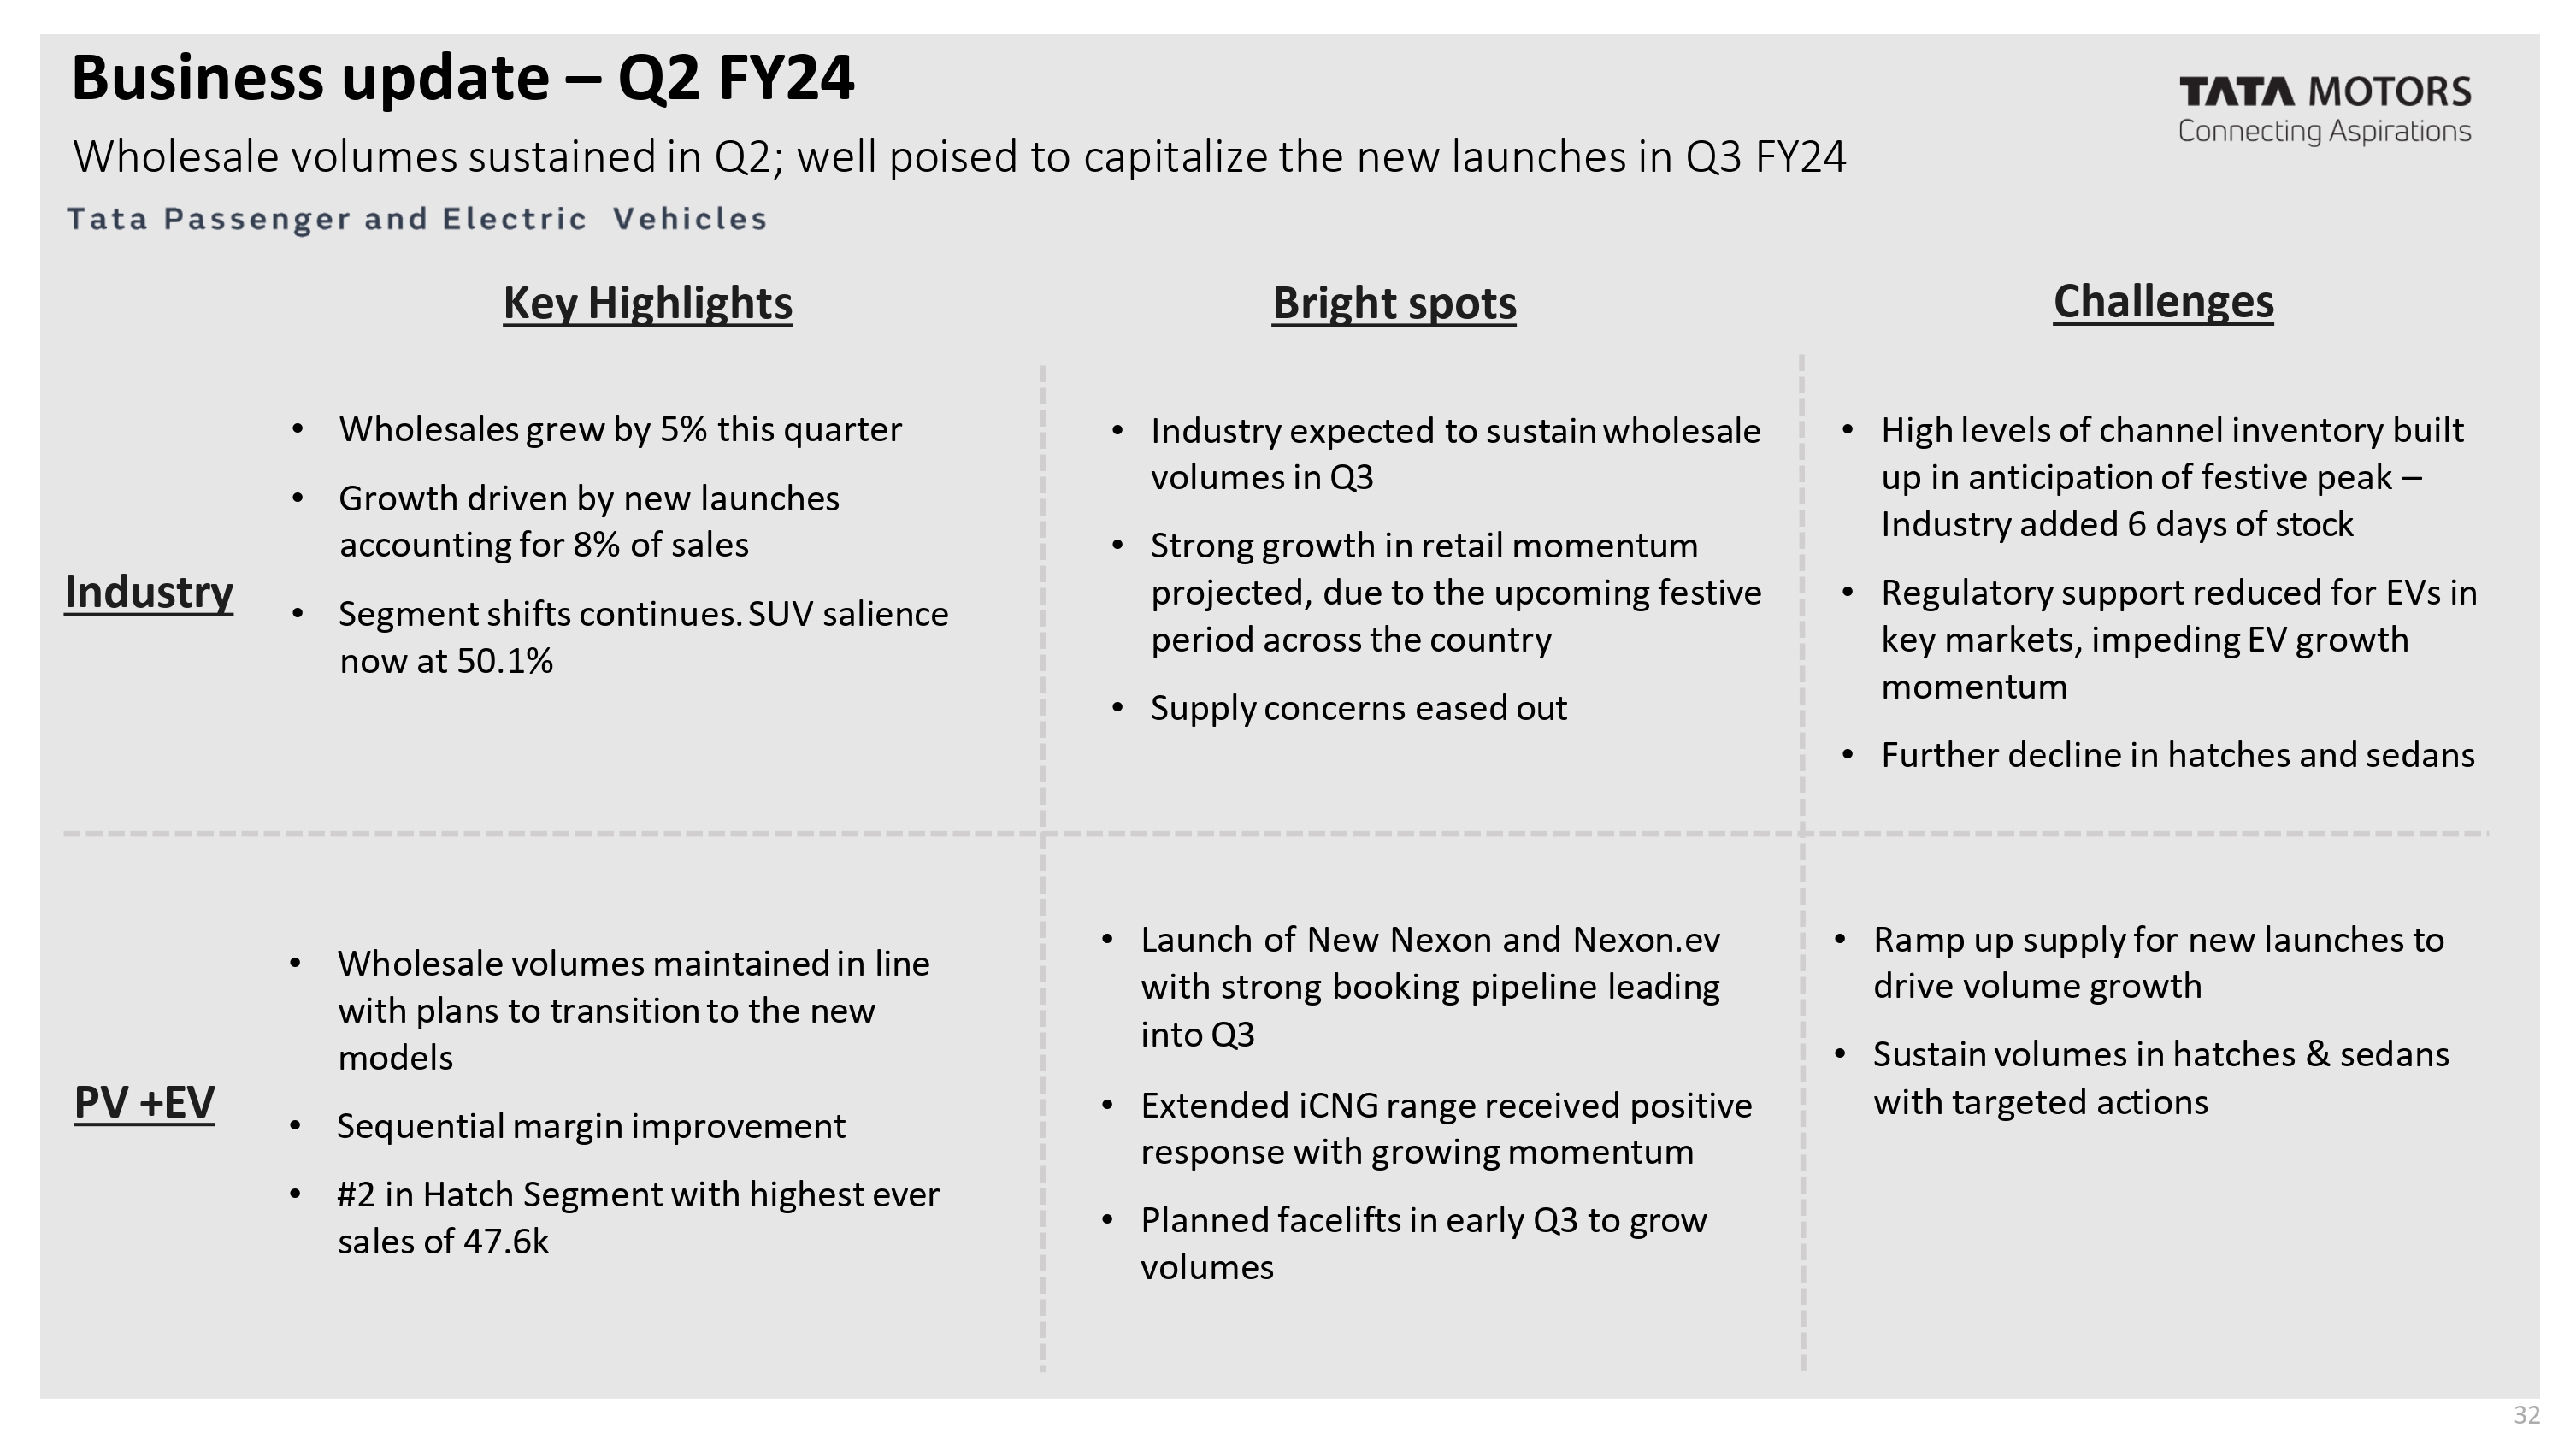
Business update – Q2 FY24 Wholesale volumes sustained in Q2; well poised to capitalize the new launches in Q3 FY24 tata passenger and electric vehicles tata motors connecting aspirations Wholesale volumes maintained in line with plans to transition to the new models Sequential margin improvement #2 in Hatch Segment with highest ever sales of 47.6k Launch of New Nexon and Nexon.ev with strong booking pipeline leading into Q3 Extended iCNG range received positive response with growing momentum Planned facelifts in early Q3 to grow volumes Industry PV +EV Wholesales grew by 5% this quarter Growth driven by new launches accounting for 8% of sales Segment shifts continues. SUV salience now at 50.1% Industry expected to sustain wholesale volumes in Q3 Strong growth in retail momentum projected, due to the upcoming festive period across the country Supply concerns eased out Challenges High levels of channel inventory built up in anticipation of festive peak – Industry added 6 days of stock Regulatory support reduced for EVs in key markets, impeding EV growth momentum Further decline in hatches and sedans Ramp up supply for new launches to drive volume growth Sustain volumes in hatches & sedans with targeted actions Key Highlights Bright spots2
Tata Motors (CV+PV) *TML, TMPVL, TPEML and Joint operations TCL and FIAPL. 3
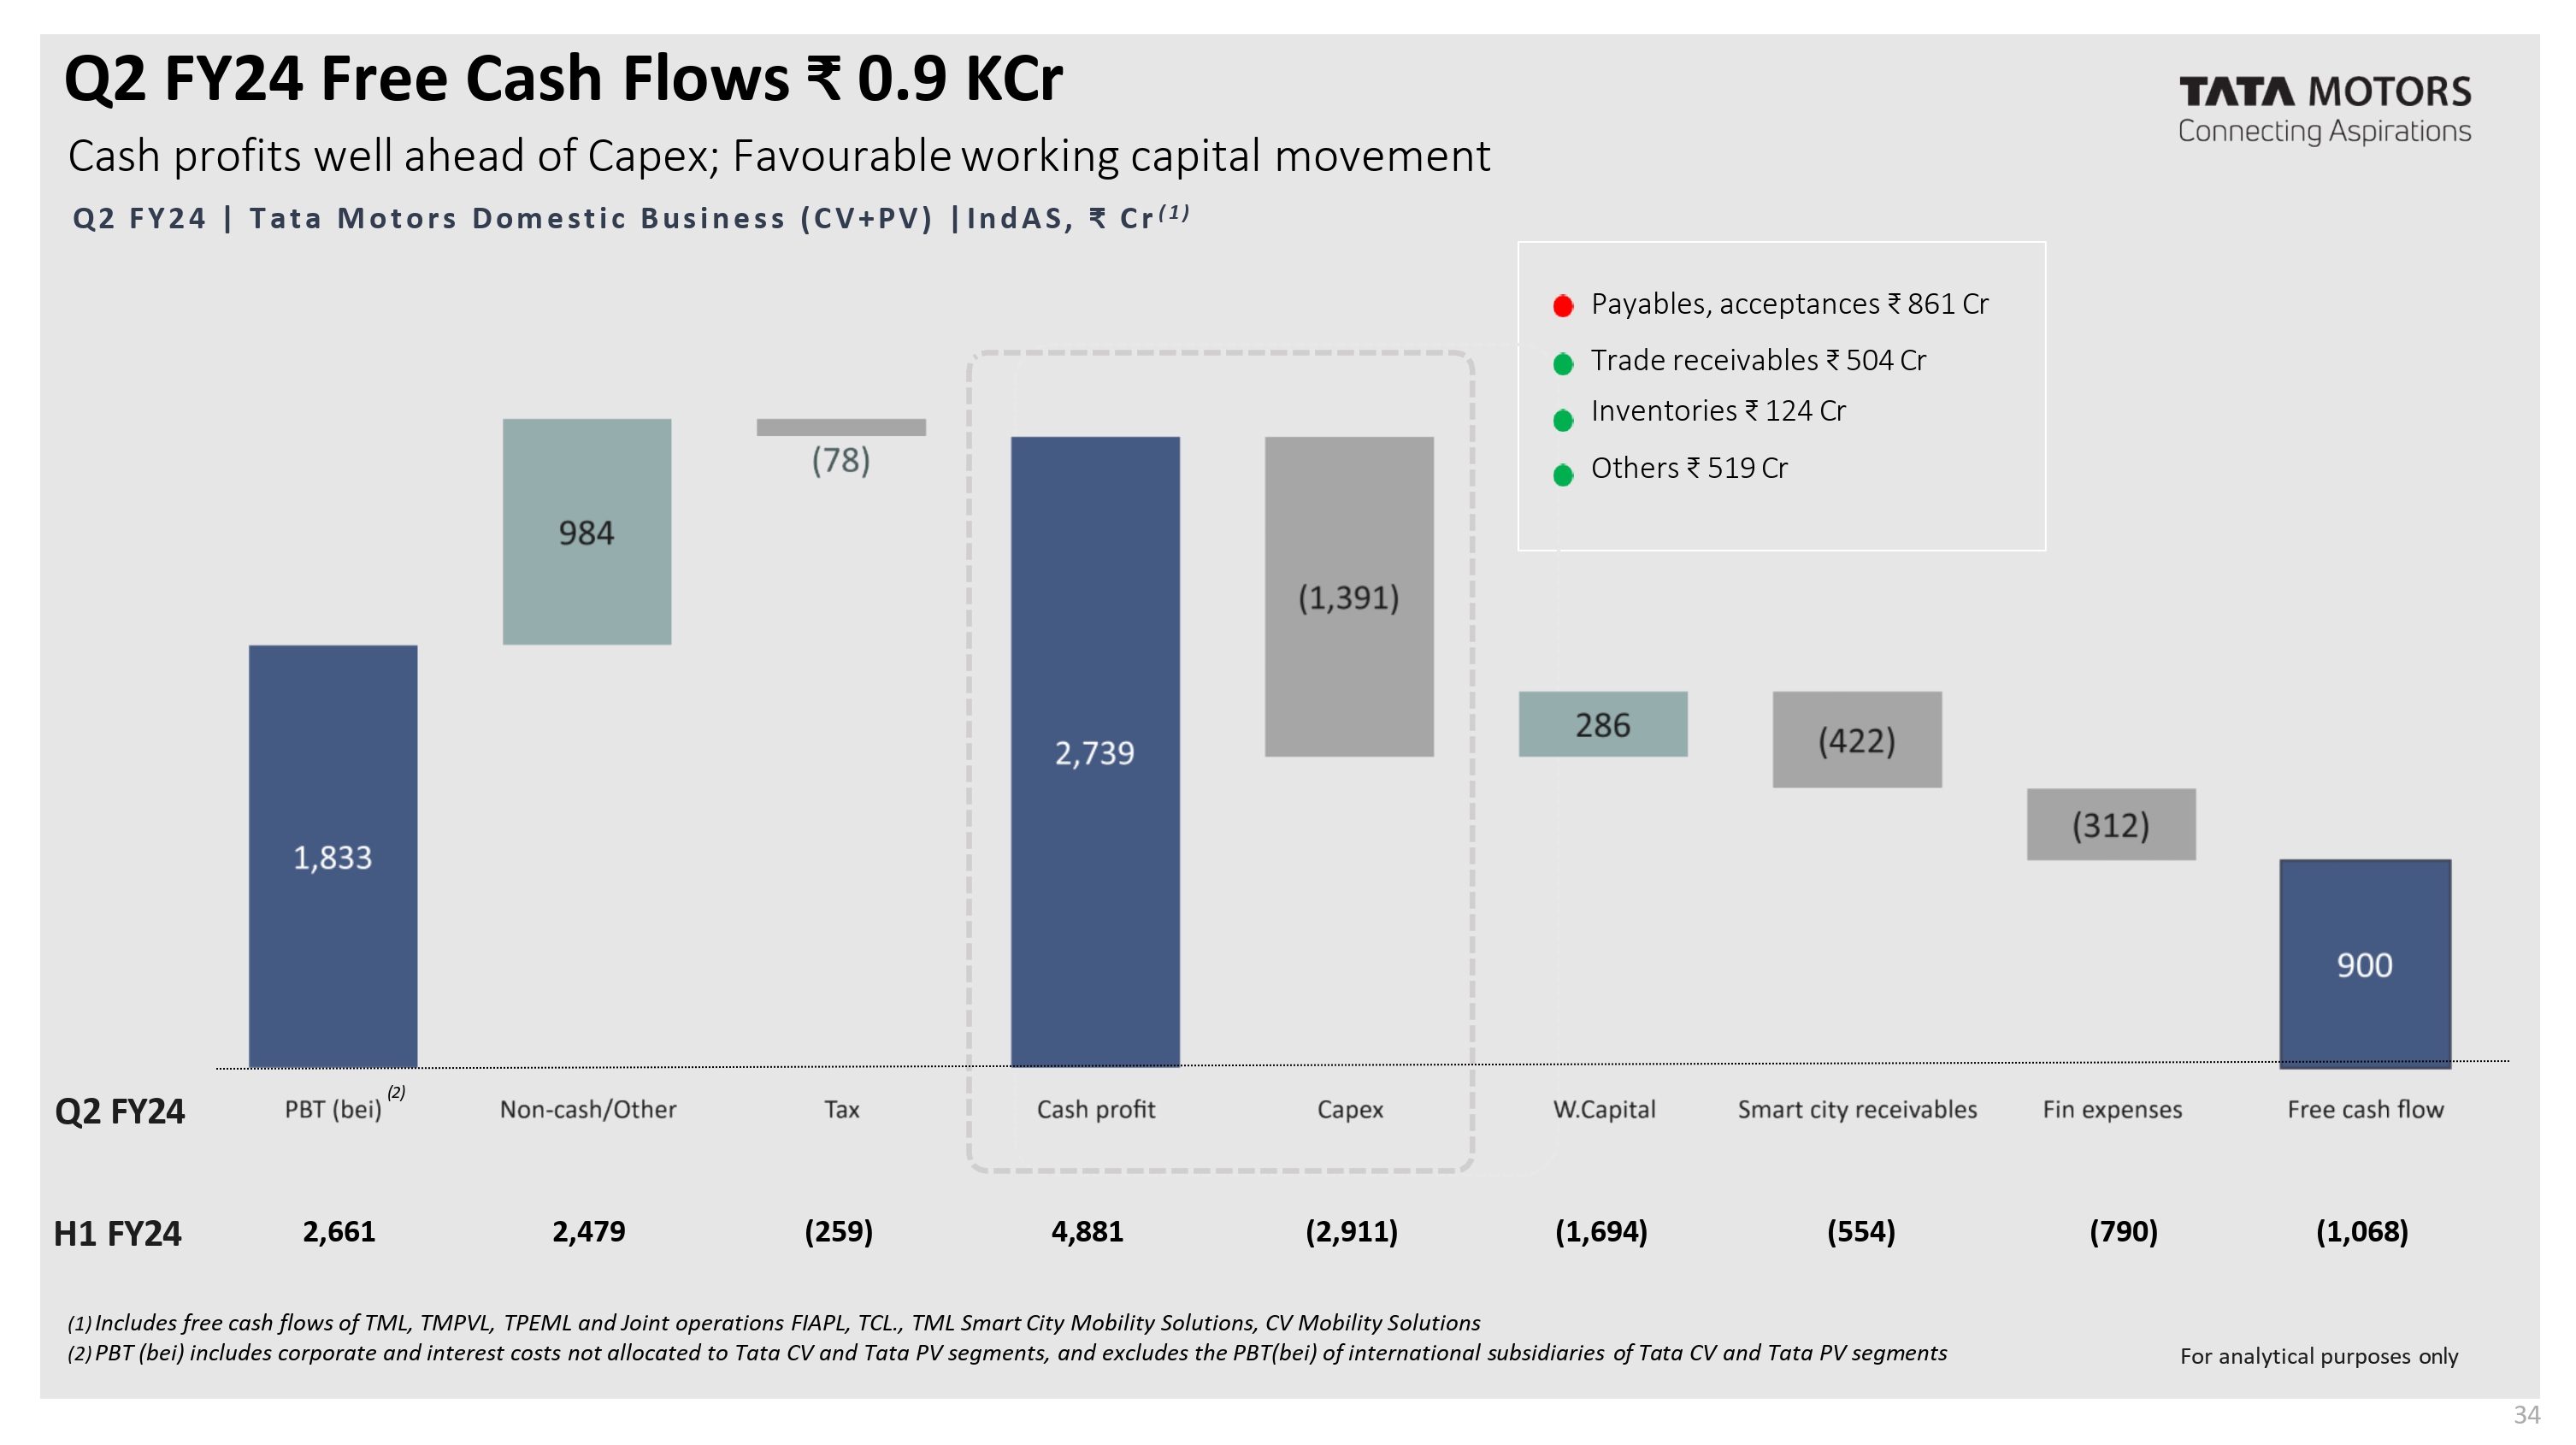
Q2 FY24 Free Cash Flows ₹ 0.9 KCr Cash profits well ahead of Capex; Favourable working capital movement Q2 FY24 | Tata Motors Domestic Business (CV+PV) | IndAS, ₹ Cr (1) Payables, acceptances ₹ 861 Cr Trade receivables ₹ 504 Cr Inventories ₹ 124 Cr Others ₹ 519 Cr (1) Includes free cash flows of TML, TMPVL, TPEML and Joint operations FIAPL, TCL., TML Smart City Mobility Solutions, CV Mobility Solutions (2) PBT (bei) includes corporate and interest costs not allocated to Tata CV and Ta ta PV segments, and excludes the PBT(bei) of international subsidiaries of Tata CV and Tata PV segments 2,661 2,479 (259) 4,881 (2,911) (1,694) (554) (790) (1,068) H1 FY24 4 For analytical purposes only Q2 FY24 (2) PBT (bei) (2) non-cash/other tax cash profit capex w.capital smart city receivable fin expenses free cash flow 1,833 984 (78) 2,739 (1,391) 286 (422) (312) 900 (Bar_Chart)
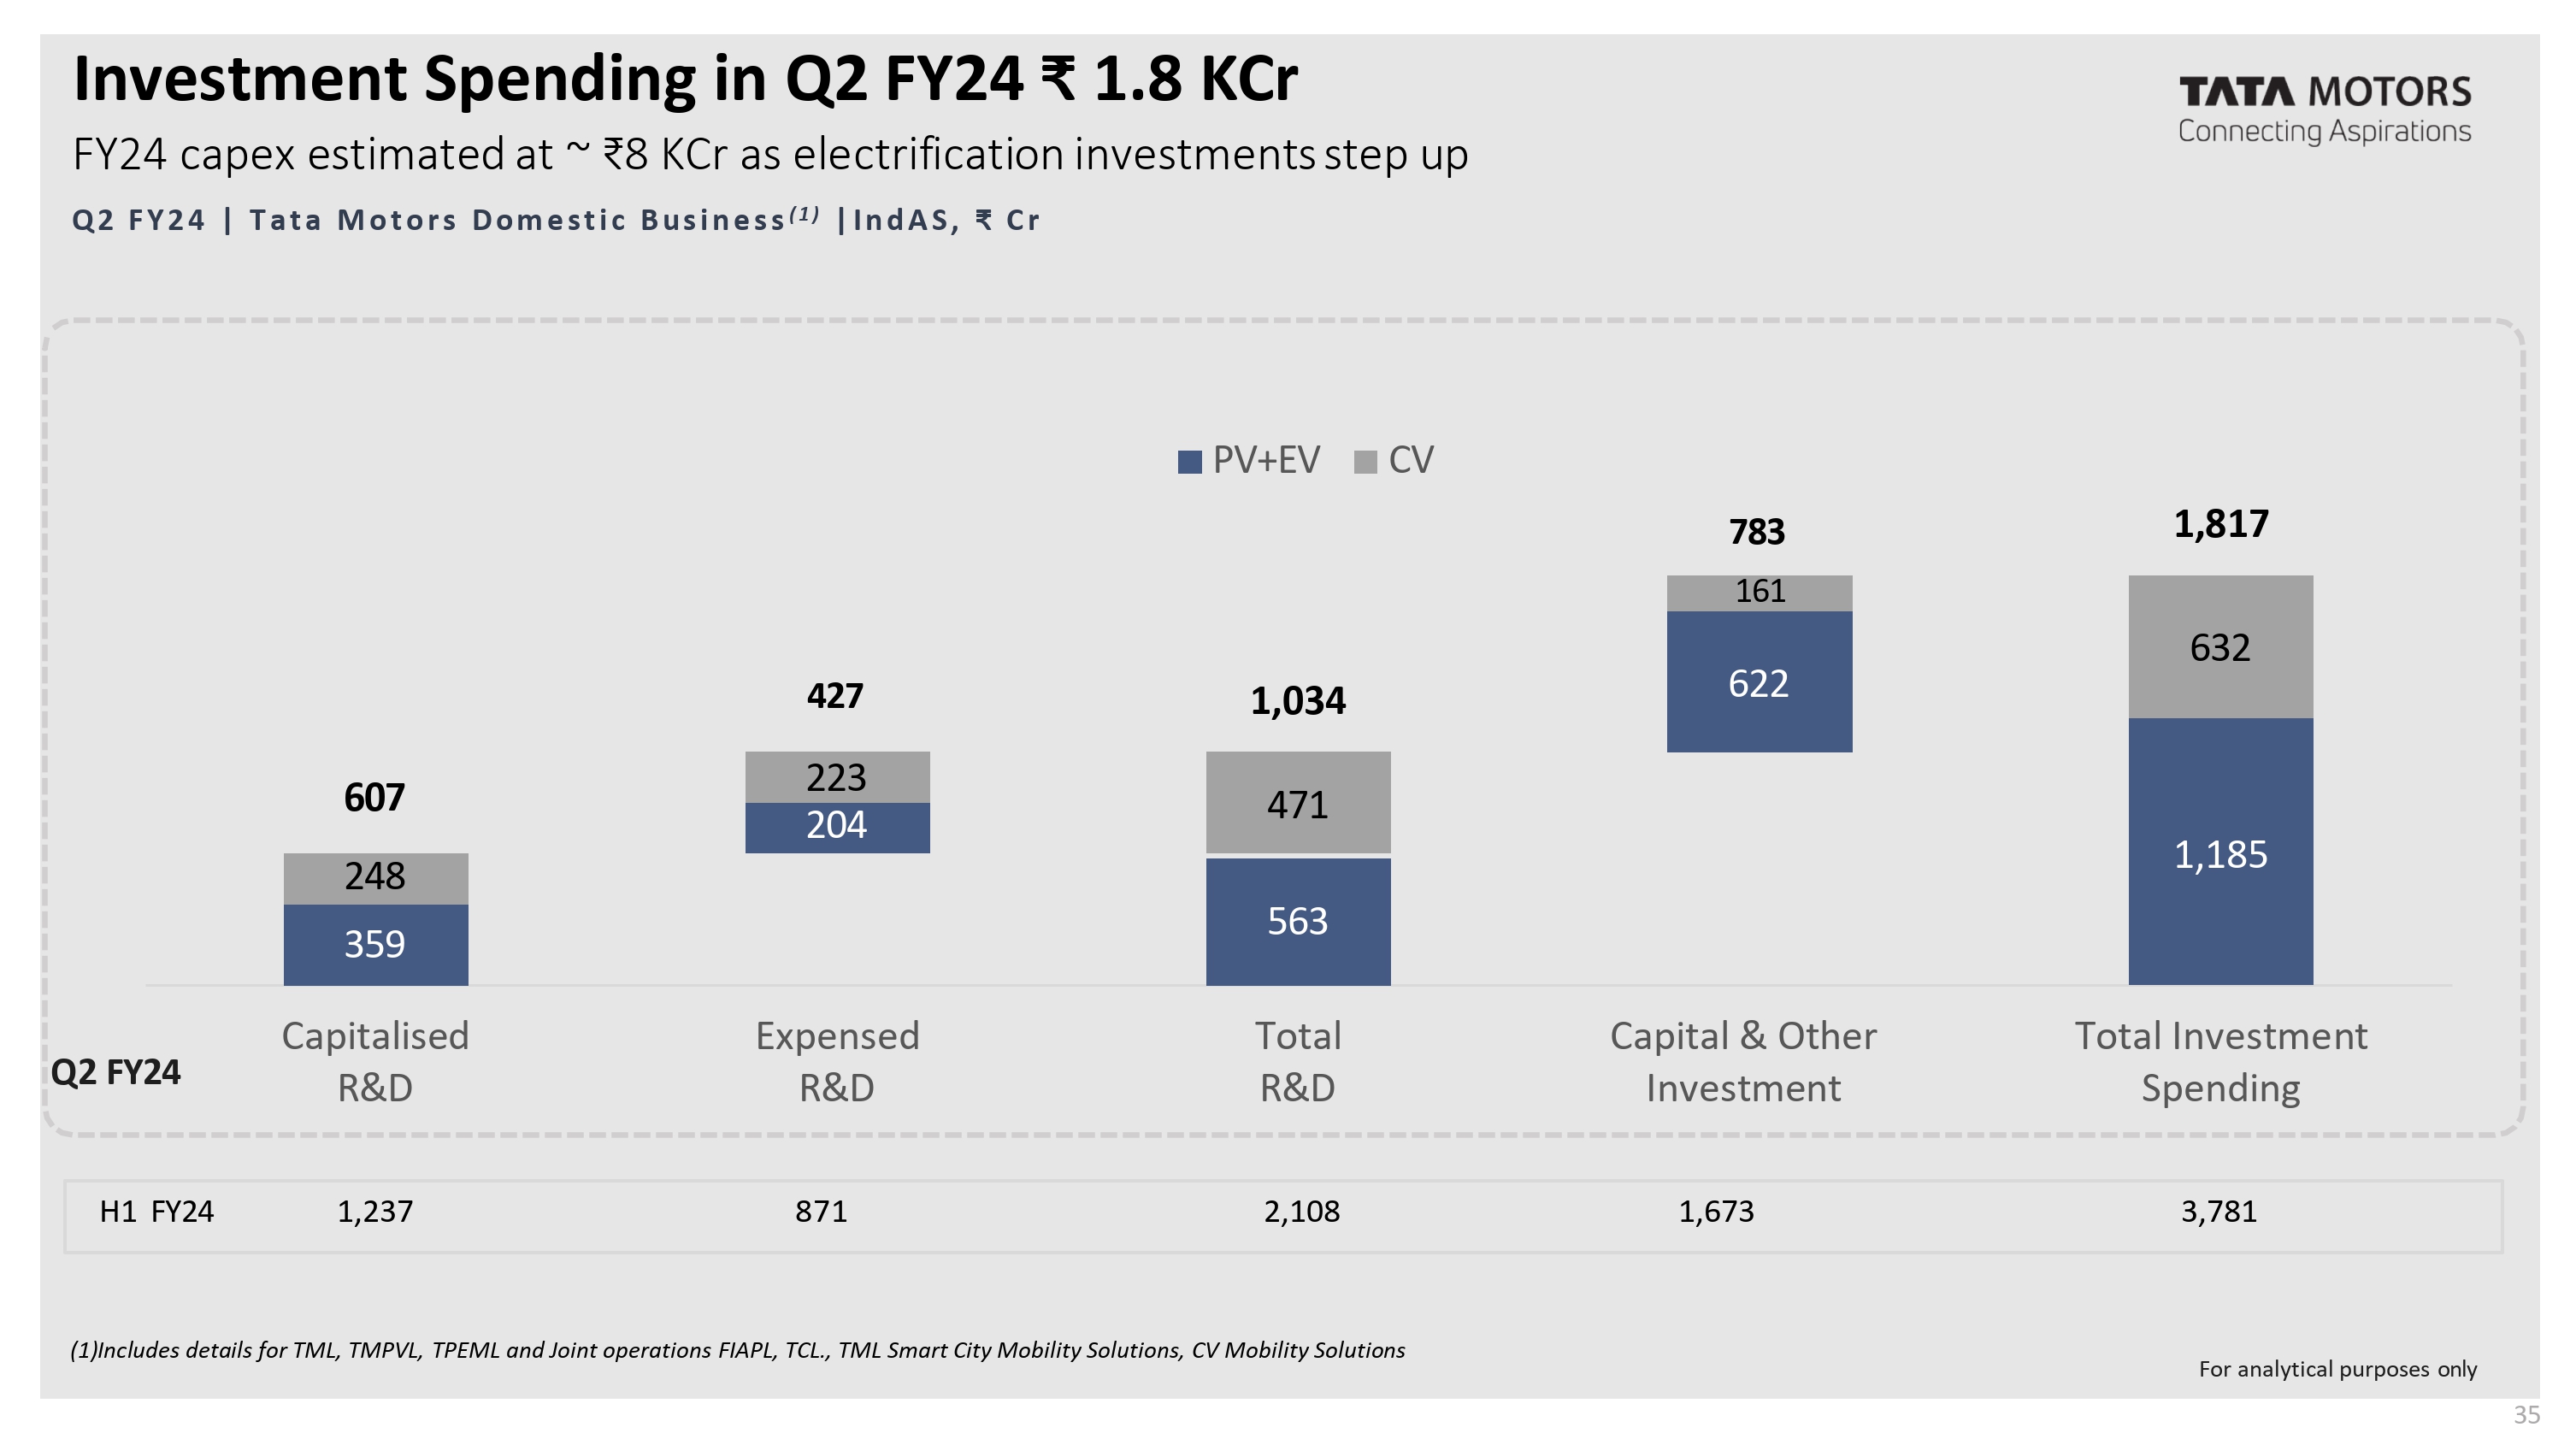
Investment Spending in Q2 FY24 ₹ 1.8 KCr FY24 capex estimated at ~ ₹8 KCr as electrification investments step up Q2 FY24 | Tata Motors Domestic Business (1) | IndAS , ₹ C r (1)Includes details for TML, TMPVL, TPEML and Joint operations FIAPL, TCL., TML Smart City Mobility Solutions, CV Mobility Solutions 359 204 563 622 1,185 248 223 471 161 632 607 1,034 1,817 Capitalised R&D Expensed R&D Total R&D Capital & Other Investment Total Investment Spending PV+EV CV 427 783 Q2 FY24 H1 FY24 1,237 871 2,108 1,673 3,781 For analytical purposes only 5
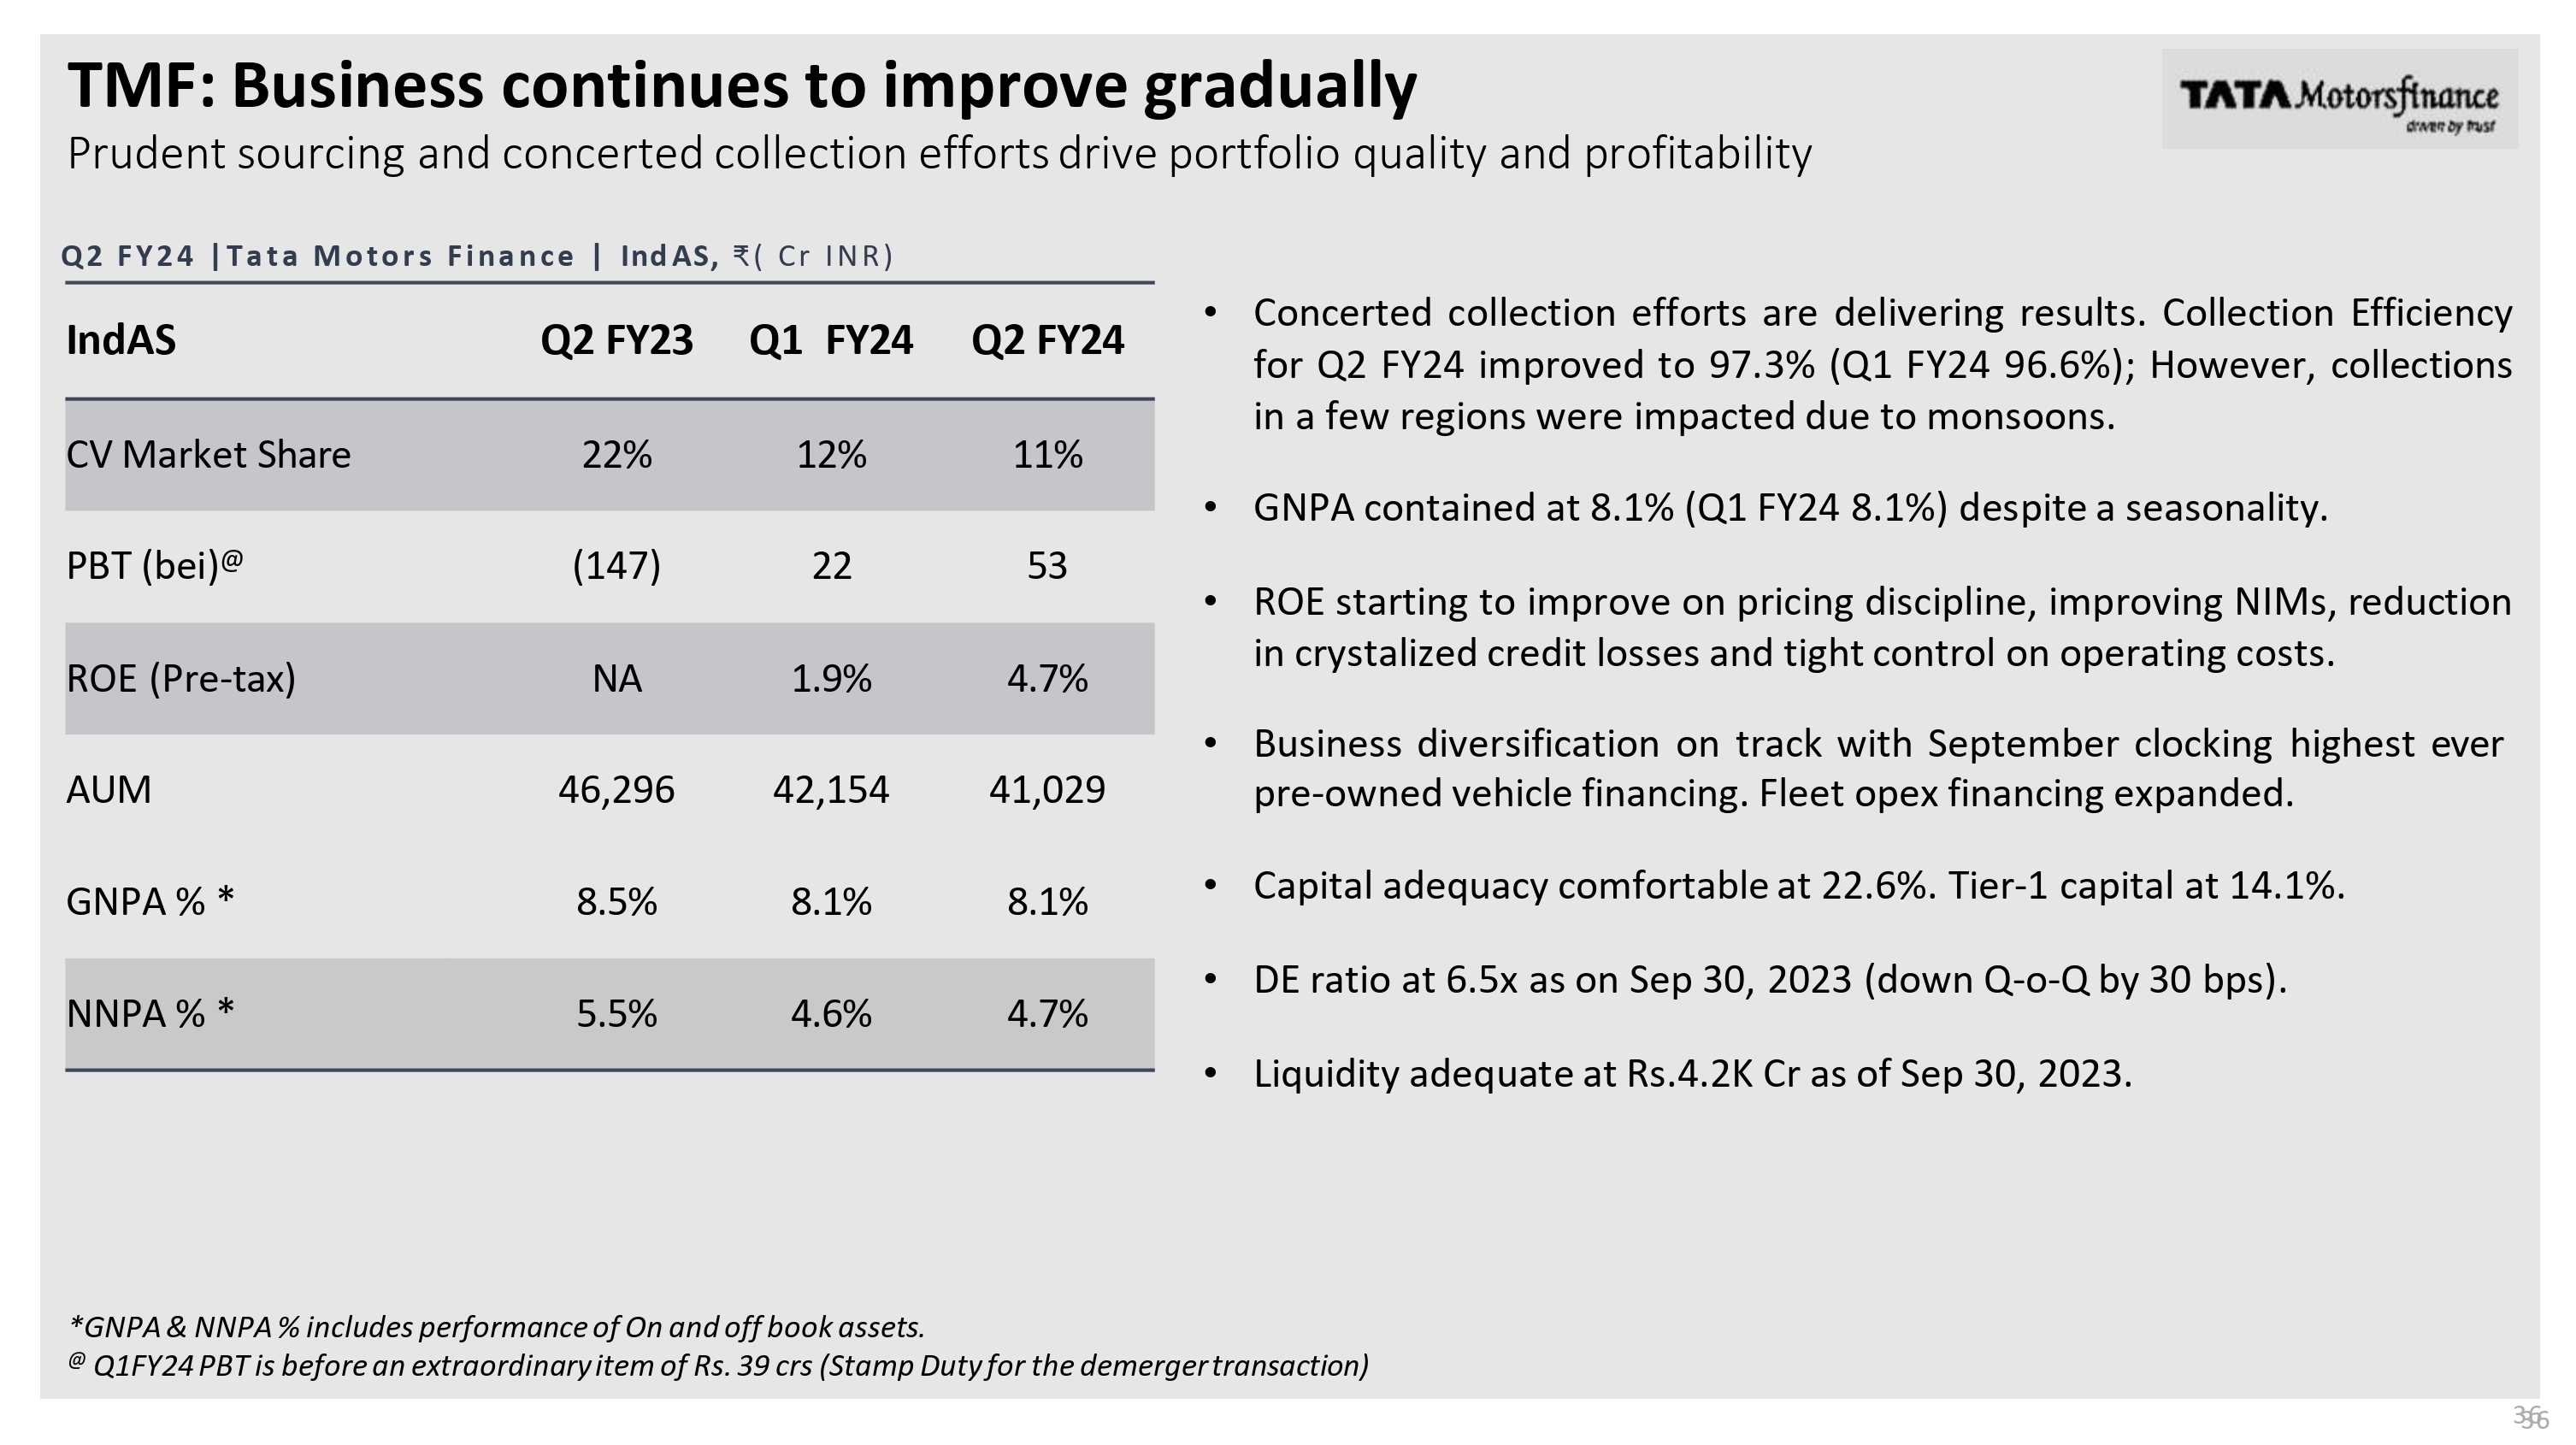
TMF: Business continues to improve gradually 3366 Prudent sourcing and concerted collection efforts drive portfolio quality and profitability *GNPA & NNPA % includes performance of On and off book assets. @ Q1FY24 PBT is before an extraordinary item of Rs. 39 crs (Stamp Duty for the demerger transaction) Q2 FY24 | Tata Motors Finance | Ind AS, ₹ (Cr INR) IndAS Q2 FY23 Q1 FY24 Q2 FY24 CV Market Share 22% 12% 11% PBT (bei)@ (147) 22 53 ROE (Pre-tax) NA 1.9% 4.7% AUM 46,296 42,154 41,029 GNPA % * 8.5% 8.1% 8.1% NNPA % * 5.5% 4.6% 4.7% • Concerted collection efforts are delivering results. Collection Efficiency for Q2 FY24 improved to 97.3% (Q1 FY24 96.6%); However, collections in a few regions were impacted due to monsoons. • GNPA contained at 8.1% (Q1 FY24 8.1%) despite a seasonality. • ROE starting to improve on pricing discipline, improving NIMs, reduction in crystalized credit losses and tight control on operating costs. • Business diversification on track with September clocking highest ever pre-owned vehicle financing. Fleet opex financing expanded. • Capital adequacy comfortable at 22.6%. Tier-1 capital at 14.1%. • DE ratio at 6.5x as on Sep 30, 2023 (down Q-o-Q by 30 bps). • Liquidity adequate at Rs.4.2K Cr as of Sep 30, 2023.
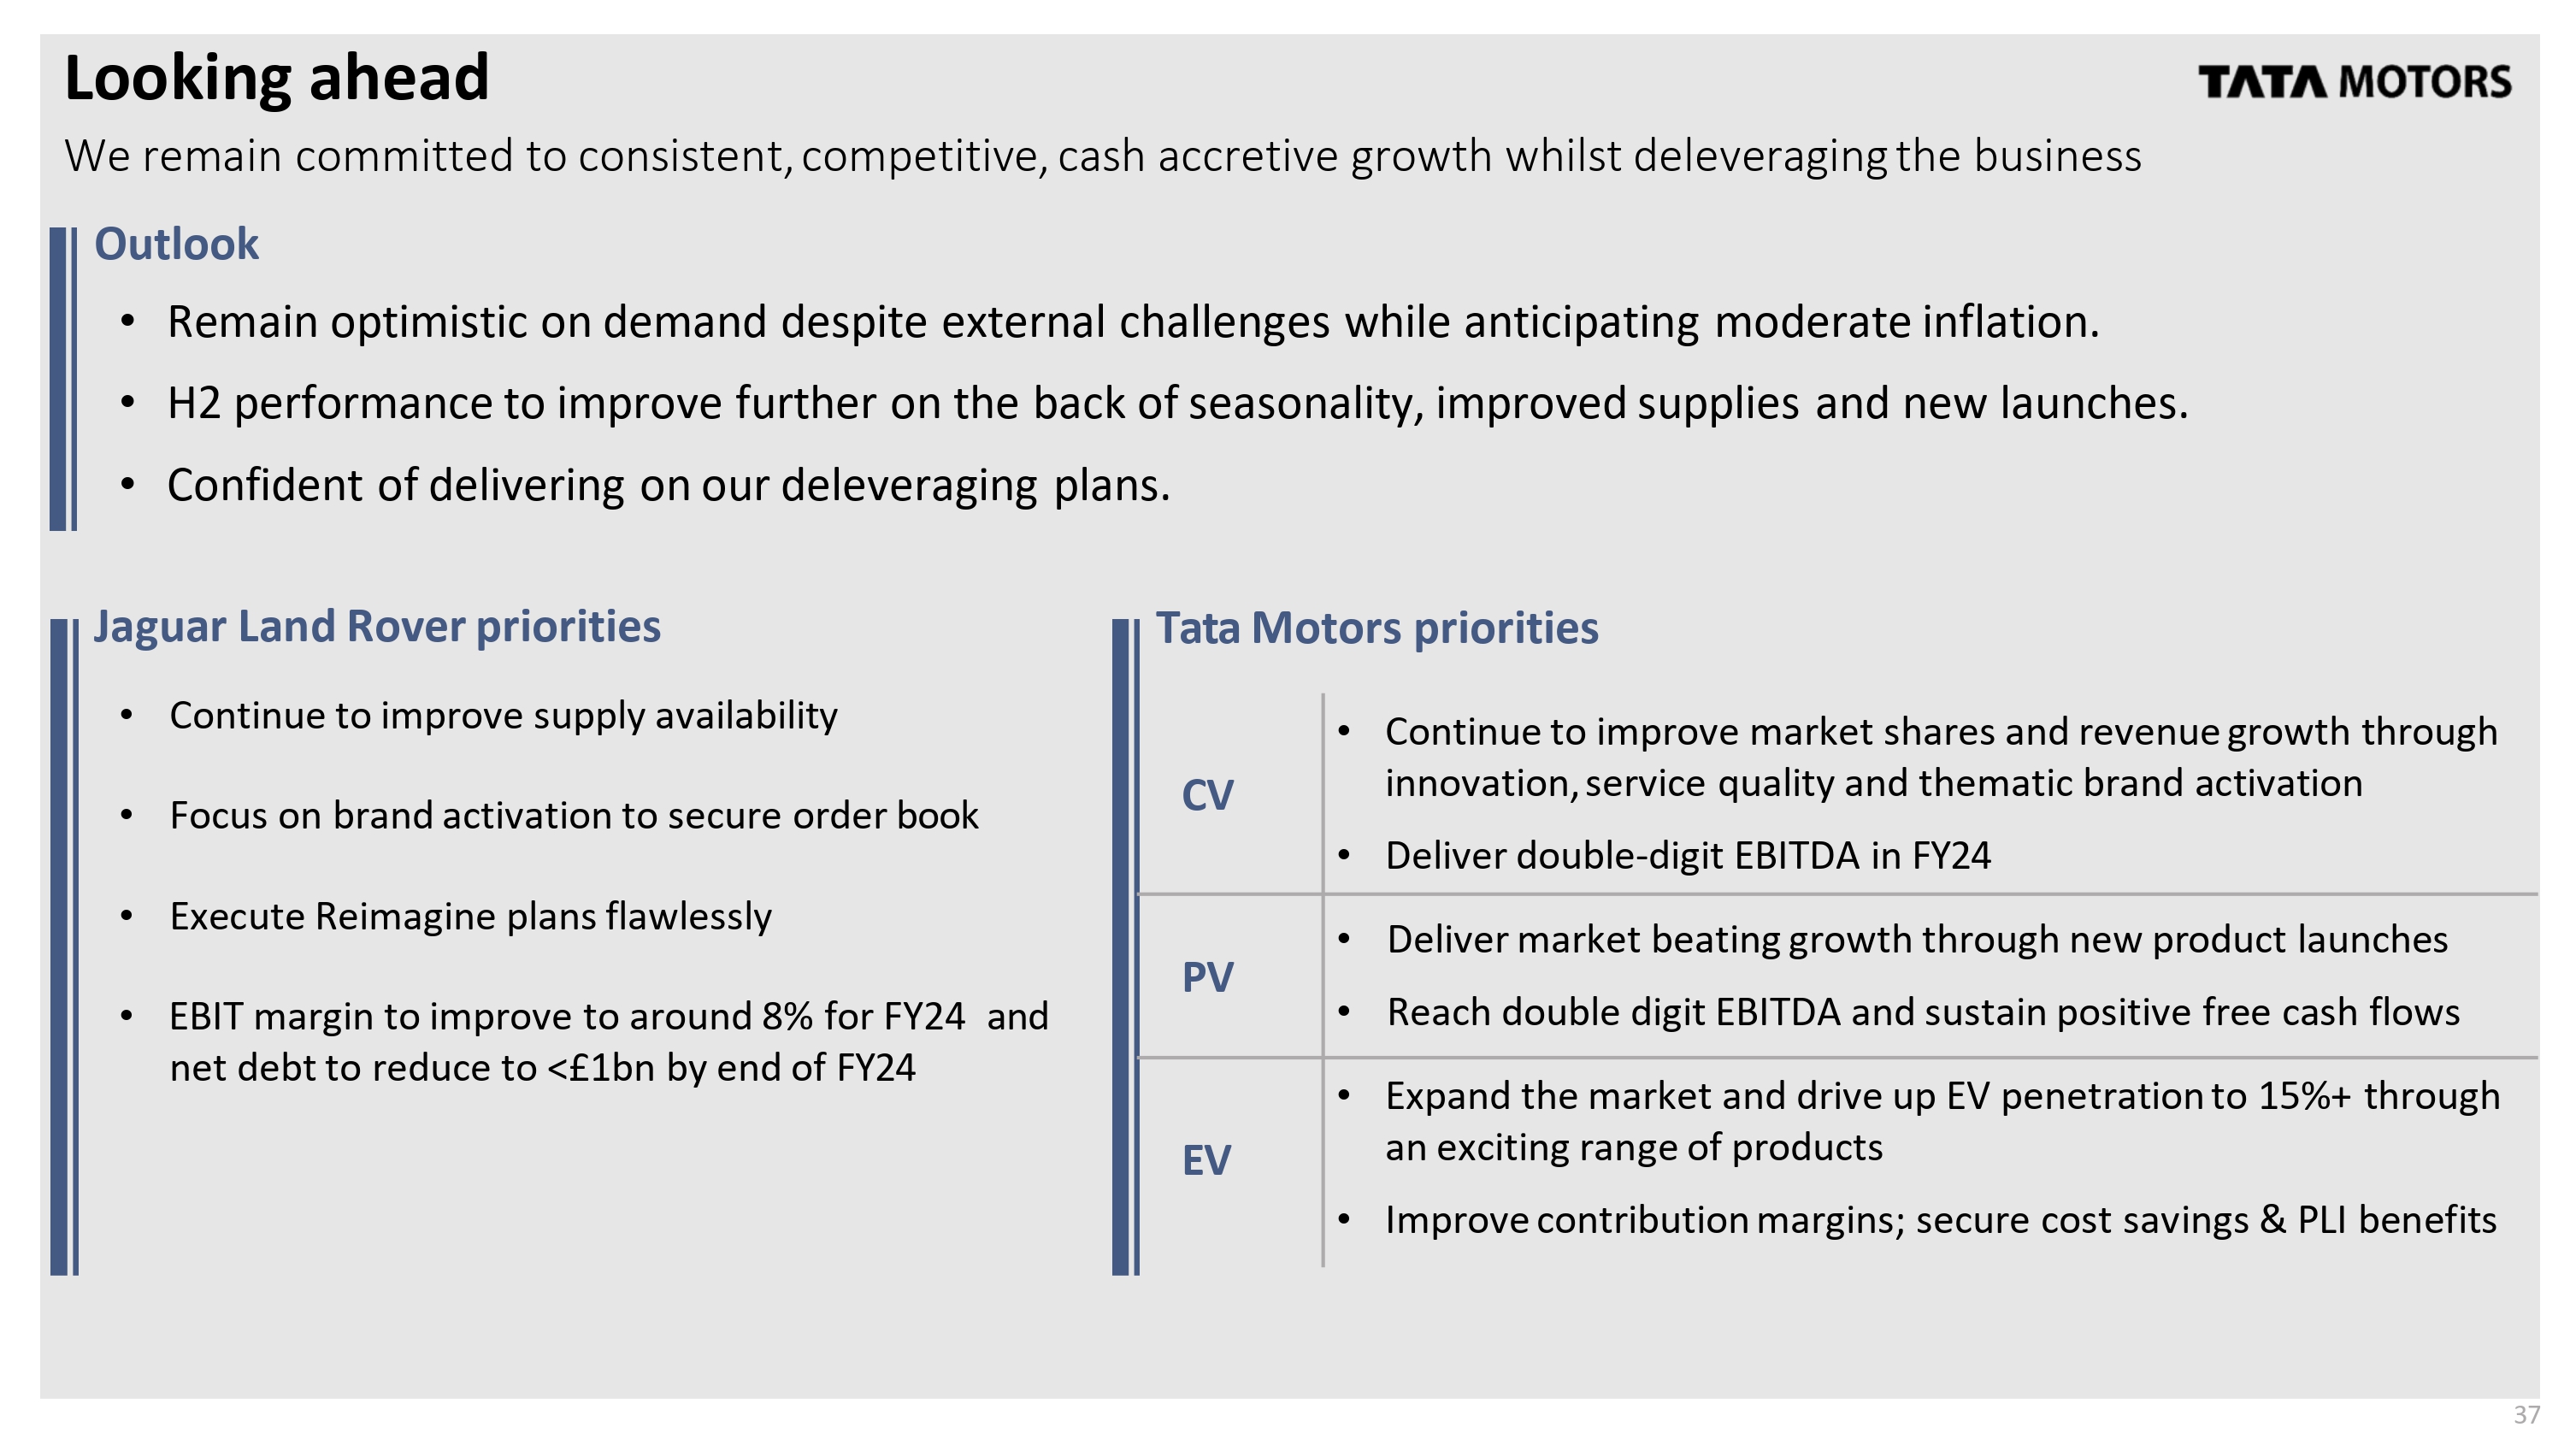
Looking ahead We remain committed to consistent, competitive, cash accretive growth whilst deleveraging the business Outlook • Remain optimistic on demand despite external challenges while anticipating moderate inflation. • H2 performance to improve further on the back of seasonality, improved supplies and new launches. • Confident of delivering on our deleveraging plans. Jaguar Land Rover priorities Tata Motors priorities • Continue to improve supply availability • Focus on brand activation to secure order book • Execute Reimagine plans flawlessly • EBIT margin to improve to around 8% for FY24 and net debt to reduce to <£1bn by end of FY24 CV • Continue to improve market shares and revenue growth through innovation, service quality and thematic brand activation • Deliver double-digit EBITDA in FY24 PV • Deliver market beating growth through new product launches • Reach double digit EBITDA and sustain positive free cash flows EV • Expand the market and drive up EV penetration to 15%+ through an exciting range of products • Improve contribution margins; secure cost savings & PLI benefits 7
Please submit your questions in the Q&A textbox Please mention your name and name of the organization you represent along with the questions Thank you Q&A session 8
Tata Motors Group : Additional details Results for the quarter ended Sep 30, 20239
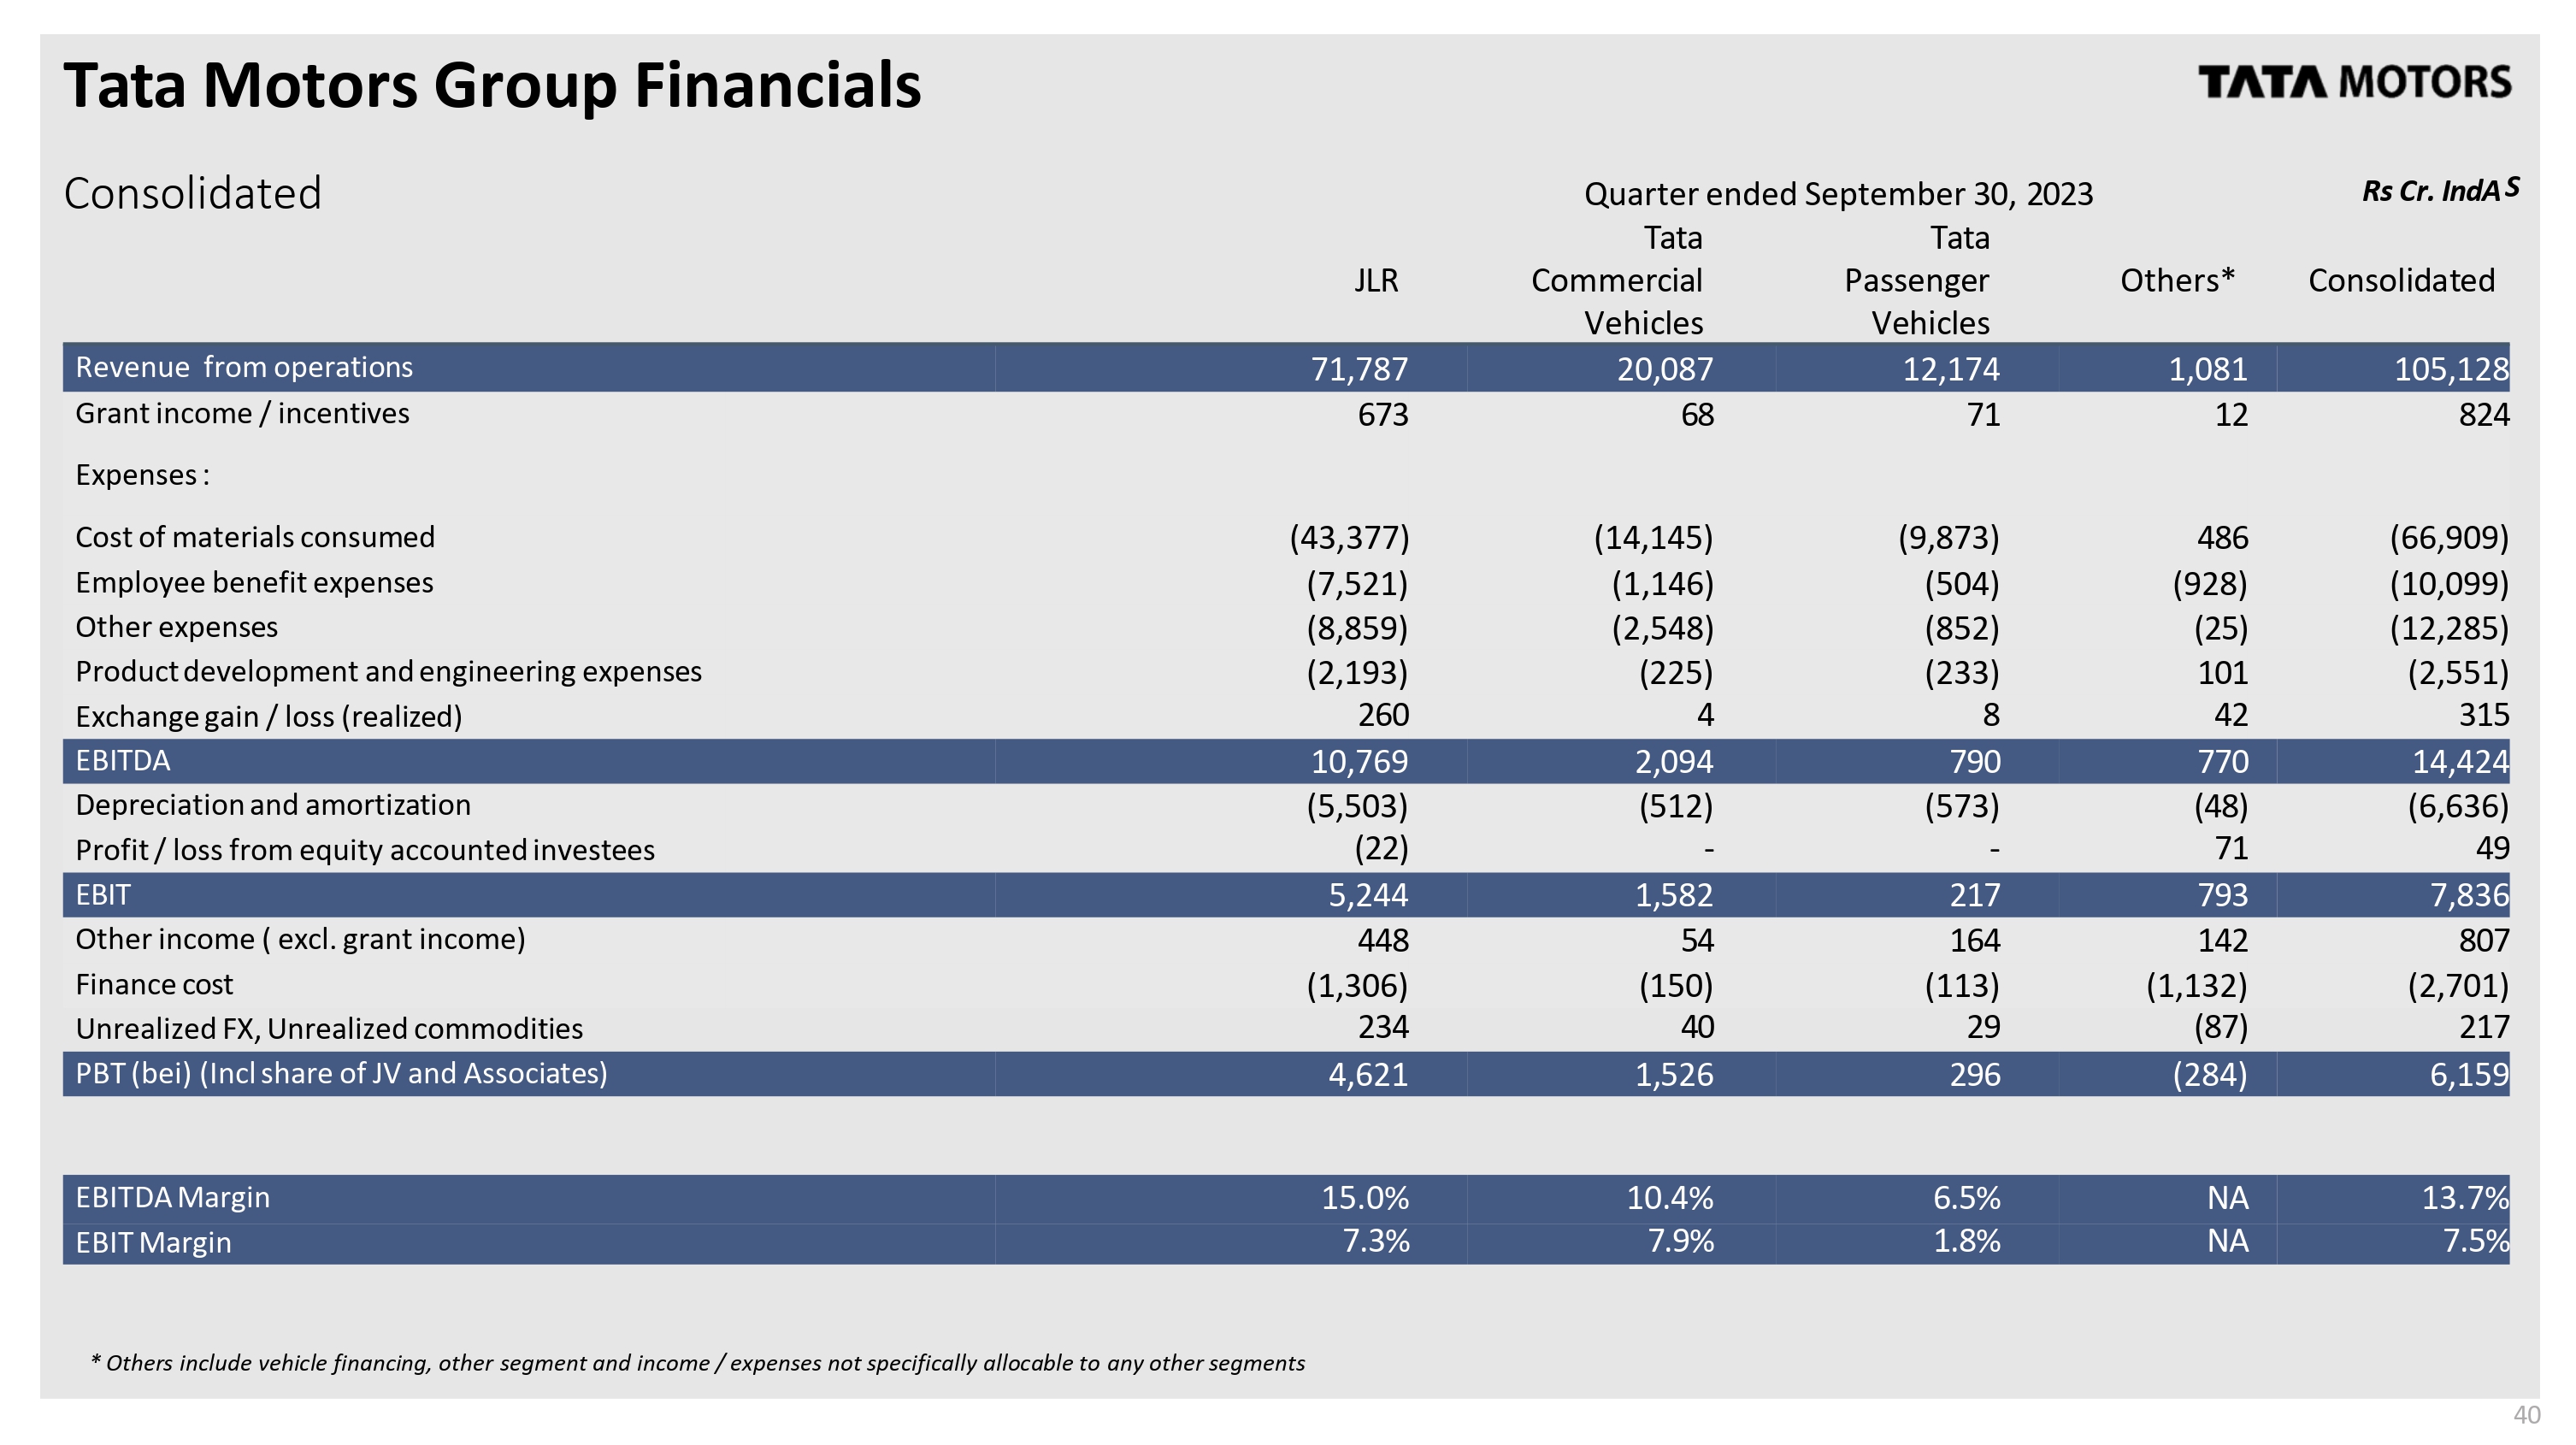
Tata Motors Group Financials Consolidated Quarter ended September 30, 2023 Rs Cr. IndA JLR Tata Commercial Vehicles Tata Passenger Vehicles Others* Consolidated Revenue from operations 71,787 20,087 12,174 1,081 105,128 Grant income / incentives 673 68 71 12 824 Expenses : Cost of materials consumed (43,377) (14,145) (9,873) 486 (66,909) Employee benefit expenses (7,521) (1,146) (504) (928) (10,099) Other expenses (8,859) (2,548) (852) (25) (12,285) Product development and engineering expenses (2,193) (225) (233) 101 (2,551) Exchange gain / loss (realized) 260 4 8 42 315 EBITDA 10,769 2,094 790 770 14,424 Depreciation and amortization (5,503) (512) (573) (48) (6,636) Profit / loss from equity accounted investees (22) - - 71 49 EBIT 5,244 1,582 217 793 7,836 Other income ( excl. grant income) 448 54 164 142 807 Finance cost (1,306) (150) (113) (1,132) (2,701) Unrealized FX, Unrealized commodities 234 40 29 (87) 217 PBT (bei) (Incl share of JV and Associates) 4,621 1,526 296 (284) 6,159 EBITDA Margin 15.0% 10.4% 6.5% NA 13.7% EBIT Margin 7.3% 7.9% 1.8% NA 7.5% * Others include vehicle financing, other segment and income / expenses not specifically allocable to any other segments 10 S
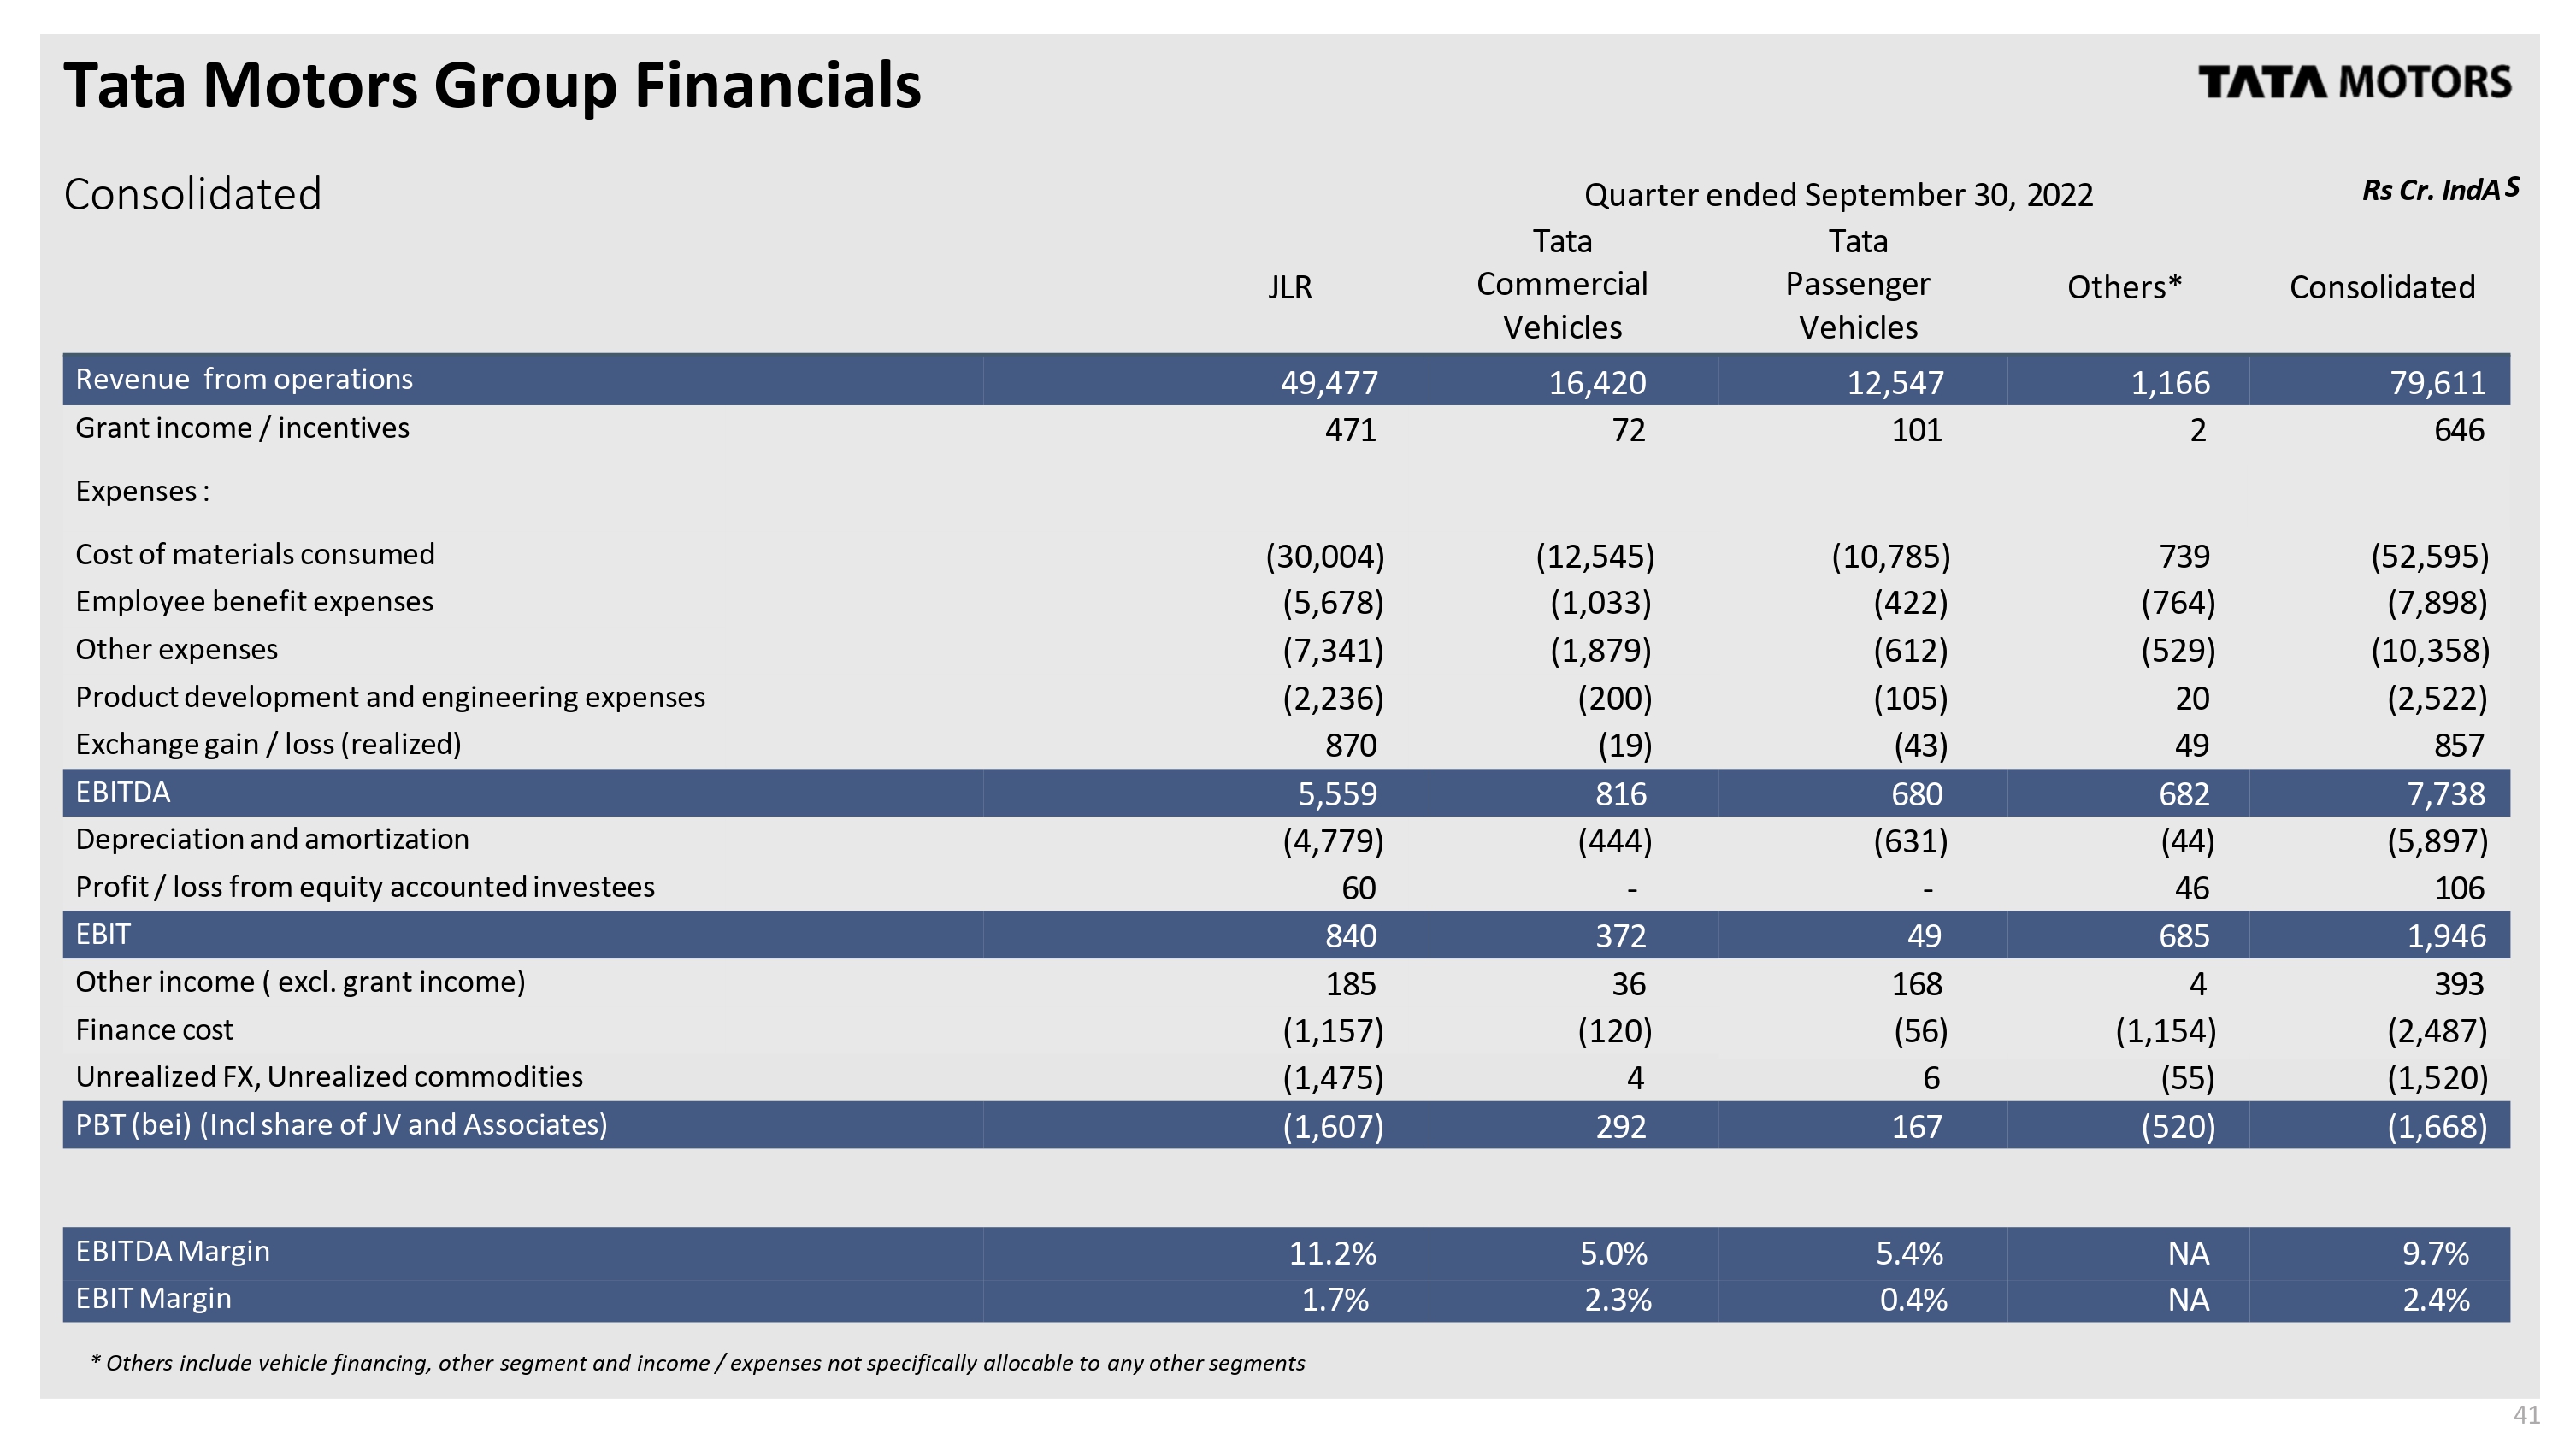
Tata Motors Group Financials TATA MOTORS Consolidated Quarter ended September 30, 2022 Rs Cr. IndA JLR Tata Commercial Vehicles Tata Passenger Vehicles Others* Consolidated Revenue from operations 49,477 16,420 12,547 1,166 79,611 Grant income / incentives 471 72 101 2 646 Expenses Cost of materials consumed (30,004) (12,545) (10,785) 739 (52,595) Employee benefit expenses (5,678) (1,033) (422) (764) (7,898) Other expenses (7,341) (1,879) (612) (529) (10,358) Product development and engineering expenses (2,236) (200) (105) 20 (2,522) Exchange gain / loss (realized) 870 (19) (43) 49 857 EBITDA 5,559 816 680 682 7,738 Depreciation and amortization (4,779) (444) (631) (44) (5,897) Profit / loss from equity accounted investees 60 46 106 EBIT 840 372 49 685 1,946 Other income ( excl. grant income) 185 36 168 4 393 Finance cost (1,157) (120) (56) (1,154) (2,487) Unrealized FX, Unrealized commodities (1,475) 4 6 (55) (1,520) PBT (bei) (Incl share of JV and Associates) (1,607) 292 167 (520) (1,668) EBITDA Margin 11.2% 5.0% 5.4% NA 9.7% EBIT Margin 1.7% 2.3% 0.4% NA 2.4% * Others include vehicle financing, other segment and income / expenses not specifically allocable to any other segments 41 S
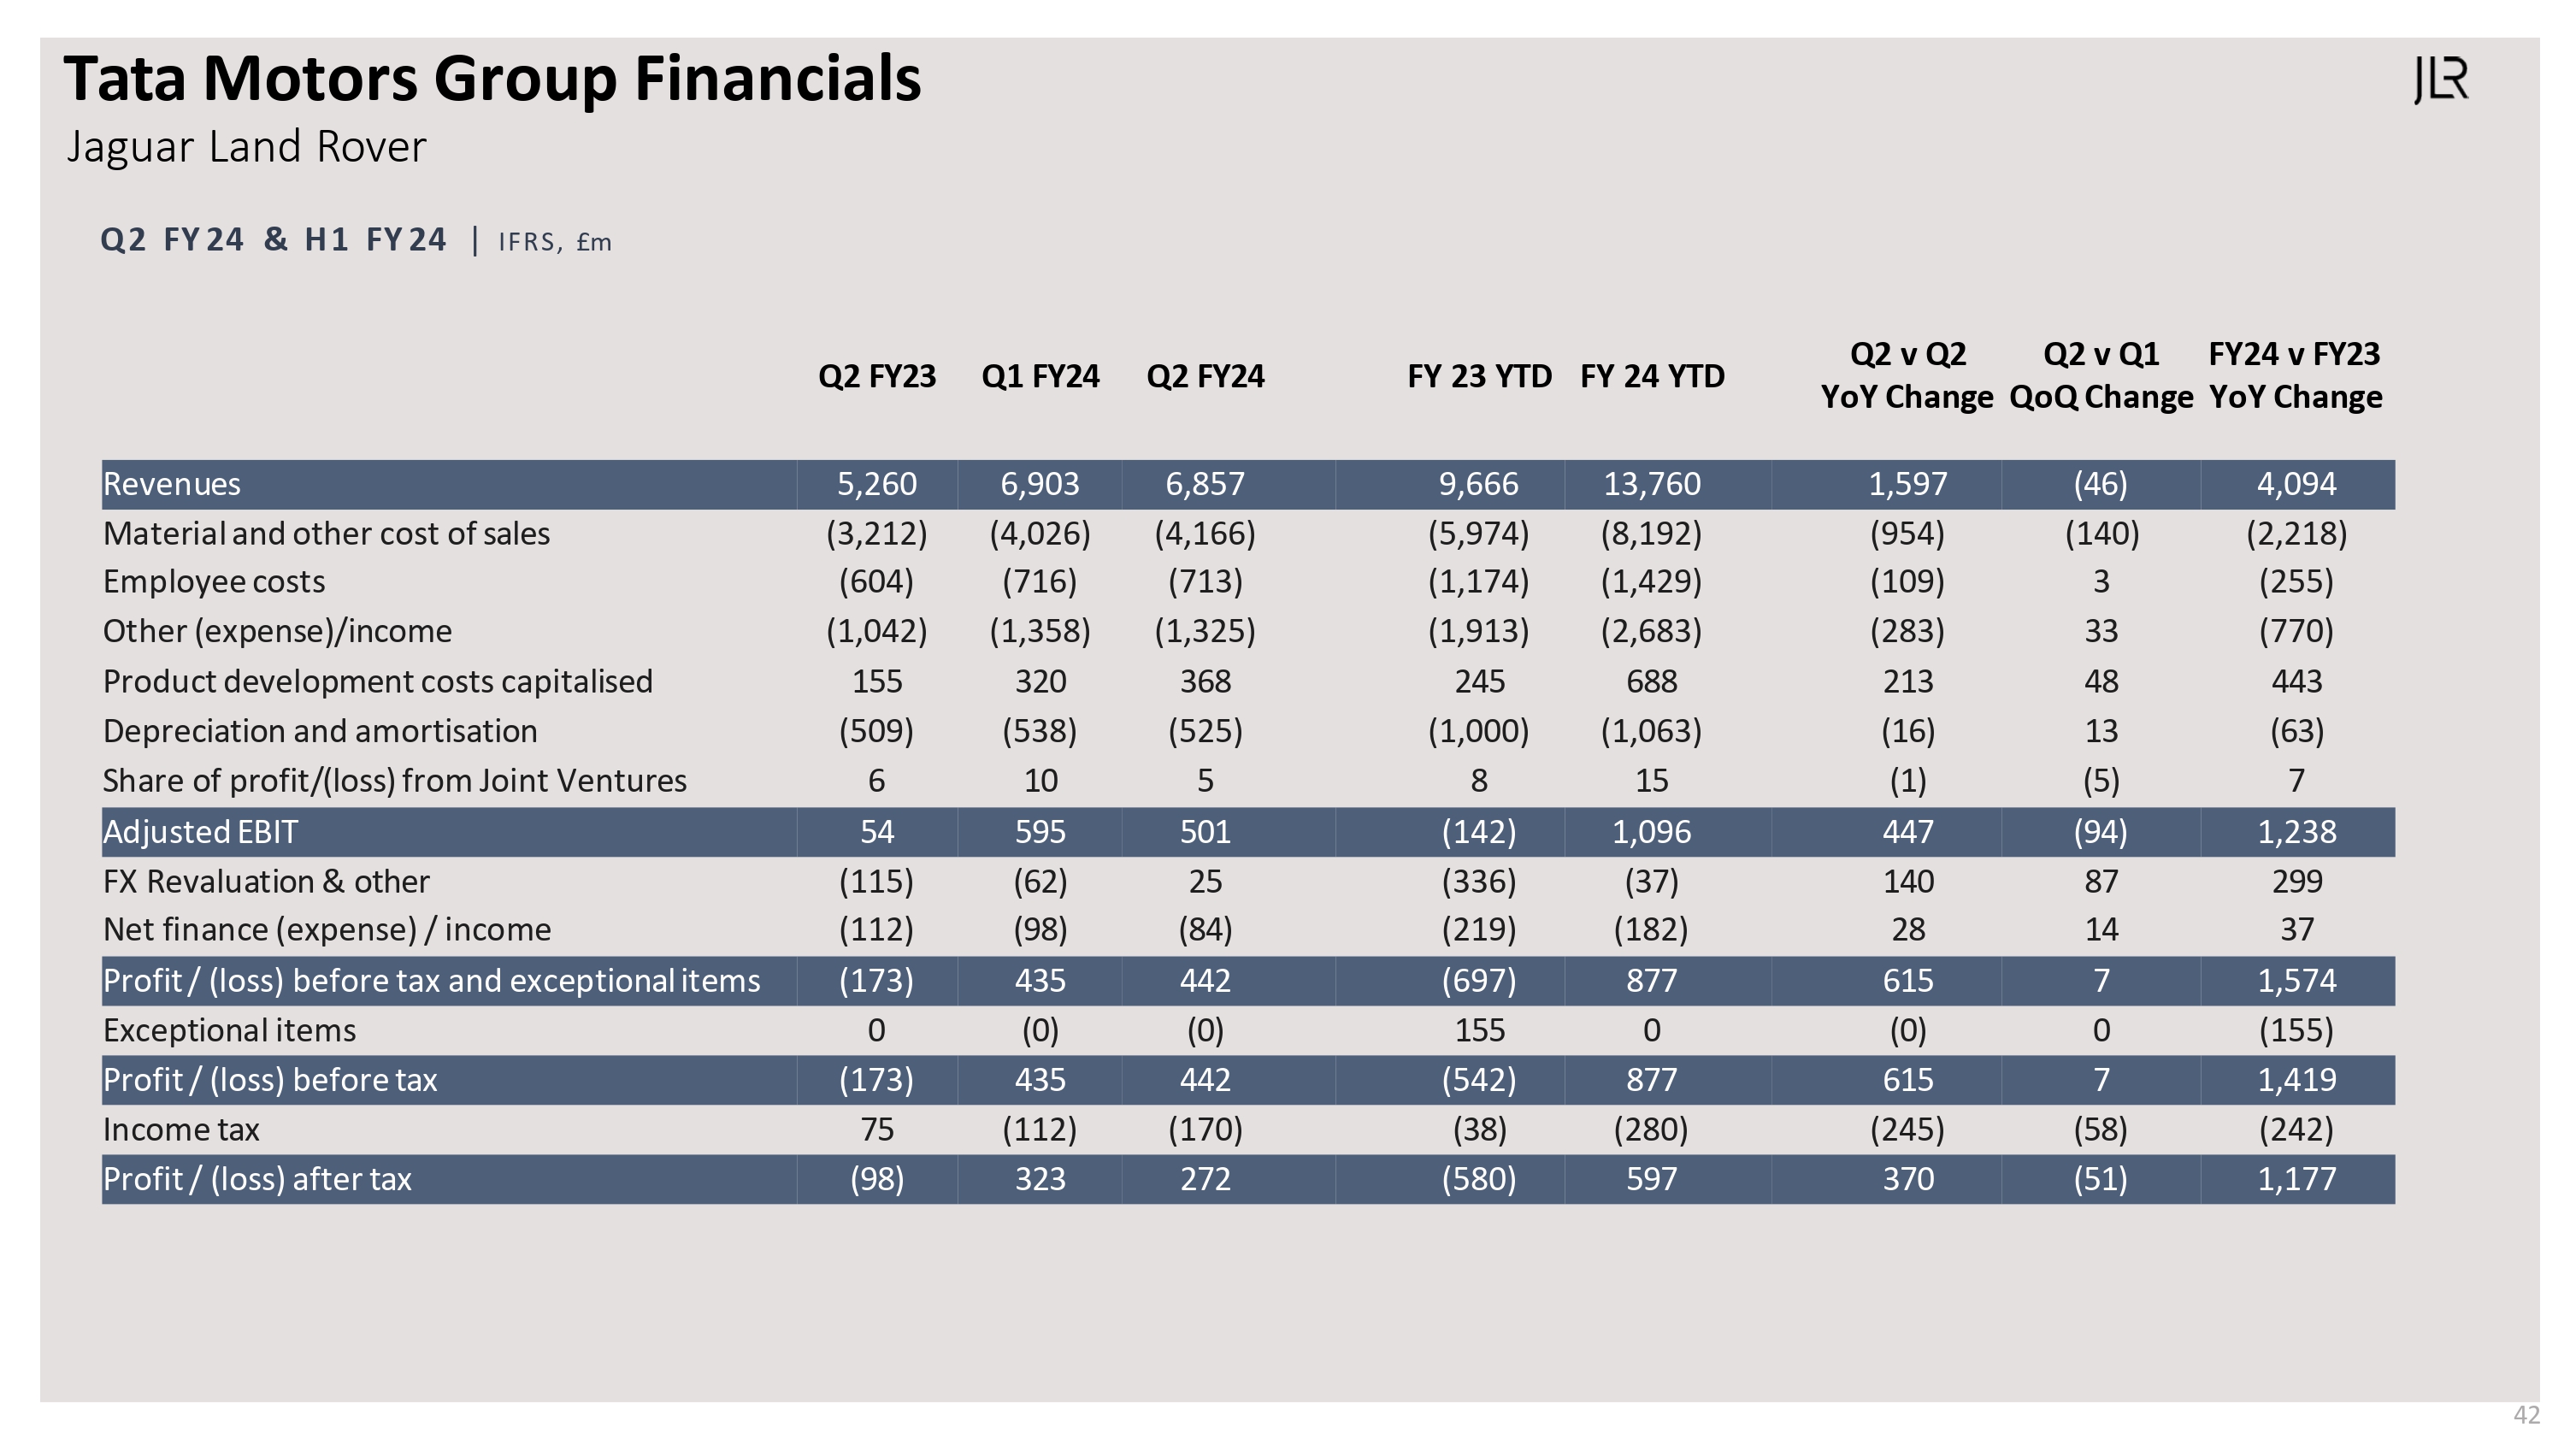
Tata Motors Group Financials 42 Jaguar Land Rover Q2 FY 24 & H1 FY24 | IFRS, £m Q2 FY23 Q1 FY24 Q2 FY24 FY 23 YTD FY 24 YTD Q2 v Q2 YoY Change Q2 v Q1 QoQ Change FY24 v FY23 YoY Change Revenues 5,260 6,903 6,857 9,666 13,760 1,597 (46) 4,094 Material and other cost of sales (3,212) (4,026) (4,166) (5,974) (8,192) (954) (140) (2,218) Employee costs (604) (716) (713) (1,174) (1,429) (109) 3 (255) Other (expense)/income (1,042) (1,358) (1,325) (1,913) (2,683) (283) 33 (770) Product development costs capitalised 155 320 368 245 688 213 48 443 Depreciation and amortisation (509) (538) (525) (1,000) (1,063) (16) 13 (63) Share of profit/(loss) from Joint Ventures 6 10 5 8 15 (1) (5) 7 Adjusted EBIT 54 595 501 (142) 1,096 447 (94) 1,238 FX Revaluation & other (115) (62) 25 (336) (37) 140 87 299 Net finance (expense) / income (112) (98) (84) (219) (182) 28 14 37 Profit / (loss) before tax and exceptional items (173) 435 442 (697) 877 615 7 1,574 Exceptional items 0 (0) (0) 155 0 (0) 0 (155) Profit / (loss) before tax (173) 435 442 (542) 877 615 7 1,419 Income tax 75 (112) (170) (38) (280) (245) (58) (242) Profit / (loss) after tax (98) 323 272 (580) 597 370 (51) 1,177
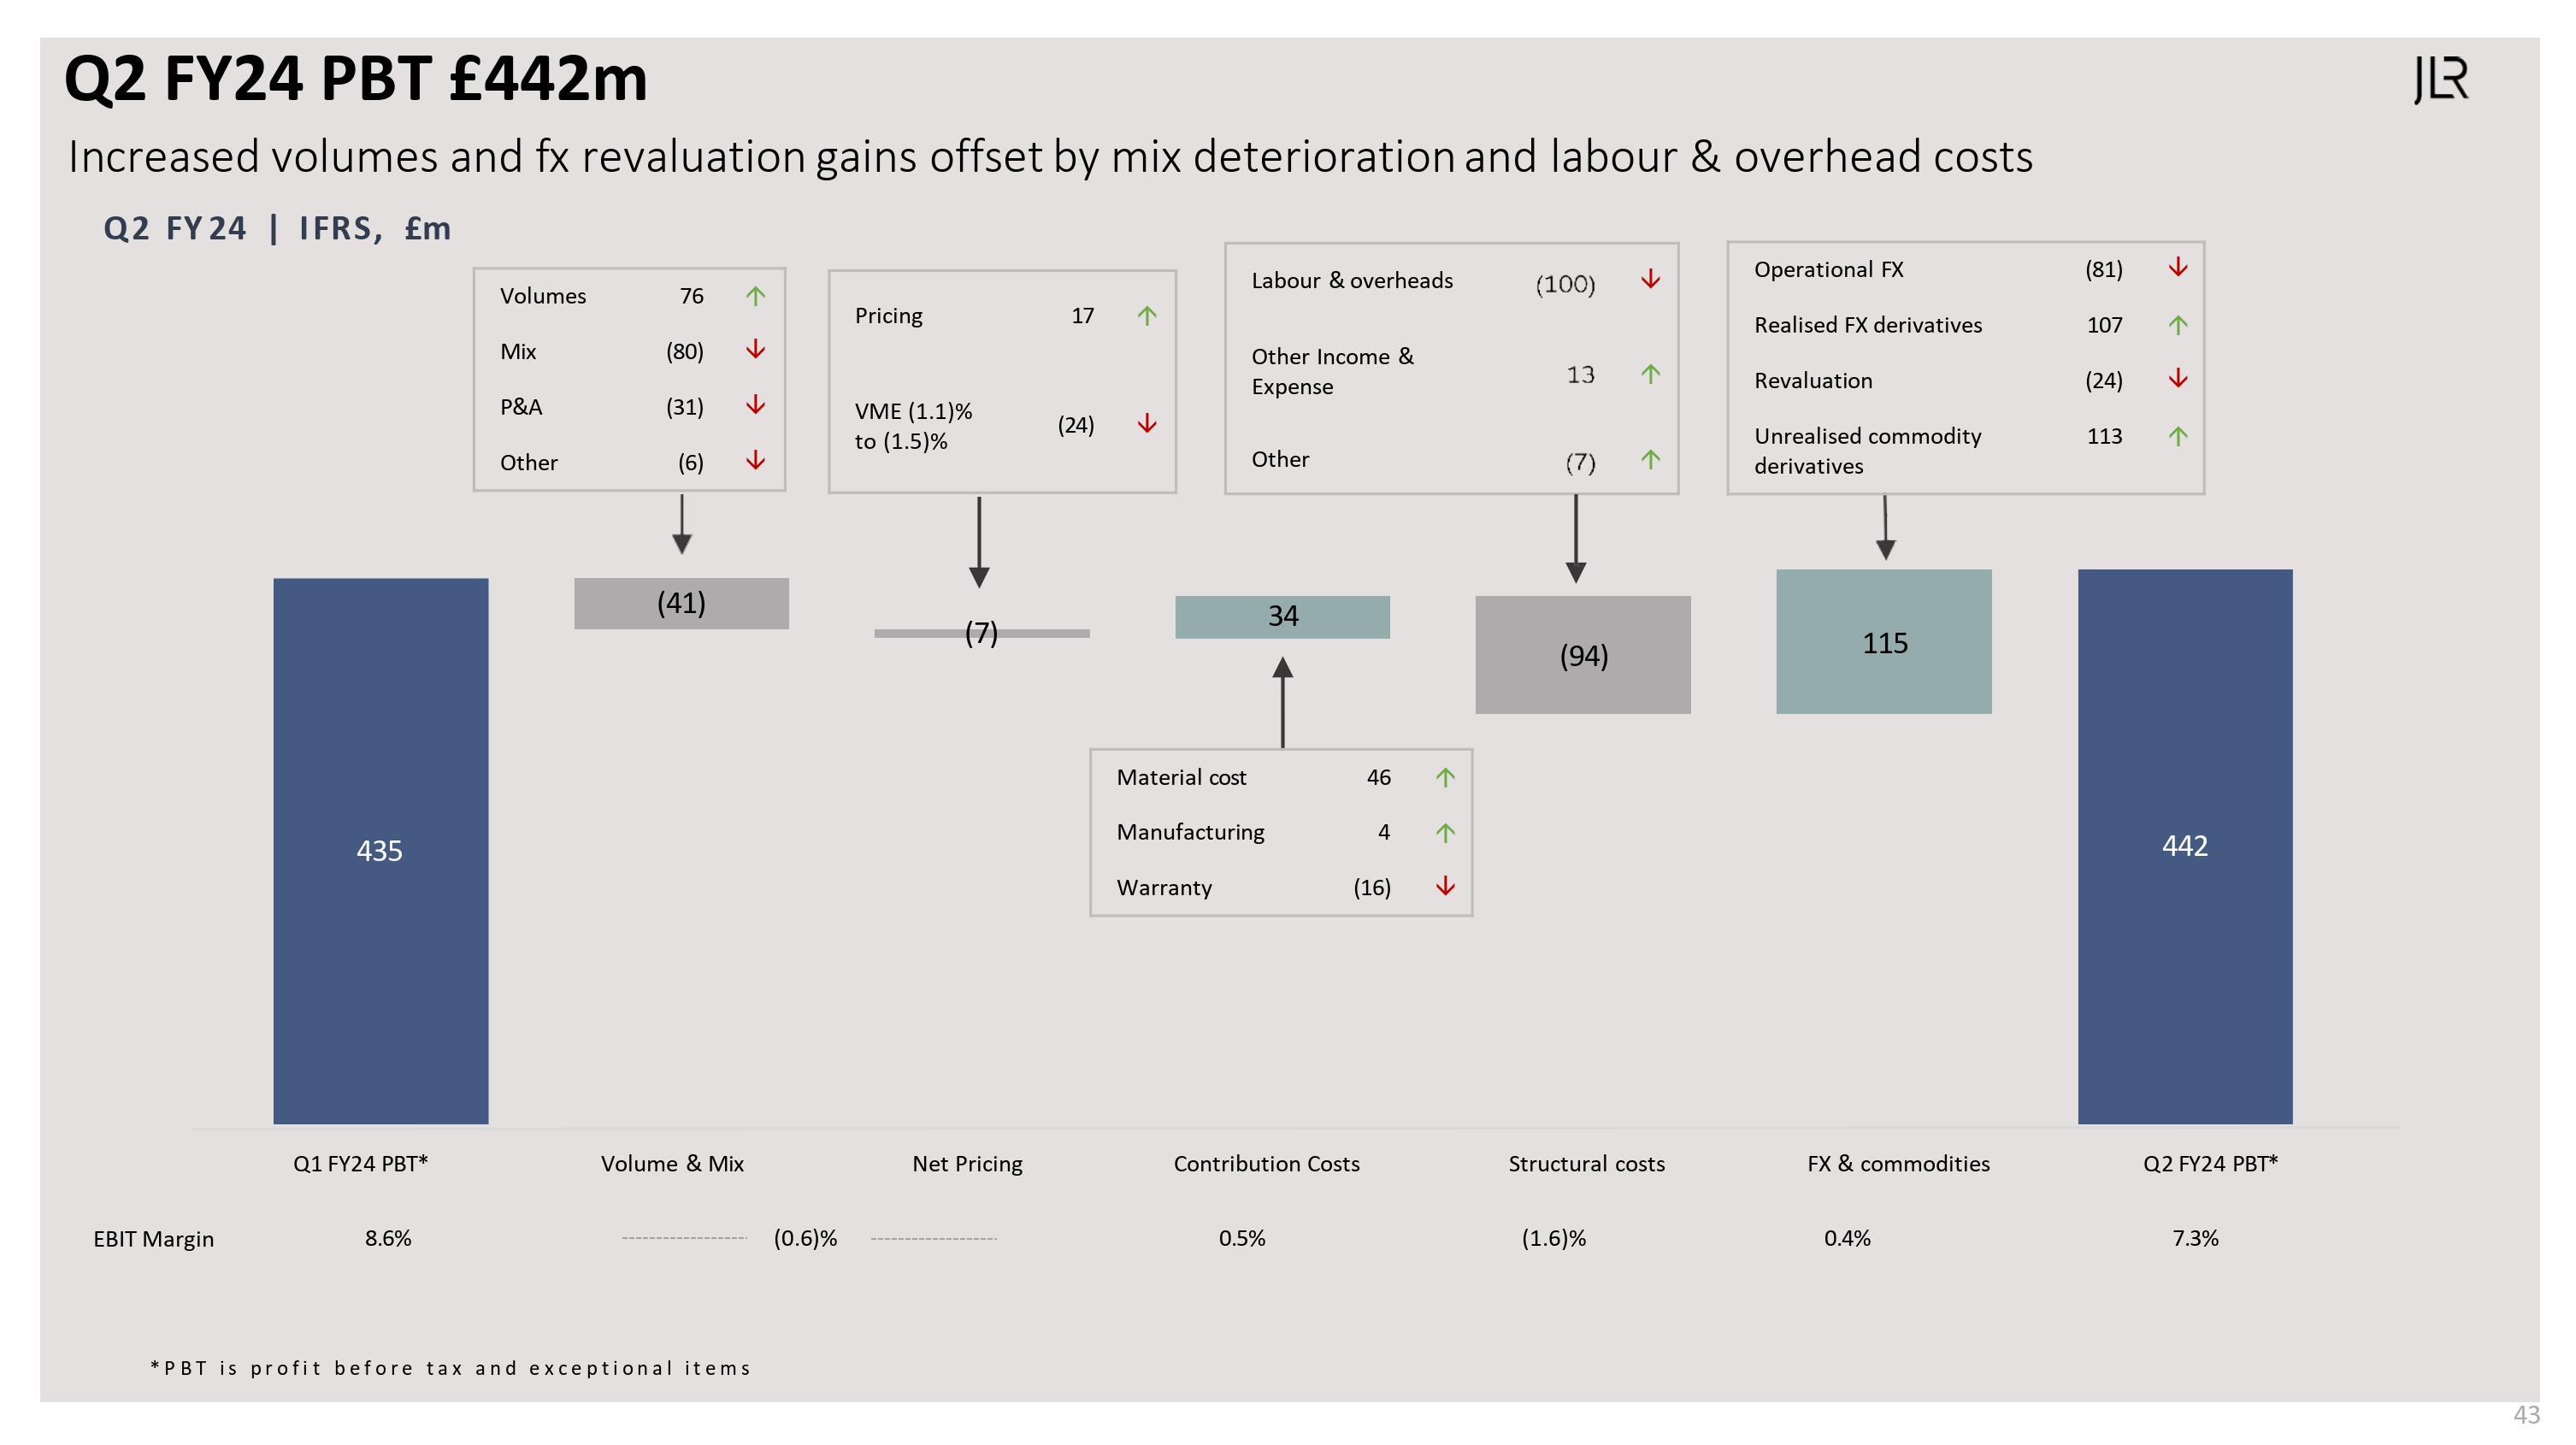
Q2 FY24 PBT £442m Increased volumes and fx revaluation gains offset by mix deterioration and labour & overhead costs Q2 FY24 FRS, £m * PBT is profit before tax and exceptional items 435 (41) (7) 34 (94) 115 442 Volumes 76 Mix (80) P&A (31) Other (6) Q1 FY24 PBT* Volume & Mix Net Pricing Contribution Costs Structural costs FX & commodities Q2 FY24 PBT* Labour & overheads Other Income & Expense Other Pricing 17 VME (1.1)% to (1.5)% (24) 8.6% (0.6)% 0.5% (1.6)% 0.4% 7.3% EBIT Margin 43 Material cost 46 Manufacturing 4 Warranty (16) Operational FX (81) Realised FX derivatives 107 Revaluation (24) Unrealised commodity derivatives 113
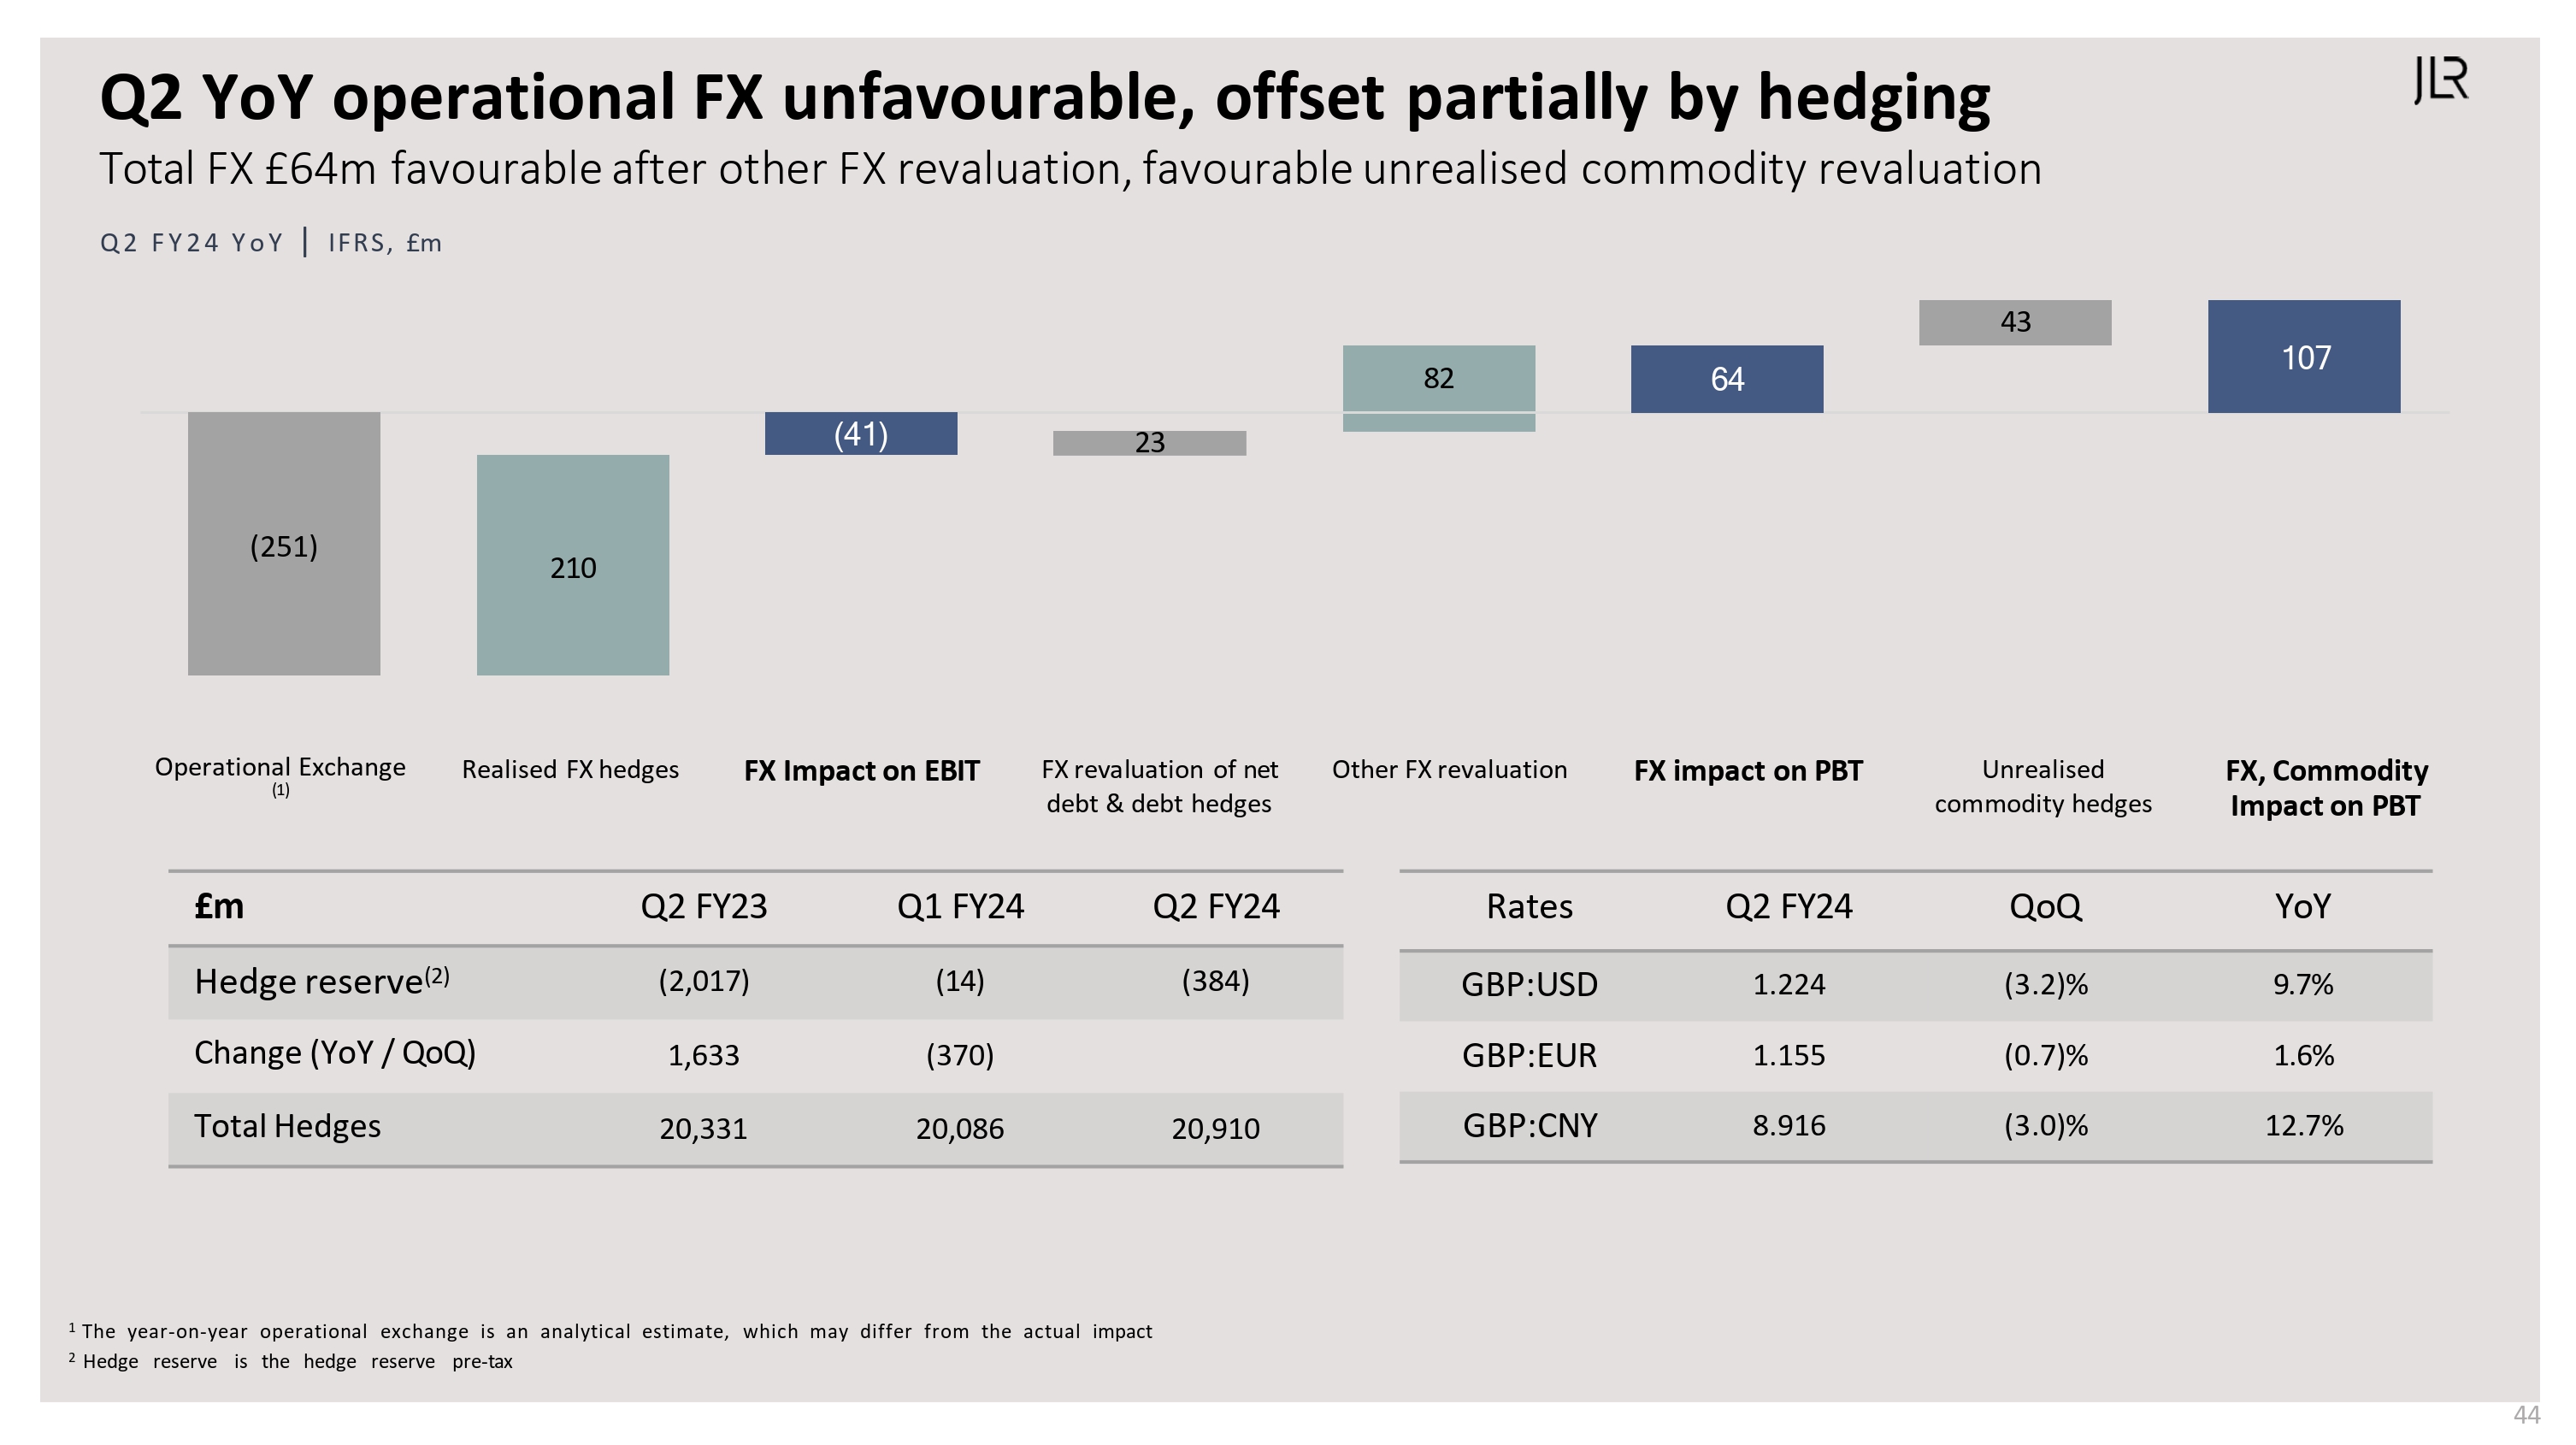
Q2 YoY operational FX unfavourable, offset partially by hedging Total FX £64m favourable after other FX revaluation, favourable unrealised commodity revaluation Q2 FY 2 4 Y o Y | IFRS, £m (41) 44 64 107 (251) 210 23 82 43 Operational Exchange (1) Realised FX hedges FX Impact on EBIT FX revaluation of net debt & debt hedges Other FX revaluation FX impact on PBT Unrealised commodity hedges FX, Commodity Impact on PBT Rates Q2 FY24 QoQ YoY GBP:USD 1.224 (3.2)% 9.7% GBP:EUR 1.155 (0.7)% 1.6% GBP:CNY 8.916 (3.0)% 12.7% £m Q2 FY23 Q1 FY24 Q2 FY24 Hedge reserve(2) (2,017) (14) (384) Change (YoY / QoQ) 1,633 (370) Total Hedges 20,331 20,086 20,910 1 The year-on-year operational exchange is an analytical estimate, which may differ from the actual impact 2 Hedge reserve is the hedge reserve pre-tax

Q2 Retails of 106.6K, up 21% yoy and up 4.5% qoq H1 Retails of 209k, up 25% year-on year FY 24 Retails Brands Unit in 000’s RANGE ROVER DEFENDER DISCOVERY JAGUAR TOTAL Q2 Q1 Q2 Q2 Q1 Q2 Q2 Q1 Q2 Q2 Q1 Q2 Q2 Q1 Q2 FY23 FY24 FY24 FY23 FY24 FY24 FY23 FY24 FY24 FY23 FY24 FY24 FY23 FY24 FY24 FY23 FY24 FY23 FY24 FY23 FY24 FY23 FY24 FY23 FY24 T O T A L Q 2 F Y 2 4 Y T D 40.3 16.9 13.6 17.3 47.5 27.6 11.4 15.5 48.8 30.3 11.2 16.3 77.3 31.4 25.7 32.5 96.4 57.9 22.6 31.7 88.1 102.0 106.6 166.9 45 208.6
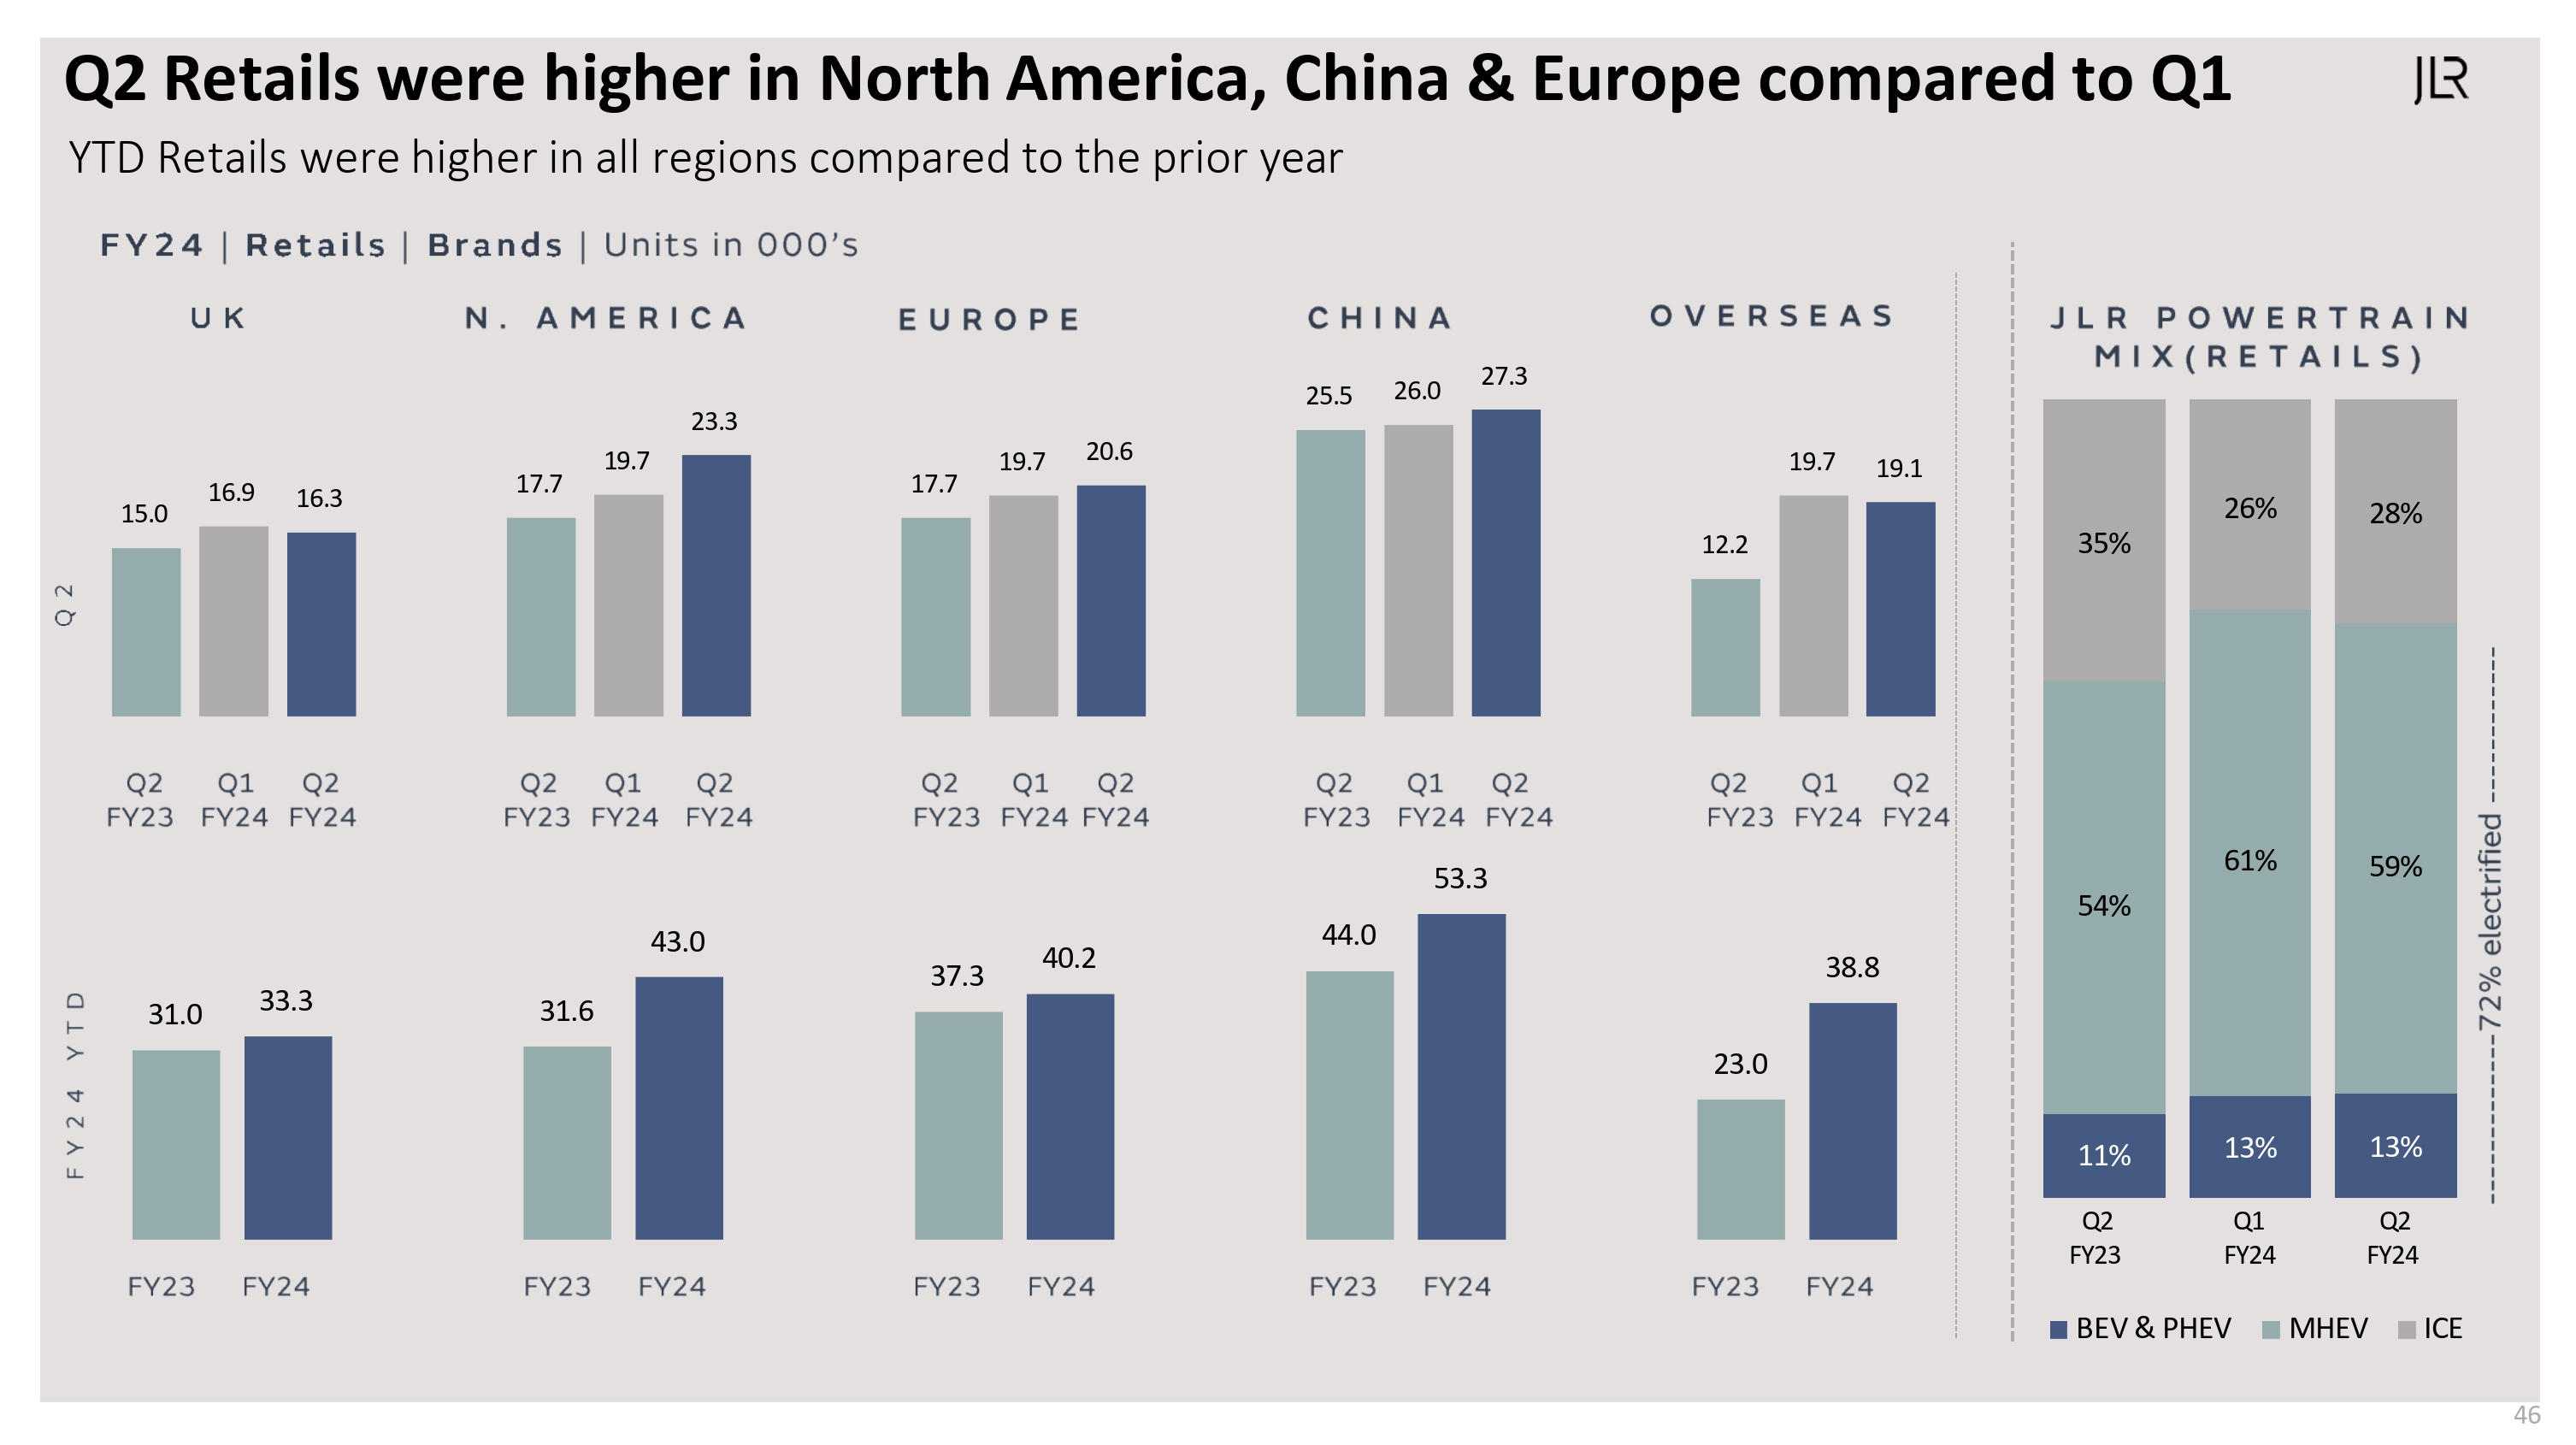
Q2 Retails were higher in North America, China & Europe compared to Q1 YTD Retails were higher in all regions compared to the prior year FY24 Retails Brands Units in ooo's UK N. AMERICA EUROPE HINA OERSEAS JLR POWERTRAIN MIX (RETAILS) 15.0 17.7 17.7 25.5 12.2 16.9 19.7 19.7 26.0 19.7 16.3 23.3 20.6 27.3 19.1 31.0 31.6 37.3 44.0 23.0 33.3 43.0 40.2 53.3 38.8 11% 13% 13% 54% 61% 59% 35% 26% 28% BEV & PHEV MHEV ICE Q2 FY23 Q1 FY24 Q2 FY24 46 Q2 FY23 Q1 FY24 Q2 FY24 Q2 FY23 Q1 FY24 Q2 FY24 Q2 FY23 Q1 FY24 Q2 FY24 Q2 FY23 Q1 FY24 Q2 FY24

Debt profile Strong liquidity; debt maturities well spread out £5.8b Liquidity Cash, 4,293 RCF, 1,520 625 2,070 4,563 1,997 250 271 9,776 5,386 5,386 CY23 CY24 CY25 CY26 CY27 Thereafter Total Borrowings Long Term Debt Short Term Finance Lease Tata Domestic Business* Debt maturity profile IndAS ₹ Crores IFRS, £m JLR Debt maturity profile Total 16,083 921 ₹ 8.5 K Cr Liquidity Cash, 8,522 995 569 754 383 1,364 4,065 63 774 120 1,748 Undrawn RCF 1520 729 CY23 CY24 Total Borrowings Bonds CY 25 CY 26 CY 27 Thereafter Bank facilities Finance Lease & others Total 6,542 791 * *Includes data for Domestic CV, PV, EV business and Joint operation – Tata Cummins and FIAPL 47 *£0.6bn equivalent China loan facility extended to CY26 but shown at next annual review in CY24
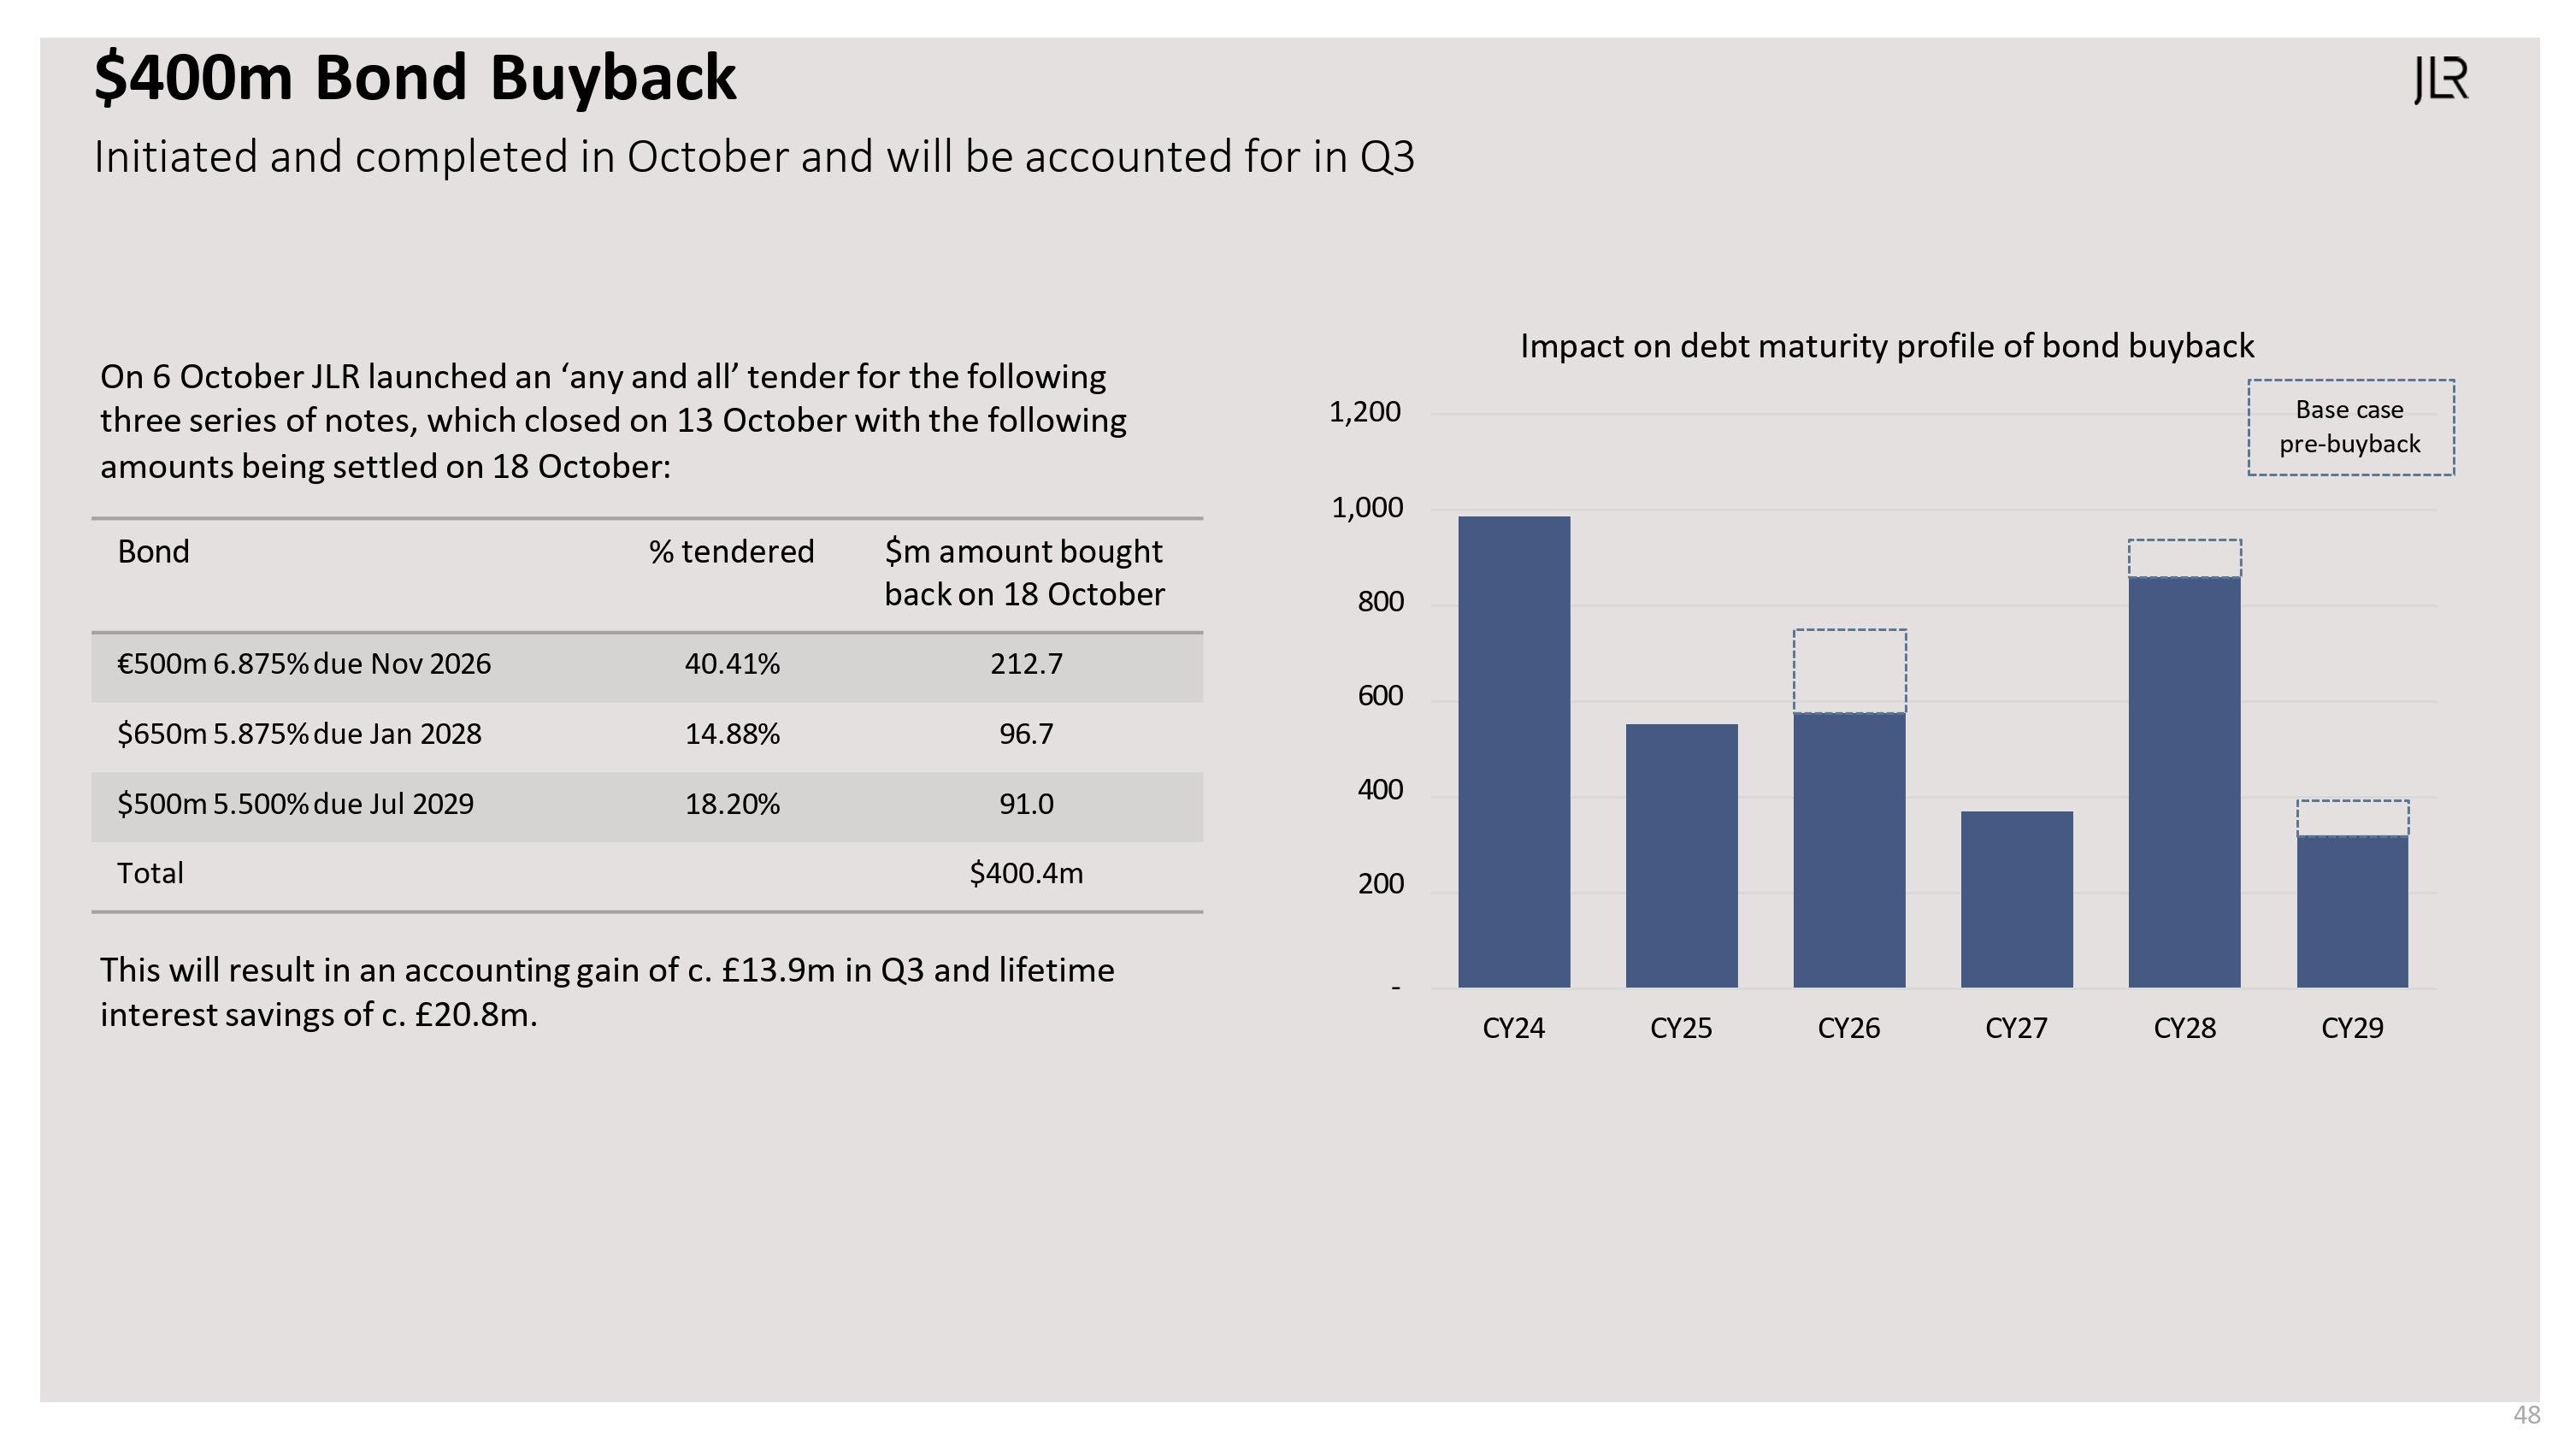
$400m Bond Buyback Initiated and completed in October and will be accounted for in Q3 On 6 October JLR launched an ‘any and all’ tender for the following three series of notes, which closed on 13 October with the following amounts being settled on 18 October:- Impact on debt maturity profile of bond buyback 1,000 800 600 400 200 1,200 CY24 CY25 CY26 CY27 CY28 CY29Base case 48 pre-buyback Bond % tendered $m amount bought back on 18 October €500m 6.875% due Nov 2026 40.41% 212.7 $650m 5.875% due Jan 2028 14.88% 96.7 $500m 5.500% due Jul 2029 18.20% 91.0 Total $400.4m This will result in an accounting gain of c. £13.9m in Q3 and lifetime interest savings of c. £20.8m.

China JV continues to deliver improved financial performance Q 2 FY 24 & H 1 FY 24 | IFRS, £m (Presented on 100% basis) Q2 FY23 Q1 FY24 Q2 FY24 FY 23 YTD FY 24 YTD Q2 v Q2 YoY Change Q2 v Q1 QoQ Change FY24 v FY23 YoY Change Retail volumes ('000 units) 15.2 12.9 13.1 26.2 26.0 (2.1) 0.2 (0.2) Wholesale volumes ('000 units) 14.6 13.0 12.3 25.4 25.4 (2.3) (0.7) - Revenue 504 430 374 867 804 (130) (56) (63) Profit/(Loss) – before tax 20 19 8 23 28 (12) (11) 5 Profit/(Loss) – after tax 12 17 6 15 23 (6) (11) 8 EBITDA Margin 13% 15% 13% 13% 15% - (2)% 2% EBIT Margin 4% 4% 2% 3% 4% (2)% (2)% 1% 49
About Tata Motors
Part of the USD 128 billion Tata group, Tata Motors Limited (BSE: 500570 and 570001; NSE: TATAMOTORS and TATAMTRDVR), a USD 42 billion organization, is a leading global automobile manufacturer of cars, utility vehicles, pick-ups, trucks and buses, offering extensive range of integrated, smart and e-mobility solutions. With ‘Connecting Aspirations’ at the core of its brand promise, Tata Motors is India’s market leader in commercial vehicles and amongst the top three in the passenger vehicles market.
Tata Motors strives to bring new products that fire the imagination of GenNext customers, fueled by state of the art design and R&D centers located in India, UK, US, Italy and South Korea. With a focus on engineering and tech enabled automotive solutions catering to the future of mobility, the company’s innovation efforts are focused to develop pioneering technologies that are sustainable as well as suited to evolving aspirations of the market and the customers. The company is pioneering India's Electric Vehicle (EV) transition and driving the shift towards sustainable mobility solutions by preparing a tailor-made product strategy, leveraging the synergy between the Group companies and playing an active role liasoning with the Government in developing the policy framework.
With operations in India, the UK, South Korea, Thailand, South Africa and Indonesia, Tata Motors’ vehicles are marketed in Africa, Middle East, Latin America, South East Asia and South Asian Association for Regional Cooperation (SAARC) countries. As of March 31, 2023, Tata Motors’ operations inter alia includes 88 consolidated subsidiaries, 2 joint operations, 3 joint ventures and numerous equity-accounted associates, including their subsidiaries, in respect of which the company exercises significant influence.
To know more, please visit (www.tatamotors.com; also follow us on Twitter: https://twitter.com/TataMotors)
Media Contact Information:
Tata Motors Corporate Communications: +91 22-66657613 / indiacorpcomm@tatamotors.com
Safe Harbor: Statements included herein may constitute "forward-looking statements". Forward-looking statements are based on expectations, forecasts and assumptions by management and involve risks, uncertainties, and other factors that may cause our actual results, performance or achievements to materially differ from those stated. We cannot be certain that any expectation, forecast or assumption made by management in preparing these forward-looking statements will prove accurate, or that any projection will be realized. More detailed information about these and other factors that could affect future results is contained in our annual reports and filings with the Securities and Exchange Commission. Our forward-looking statements pertain to the date of their initial issuance, and we do not undertake to publicly update or revise any forward-looking statement, whether as a result of new information, future events or otherwise.
Tata Motors (NYSE:TTM)
Historical Stock Chart
Von Jun 2024 bis Jul 2024

Tata Motors (NYSE:TTM)
Historical Stock Chart
Von Jul 2023 bis Jul 2024
