false 0000894315 0000894315 2023-10-30 2023-10-30 0000894315 us-gaap:CommonStockMember 2023-10-30 2023-10-30 0000894315 sitc:ClassACumulativeRedeemablePreferredSharesMember 2023-10-30 2023-10-30
UNITED STATES
SECURITIES AND EXCHANGE COMMISSION
Washington, D.C. 20549
FORM 8-K
CURRENT REPORT
Pursuant to Section 13 OR 15(d)
of The Securities Exchange Act of 1934
Date of Report (Date of earliest event reported): October 30, 2023
SITE Centers Corp.
(Exact Name of Registrant as Specified in Its Charter)
|
|
|
|
|
| Ohio |
|
1-11690 |
|
34-1723097 |
| (State or Other Jurisdiction of Incorporation) |
|
(Commission File Number) |
|
(IRS Employer Identification No.) |
|
|
|
| 3300 Enterprise Parkway, Beachwood, Ohio |
|
44122 |
| (Address of Principal Executive Offices) |
|
(Zip Code) |
Registrant’s Telephone Number, Including Area Code (216) 755-5500
Not Applicable
(Former Name or Former Address, if Changed Since Last Report.)
Check the appropriate box below if the Form 8-K filing is intended to simultaneously satisfy the filing obligation of the registrant under any of the following provisions:
| ☐ |
Written communications pursuant to Rule 425 under the Securities Act (17 CFR 230.425) |
| ☐ |
Soliciting material pursuant to Rule 14a-12 under the Exchange Act (17 CFR 240.14a-12) |
| ☐ |
Pre-commencement communications pursuant to Rule 14d-2(b) under the Exchange Act (17 CFR 240.14d-2(b)) |
| ☐ |
Pre-commencement communications pursuant to Rule 13e-4(c) under the Exchange Act (17 CFR 240.13e-4(c)) |
Securities registered pursuant to Section 12(b) of the Act:
|
|
|
|
|
| Title of each class |
|
Trading Symbol(s) |
|
Name of each exchange on which registered |
| Common Shares, Par Value $0.10 Per Share |
|
SITC |
|
New York Stock Exchange |
| Depository Shares, each representing 1/20 of a share of 6.375% Class A Cumulative Redeemable Preferred Shares without Par Value |
|
SITC PRA |
|
New York Stock Exchange |
Indicate by check mark whether the registrant is an emerging growth company as defined in Rule 405 of the Securities Act of 1933 (§230.405 of this chapter) or Rule 12b-2 of the Securities Exchange Act of 1934 (§240.12b-2 of this chapter).
Emerging growth company ☐
If an emerging growth company, indicate by check mark if the registrant has elected not to use the extended transition period for complying with any new or revised financial accounting standards provided pursuant to Section 13(a) of the Exchange Act. ☐
| Item 7.01 |
Regulation FD Disclosure. |
On October 30, 2023, the Company issued a press release related to the planned spin-off of certain of its assets into a publicly traded REIT (“Press Release”) and announcement of a webcast presentation. A copy of the Company’s Press Release is furnished hereto as Exhibit 99.1 and a copy of the webcast presentation is furnished as Exhibit 99.2 to this report, both of which are incorporated herein by reference. This information shall not be deemed to be “filed” for the purposes of Section 18 of the Exchange Act or otherwise subject to the liabilities of that section, nor shall it be incorporated by reference into a filing under the Securities Act or the Exchange Act, except as shall be set forth by specific reference in such filing.
| Item 9.01 |
Financial Statements and Exhibits. |
(d) Exhibits.
SIGNATURES
Pursuant to the requirements of the Securities Exchange Act of 1934, the registrant has duly caused this report to be signed on its behalf by the undersigned hereunto duly authorized.
|
|
|
| SITE Centers Corp. |
|
|
| By: |
|
/s/ Aaron Kitlowski |
| Name: |
|
Aaron Kitlowski |
| Title: |
|
Executive Vice President, |
|
|
General Counsel and Secretary |
Date: November 1, 2023
Exhibit 99.1
|
|
|
|
|
| SITE Centers Corp. 3300 Enterprise Parkway
Beachwood, OH 44122 216-755-5500 |
|

|
|
For additional information:
Conor Fennerty, EVP and Chief
Financial Officer |
FOR IMMEDIATE RELEASE:
SITE Centers Announces Spin-Off of Convenience Portfolio
Curbline Properties to Be the First Public REIT Exclusively Focused on the Convenience Sector
Curbline Offers a Unique Scalable Investment Opportunity with a Balance Sheet Intended to Fuel Company for Significant Growth in Fragmented
Yet Liquid Market
$646M of Assets Sold Since June 30, 2023 at a 6.5% Cap Rate and $242M of Additional Assets Under Contract
for Sale Subject to Standard Closing Conditions
SITE Centers Obtained $1.1B Financing Commitment with Proceeds Expected to be Used
to Repay All Outstanding Unsecured Debt
SITE Centers Declares Fourth Quarter Dividend of $0.13 per share and Expects to Declare and
Pay a Special Cash Dividend of at least $0.10 per share Prior to January 31, 2024
Beachwood, Ohio, October 30, 2023
– SITE Centers Corp. (the “Company” or “SITE Centers”) (NYSE: SITC), an owner of open-air shopping centers in suburban, high household income communities, today announced that the
Company’s Board of Directors has unanimously approved a plan to spin-off the Company’s Convenience assets into a separate publicly-traded REIT to be named Curbline Properties Corp. (“Curbline
Properties” or “CURB”).
“We believe that the Convenience real estate sector offers attractive, inflation-protected returns with
limited capital expenditure requirements and are excited to form and scale the first public real estate company focused exclusively on Convenience properties located on the curbline in the wealthiest submarkets in the United States. CURB’s
balance sheet upon separation from SITE Centers is expected to position Curbline Properties for significant asset growth in a period of market disruption, providing a compelling competitive advantage in a fragmented yet liquid marketplace,”
commented David R. Lukes, President and Chief Executive Officer. “For SITE Centers, our work over the past six years has resulted in a carefully curated mix of dominant grocery, lifestyle, net lease and regional power center properties located
in the top submarkets in the United States with compelling near-term net operating income (“NOI”) growth. Following the separation, SITE Centers intends to continue maximizing value via our leasing and tactical redevelopment efforts and
opportunistically realize value through asset sales where appropriate.”
TRANSACTION HIGHLIGHTS
| |
• |
|
Unlocks Unique, Focused Growth Company - The expected spin-off
will separate the Company’s Convenience strategy from SITE Centers, unlocking the first and only public REIT exclusively focused on Convenience assets which generally consist of a row of primarily shop units. The Convenience sector offers
attractive, inflation-protected returns driven by high renewal and retention rates and limited operating capital expenditures. |
| |
• |
|
CURB Balance Sheet Positioned for Growth in Scalable Market - Based on CURB’s expected net cash,
debt-free position upon separation from SITE Centers along with its limited capital needs, CURB is expected to be able to significantly grow its asset base with no additional near-term equity required. There are over 68,000 unanchored assets in the
United States (950 million square feet) according to ICSC, with over $40 billion of assets traded in the period between 2018 and 2022. This highly fragmented, but liquid market, provides a substantial addressable opportunity for CURB.
|
| |
• |
|
SITE Portfolio Concentrated in Top Retail Submarkets - Pro forma for the
spin-off and including all assets owned as of September 30, 2023, SITE Centers remains well positioned based on its curated portfolio of properties located in the top submarkets in the United States with
average household incomes of $109,000 (88th percentile as compared to all shopping centers in the United States) and 69% of the wholly-owned portfolio anchored by a grocer or warehouse club.
|
| |
• |
|
SITE Centers to Continue to Maximize Value - The Company’s Signed Not Opened (SNO) pipeline of
$14.4 million represents 4.5% of third quarter 2023 Pro-Rata Share (PRS) Annualized Base Rent (ABR), providing a tailwind to future NOI |
| |
growth further supported by steady demand for vacant space and limited industry supply. SITE Centers obtained a $1.1B financing commitment with financing and disposition proceeds expected to be
used to retire all unsecured debt outstanding prior to the spin-off and provide maximum flexibility for stakeholders. |
| |
• |
|
Management Expertise and Track Record - SITE’s management team has a strong strategic and transaction
track record with $6.9 billion of assets (at 100%) sold since the first quarter of 2017, the successful spin-off and monetization of all 50 properties in Retail Value Inc., and the unwind of multiple
joint venture portfolios. |
CURBLINE OVERVIEW
Convenience retail properties are positioned on the curbline of well-trafficked intersections, offering excellent access and visibility along with dedicated
parking. The properties generally consist of a ubiquitous row of primarily shop units leased to a diversified mixture of national and local service and restaurant tenants that cater to daily convenience trips from the growing suburban population
including top tenants Starbucks (2.3% of ABR), Darden (2.0%), JPMorgan Chase (1.4%), Verizon (1.3%) and Chipotle (1.2%). The property type’s site plan and depth of leasing prospects reduce operating capital expenditures and provide significant
tenant diversification. The median asset size of the CURB portfolio as of September 30, 2023 is 20,000 square feet with 91% of base rent generated by units less than 10,000 square feet.
Since launching its convenience strategy in 2019, the Company has amassed a portfolio of 61 wholly-owned properties, including assets separated or in the
process of being separated from SITE Centers properties, concentrated in Metropolitan Statistical Areas (MSAs) and submarkets with compelling long-term population and employment growth and above-average household incomes of over $115,000 (91st percentile). Same-property NOI growth for the CURB portfolio is expected to average greater than 3% in the next three years (2024-2026), driven by fixed rental revenue increases and rent
commencements along with negotiated and option renewals. As of September 30, 2023, the CURB portfolio was 96.2% leased with ABR per square foot of $35.32.
In 2022, SITE Centers began the process of separating certain convenience properties that are adjacent to existing assets, with the separation work expected
to be completed prior to the planned spin-off of CURB. The separated properties to be included in CURB share similar characteristics to convenience assets purchased to date and were selected based on projected
cash flow growth, demographics, the credit profile of tenants and other key financial and real estate attributes.
CURB is expected to be in a net cash
position at the time of the spin-off with cash on hand, a preferred investment in SITE Centers, and an unsecured, undrawn line of credit. The Company intends to acquire additional convenience properties prior
to the spin-off, which will be included in the CURB portfolio, funded via additional SITE Centers dispositions, retained cash flow and cash on hand. CURB is expected to be led by David Lukes as President and
Chief Executive Officer. Conor Fennerty is expected to be Chief Financial Officer and Treasurer and John Cattonar is expected to be Chief Investment Officer.
In the third quarter of 2023, SITE Centers acquired three convenience properties for an aggregate price of $28.1 million, including Towne Crossing Shops
(Richmond, Virginia) for $4.2 million, Oaks at Slaughter (Austin, Texas) for $14.1 million and The Marketplace at 249 (Houston, Texas) for $9.8 million. Subsequent to quarter end, the Company acquired two additional convenience
properties for an aggregate price of $26.0 million including Estero Crossing (Fort Meyers, Florida) for $17.1 million and Point at University (Charlotte, North Carolina) for $8.9 million.
SITE CENTERS OVERVIEW
Pro forma for the spin-off and including all assets owned as of September 30, 2023, SITE Centers will include 83 properties, including 13 joint venture properties, concentrated in the country’s largest MSAs including
Chicago (7.6% of pro-rata ABR), Atlanta (7.2%), Boston (7.1%), Orlando (6.9%) and Denver (6.3%) with average household incomes of $109,000 (88th
percentile).
In addition to its positioning in the top submarkets with elevated employment and population growth, over 90% of ABR of the pro forma SITE
Centers portfolio is generated by national tenants with 69% of properties by ABR anchored by a grocer or warehouse club. As of September 30, 2023, ABR per square foot for the portfolio was $17.82 and the leased rate was 94.4% with an SNO
pipeline of $14.4 million which represents 4.5% of ABR.
In October 2023, SITE Centers obtained a commitment from affiliates of Apollo, including
ATLAS SP Partners, to provide a $1.1 billion delayed-draw mortgage facility to be secured by 40 properties across 15 states with flexibility to reduce the commitment or loan balance with proceeds from asset sales or other sources of capital.
The mortgage is expected to be funded prior to the spin-off date with loan and additional asset sale proceeds expected to be used to retire all unsecured debt, including all outstanding public notes, prior to
the spin-off of CURB. SITE Centers is expected to have no unsecured debt outstanding at the time of the
spin-off effective date. In October 2023, SITE Centers also closed on a $100 million mortgage secured by Nassau Park Pavilion. Proceeds were used for
general corporate purposes including the repayment of a portion of the outstanding balance on the Company’s line of credit.
SITE Centers is expected
to provide certain shared services to CURB for up to 24 months following the transaction. Following the separation of CURB, the Company may opportunistically sell additional assets to repay debt, redeem CURB’s preferred investment and return
capital to shareholders.
SITE Centers sold 11 wholly owned shopping centers in the third quarter and fourth quarter to date for an aggregate price of
$645.6 million, with 6 additional assets for an aggregate price of $242.0 million under contract for sale subject to standard closing conditions. The assets sold to date were disposed of at a blended 6.5% cap rate. Disposition proceeds are
expected to be used to repay the outstanding balance on the Company’s line of credit, fund acquisitions, retire near-term maturities and for general corporate purposes. Additional details related to recent transaction activity can be found in
the CURB investor presentation.
SITE CENTERS DECLARES FOURTH QUARTER 2023 DIVIDEND & ANNOUNCES EXPECTED SPECIAL DIVIDEND
SITE Centers today declared a dividend on its common stock of $0.13 per share for the fourth quarter of 2023. The dividend is payable on January 5, 2024
to shareholders of record at the close of business on December 11, 2023. Based on 2023 transaction activity, the Company also expects to declare and pay a special cash dividend of at least $0.10 per share prior to January 31, 2024 subject
to final SITE Centers’ Board of Directors approval. The Company will assess and expects to adjust, if necessary, future quarterly dividends prior to the spin-off of CURB.
SPIN-OFF DETAILS
CURB expects to confidentially submit its initial draft Form 10 registration statement with the U.S. Securities and Exchange Commission in 2024, and the spin-off is expected to be completed in the second half of 2024. CURB intends to elect to be treated as a REIT for U.S. federal income tax purposes and be structured as an UPREIT which is expected to be a
competitive advantage when acquiring assets from private Convenience sellers. Shareholders of SITE Centers will receive shares of CURB via a taxable pro rata stock distribution. The transaction is subject to certain conditions, including the
effectiveness of CURB’s Form 10 registration statement and final approval and declaration of the distribution by SITE Centers’ Board of Directors. The transaction does not require shareholder approval.
An investor presentation regarding the spin-off can be found on the Investor portion of SITE Centers’ website at
http://ir.sitecenters.com.
SPIN-OFF ADVISORS
Morgan Stanley & Co. LLC and Wells Fargo are acting as lead financial advisors and Jones Day is serving as legal counsel to SITE Centers.
CONFERENCE CALL DETAILS
The Company will hold a
conference call to discuss the spin-off and third quarter results today at 5:30pm Eastern Time. All interested parties can access the call by dialing 888-317-6003 (U.S.), 866-284-3684 (Canada), or
412-317-6061 (international) using passcode 5228692. The call will also be webcast and available in a listen-only mode on SITE Centers’ website at
ir.sitecenters.com. SITE Centers no longer intends to host its previously announced earnings conference call on November 2, 2023.
About SITE
Centers Corp.
SITE Centers is an owner and manager of open-air shopping centers located in suburban, high
household income communities. The Company is a self-administered and self-managed REIT operating as a fully integrated real estate company and is publicly traded on the New York Stock Exchange under the ticker symbol SITC. Additional information
about the Company is available at www.sitecenters.com. To be included in the Company’s e-mail distributions for press releases and other investor news, please click here.
Safe Harbor
The Company considers portions of the
information in this press release to be forward-looking statements within the meaning of Section 27A of the Securities Act of 1933 and Section 21E of the Securities Exchange Act of 1934, both as amended, with respect to the Company’s
expectation for future periods. Although the Company believes that the expectations reflected in such forward-looking statements are based upon reasonable assumptions, it can give no assurance that its expectations will be achieved. For
this purpose, any statements contained herein that are not historical fact may be deemed to be forward-looking statements. There are a number of important factors that could cause our results to
differ materially from those indicated by such forward-looking statements, including, among other factors, our ability to complete the spin-off in a timely manner or at all; the expected tax treatment of the spin-off; our ability to satisfy the various closing conditions to the spin-off and the anticipated financing thereof or have such conditions waived; our ability to consummate
additional dispositions, transfers, property separations and acquisitions prior to the completion of the spin-off; our ability to obtain required third-party consents and regulatory approvals to complete the spin-off in a timely manner or at all; the composition of the spin-off portfolio; the post-transaction leadership of CURB; the impact of the
spin-off on our business and that of CURB; and the Company’s and CURB’s ability to execute their respective business strategies following the spin-off,
including the ability of CURB to acquire assets and obtain debt or equity financing on reasonable terms, if at all. Other risks and uncertainties that could cause our results to differ materially from those indicated by such forward-looking
statements include our ability to declare and pay dividends; general economic conditions, including inflation and interest rate volatility; local conditions such as the supply of, and demand for, retail real estate space in our geographic markets;
the impact of e-commerce; dependence on rental income from real property; the loss of, significant downsizing of or bankruptcy of a major tenant and the impact of any such event on rental income from other
tenants and our properties; redevelopment and construction activities may not achieve a desired return on investment; impairment charges; valuation and risks relating to our joint venture investments; the termination of any joint venture
arrangements or arrangements to manage real property; property damage, expenses related thereto and other business and economic consequences (including the potential loss of rental revenues) resulting from extreme weather conditions or natural
disasters in locations where we own properties, and the ability to estimate accurately the amounts thereof; sufficiency and timing of any insurance recovery payments related to damages from extreme weather conditions or natural disasters; any change
in strategy; the impact of pandemics and other public health crises; unauthorized access, use, theft or destruction of financial, operations or third party data maintained in our information systems or by third parties on our behalf; and our ability
to maintain REIT status. For additional factors that could cause the results of the Company to differ materially from those indicated in the forward-looking statements, please refer to the Company’s most recent reports on Forms 10-K and 10-Q. The Company undertakes no obligation to publicly revise these forward-looking statements to reflect events or circumstances that arise after the date hereof.

Exhibit 99.2 SITE CENTERS SPIN-OFF OF CURBLINE PROPERTIES: SITE
CENTERS’ CONVENIENCE PORTFOLIO OCTOBER 2023
SAFE HARBOR STATEMENT The Company considers portions of the information
in this presentation to be forward-looking statements within the meaning of Section 27A of the Securities Act of 1933 and Section 21E of the Securities Exchange Act of 1934, both as amended, with respect to the Company’s expectation for future
periods. Although the Company believes that the expectations reflected in such forward-looking statements are based upon reasonable assumptions, it can give no assurance that its expectations will be achieved. For this purpose, any statements
contained herein that are not historical fact may be deemed to be forward-looking statements. There are a number of important factors that could cause our results to differ materially from those indicated by such forward-looking statements,
including, among other factors, our ability to complete the spin-off in a timely manner or at all; the expected tax treatment of the spin-off; our ability to satisfy the various closing conditions to the spin-off and the anticipated financing
thereof or have such conditions waived; our ability to consummate additional dispositions, transfers, property separations and acquisitions prior to the completion of the spin-off; our ability to obtain required third-party consents and regulatory
approvals to complete the spin-off in a timely manner or at all; the composition of the spin-off portfolio; the post-transaction leadership of CURB; the impact of the spin-off on our business and that of CURB; and the Company’s and
CURB’s ability to execute their respective business strategies following the spin-off, including the ability of CURB to acquire assets and obtain debt or equity financing on reasonable terms, if at all. Other risks and uncertainties that could
cause our results to differ materially from those indicated by such forward-looking statements include our ability to declare and pay dividends; general economic conditions, including inflation and interest rate volatility; local conditions such as
the supply of, and demand for, retail real estate space in our geographic markets; the impact of e-commerce; dependence on rental income from real property; the loss of, significant downsizing of or bankruptcy of a major tenant and the impact of any
such event on rental income from other tenants and our properties; redevelopment and construction activities may not achieve a desired return on investment; impairment charges; valuation and risks relating to our joint venture investments; the
termination of any joint venture arrangements or arrangements to manage real property; property damage, expenses related thereto and other business and economic consequences (including the potential loss of rental revenues) resulting from extreme
weather conditions or natural disasters in locations where we own properties, and the ability to estimate accurately the amounts thereof; sufficiency and timing of any insurance recovery payments related to damages from extreme weather conditions or
natural disasters; any change in strategy; the impact of pandemics and other public health crises; unauthorized access, use, theft or destruction of financial, operations or third party data maintained in our information systems or by third parties
on our behalf; and our ability to maintain REIT status. For additional factors that could cause the results of the Company to differ materially from those indicated in the forward-looking statements, please refer to the Company’s most recent
reports on Forms 10-K and 10-Q. The Company undertakes no obligation to publicly revise these forward-looking statements to reflect events or circumstances that arise after the date hereof. In addition, this presentation includes certain non-GAAP
financial measures. Non-GAAP financial measures should not be considered replacements for, and should be read together with, the most comparable GAAP measures included in the Company’s disclosures. Descriptions and reconciliations of certain
of these non-GAAP financial measures to the most directly comparable GAAP measures can be found in the appendix to this presentation. 2

TRANSACTION OVERVIEW Unlocking a Unique Scalable Investment Opportunity
Focused Growth Vehicle Intended Maximize and Realize NAV Through to Scale Fragmented Property Type Operations and Asset Sales • Spin-off unlocks the first and only public REIT exclusively focused • SITE Centers intends to maximize value
via leasing and tactical on Convenience assets which offer attractive, inflation-protected redevelopment efforts and opportunistically realize value where returns driven by high renewal and retention rates and limited SHARED appropriate operating
capital expenditures (CapEx < 10% of NOI) SERVICES • Curated portfolio of dominant assets concentrated in the top • Strong embedded internal growth driven by lease structure AGREEMENT submarkets in the U.S. with almost 70% of assets
anchored (fixed annual bumps) and SNO pipeline with 3-year SSNOI growth by a Grocer or Warehouse Club and household incomes in the th expected to average >3.0% 88 percentile nationally • Tenant roster is majority national (75% national)
with significant • Leasing momentum, redevelopment pipeline and $14.4m SNO tenant diversification (1 tenant with >2% of ABR exposure) pipeline (4.5% of ABR) expected to drive NOI and cash flow growth • Diversified portfolio
concentrated in sub-markets with barriers • $646m of assets sold in 2H2023 to date at a blended 6.5% cap rate st to entry and above-average household incomes (91 percentile) with an additional $242m of additional assets under contract for sale
subject to standard closing conditions • Net cash position with no initial debt expected at the time of the spin provides substantial investment capacity ($1-2b+) to fund • Balance sheet positioned for flexibility with $1.1b mortgage
investments in a fragmented, yet liquid market commitment expected to retire all outstanding debt prior to the spin • Strong management track record of value realization with $6.9b of assets (at 100%) sold since 2017, the successful
monetization of Retail Value Inc. and the unwind of multiple JV portfolios Note: All figures as of September 30, 2023. 3
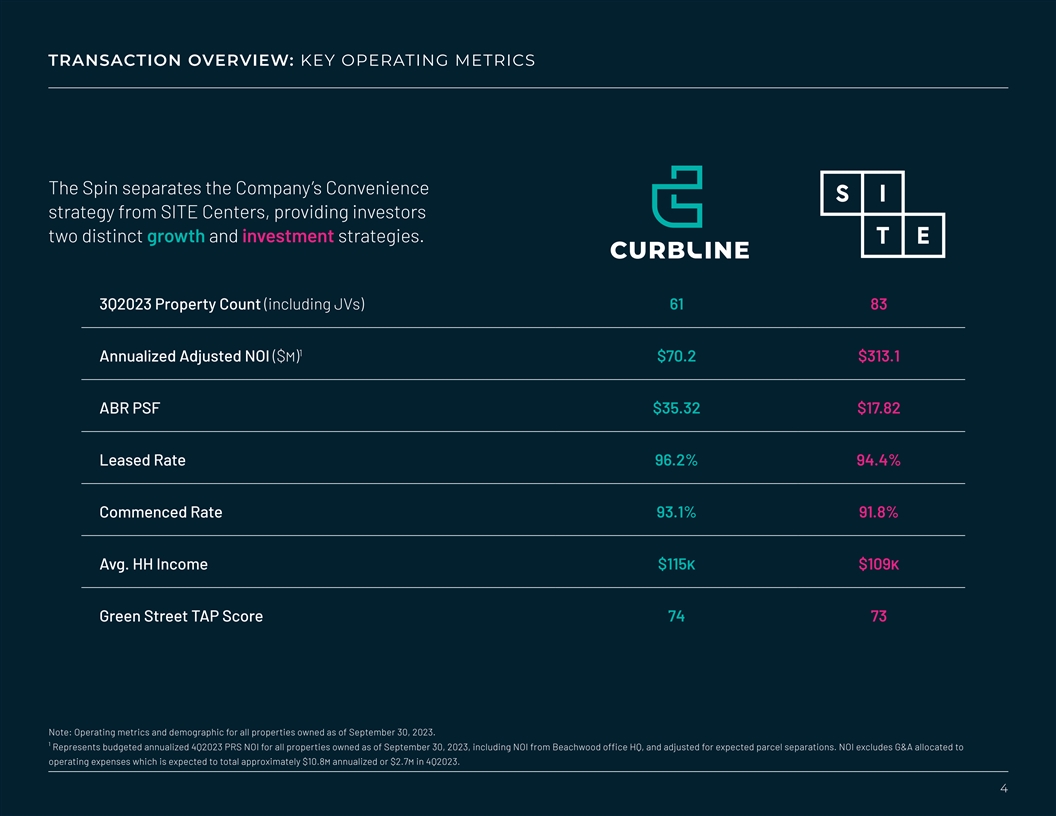
TRANSACTION OVERVIEW: KEY OPERATING METRICS The Spin separates the
Company’s Convenience strategy from SITE Centers, providing investors two distinct growth and investment strategies. 3Q2023 Property Count (including JVs) 61 83 1 Annualized Adjusted NOI ($m) $70.2 $313.1 ABR PSF $35.32 $17.82 Leased Rate
96.2% 94.4% Commenced Rate 93.1% 91.8% Avg. HH Income $115k $109k Green Street TAP Score 74 73 Note: Operating metrics and demographic for all properties owned as of September 30, 2023. ¹ Represents budgeted annualized 4Q2023 PRS NOI for all
properties owned as of September 30, 2023, including NOI from Beachwood office HQ, and adjusted for expected parcel separations. NOI excludes G&A allocated to operating expenses which is expected to total approximately $10.8m annualized or $2.7m
in 4Q2023. 4
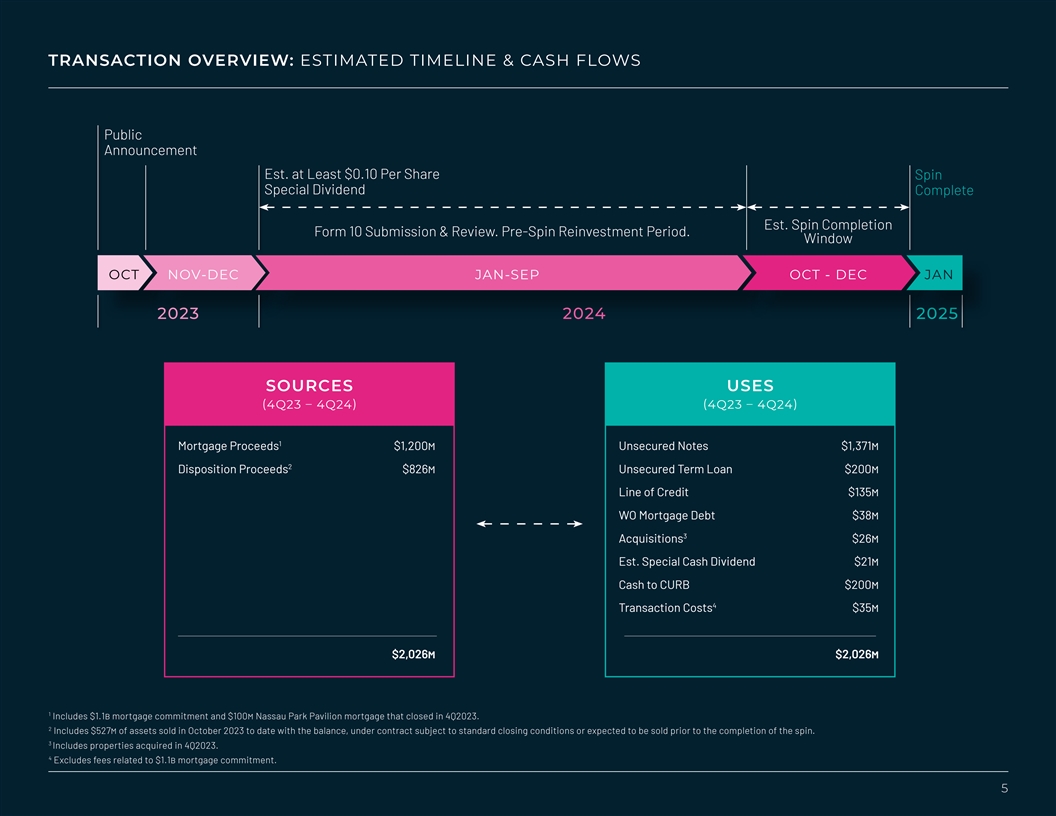
TRANSACTION OVERVIEW: ESTIMATED TIMELINE & CASH FLOWS Public
Announcement Est. at Least $0.10 Per Share Spin Special Dividend Complete Est. Spin Completion Form 10 Submission & Review. Pre-Spin Reinvestment Period. Window OCT NOV-DEC JAN-SEP OCT - DEC JAN 2023 2024 2025 SOURCES USES (4Q23 – 4Q24)
(4Q23 – 4Q24) 1 Mortgage Proceeds $1,200m Unsecured Notes $1,371m 2 Disposition Proceeds $826m Unsecured Term Loan $200m Line of Credit $135m WO Mortgage Debt $38m 3 Acquisitions $26m Est. Special Cash Dividend $21m Cash to CURB $200m 4
Transaction Costs $35m $2,026m $2,026m 1 Includes $1.1b mortgage commitment and $100m Nassau Park Pavilion mortgage that closed in 4Q2023. 2 Includes $527m of assets sold in October 2023 to date with the balance, under contract subject to standard
closing conditions or expected to be sold prior to the completion of the spin. 3 Includes properties acquired in 4Q2023. 4 Excludes fees related to $1.1b mortgage commitment. 5

TRANSACTION OVERVIEW: PRO FORMA BALANCE SHEETS Pro forma for the Spin,
SITE Centers is expected to have no unsecured debt outstanding and CURB is expected to be in a net cash position with no debt • Debt paydown expected to be funded by dispositions and $1.2b of mortgage proceeds • $1.1 b
cross-collateralized mortgage commitment secured by 40-properties obtained from affiliates of Apollo Global Management, including Atlas SP Partners 1 • 1-year commitment with 3-year term upon funding; loan expected to close in October 2024
subject to standard closing conditions • Commitment and expected funded loan balance can be reduced upon sale of assets • Newly issued $300m preferred investment in SITE Centers to CURB 3Q2023 PRO FORMA SITE Centers SITE Centers Curbline
SITC Preferred Investment - - $300m Cash & Restricted Cash $63m $63m $200m Total Cash & Investments $63m $63m $500m Unsecured Public Debt $1,371m - - WO Mortgage Debt $38m $1,200m - Unsecured Term Loan $200m - - Line of Credit $135m - -
Total Consolidated Debt $1,744m $1,200m - Unconsolidated Debt (PRS) $112m $112m - Total Debt (PRS) $1,856m $1,312m - SITC Preferred Stock & Investment $175m $475m - Total Debt + Preferred (PRS) $2,031m $1,787m - Net Debt / (Cash) + Preferred
(PRS) $1,968m $1,724m ($500m) 1 Full term subject to extension conditions at the end of year 2 including but not limited to certain debt yield tests. Note: Pro forma balance sheet estimates based on Sources & Uses as detailed on Page 5.
6

CURBLINE PROPERTIES (CURB) 7
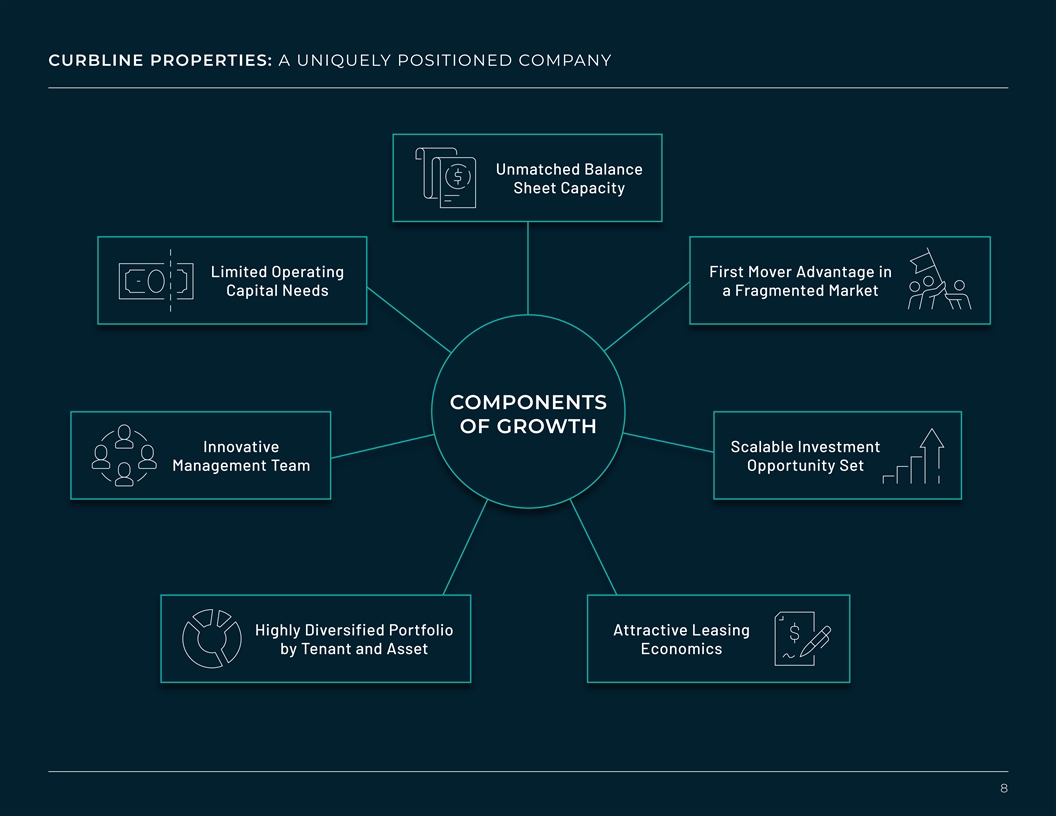
CURBLINE PROPERTIES: A UNIQUELY POSITIONED COMPANY Unmatched Balance
Sheet Capacity Limited Operating First Mover Advantage in Capital Needs a Fragmented Market COMPONENTS OF GROWTH Innovative Scalable Investment Management Team Opportunity Set Highly Diversified Portfolio Attractive Leasing by Tenant and Asset
Economics 8
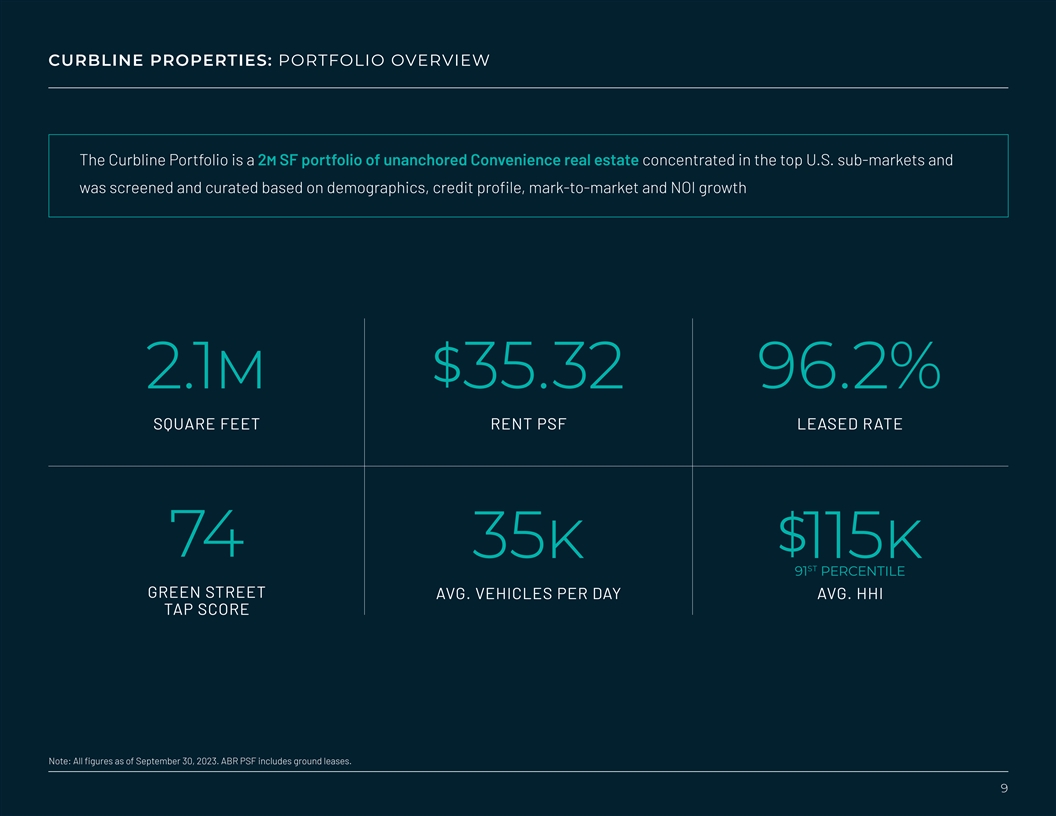
CURBLINE PROPERTIES: PORTFOLIO OVERVIEW The Curbline Portfolio is a 2m
SF portfolio of unanchored Convenience real estate concentrated in the top U.S. sub-markets and was screened and curated based on demographics, credit profile, mark-to-market and NOI growth $ 2.1m 35.32 96.2% SQUARE FEET RENT PSF LEASED RATE $ 74
35k 115k ST 91 PERCENTILE GREEN STREET AVG. VEHICLES PER DAY AVG. HHI TAP SCORE Note: All figures as of September 30, 2023. ABR PSF includes ground leases. 9
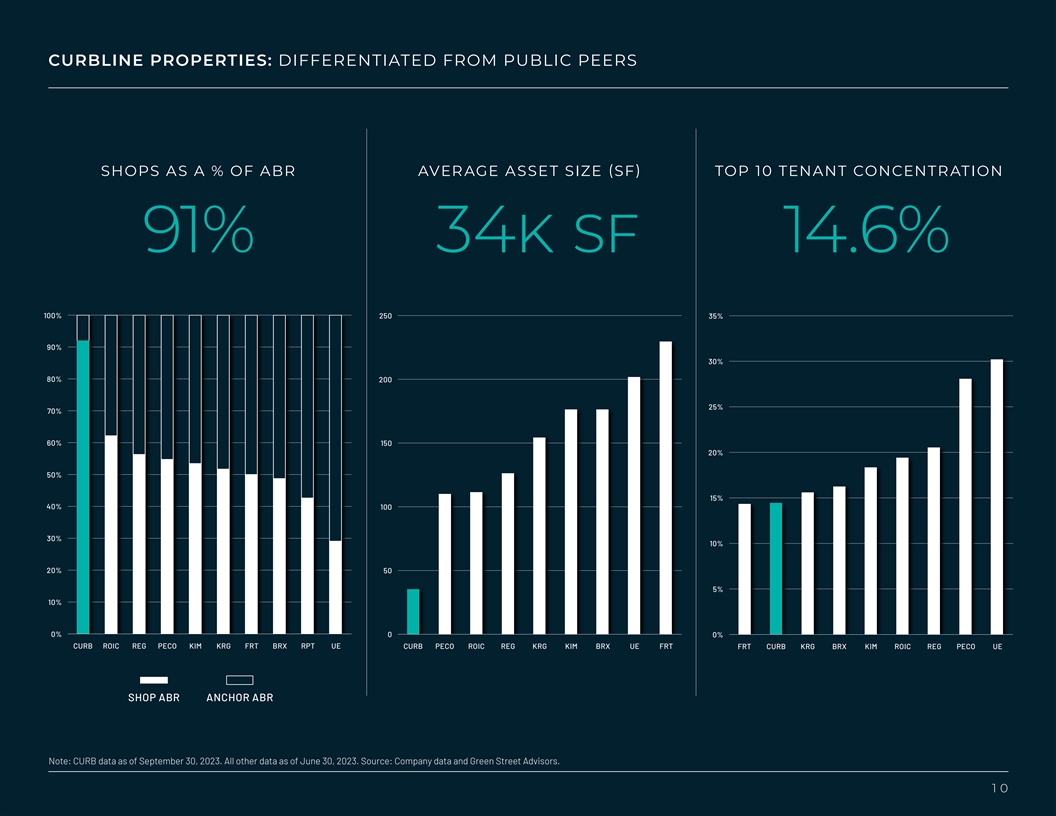
CURBLINE PROPERTIES: DIFFERENTIATED FROM PUBLIC PEERS SHOPS AS A % OF
ABR AVERAGE ASSET SIZE (SF) TOP 10 TENANT CONCENTRATION 91% 34k sf 14.6% 100% 250 35% 90% 30% 80% 200 25% 70% 60% 150 20% 50% 15% 40% 100 30% 10% 20% 50 5% 10% 0% 0 0% CURB ROIC REG PECO KIM KRG FRT BRX RPT UE CURB PECO ROIC REG KRG KIM BRX UE FRT
FRT CURB KRG BRX KIM ROIC REG PECO UE SHOP ABR ANCHOR ABR Note: CURB data as of September 30, 2023. All other data as of June 30, 2023. Source: Company data and Green Street Advisors. 10
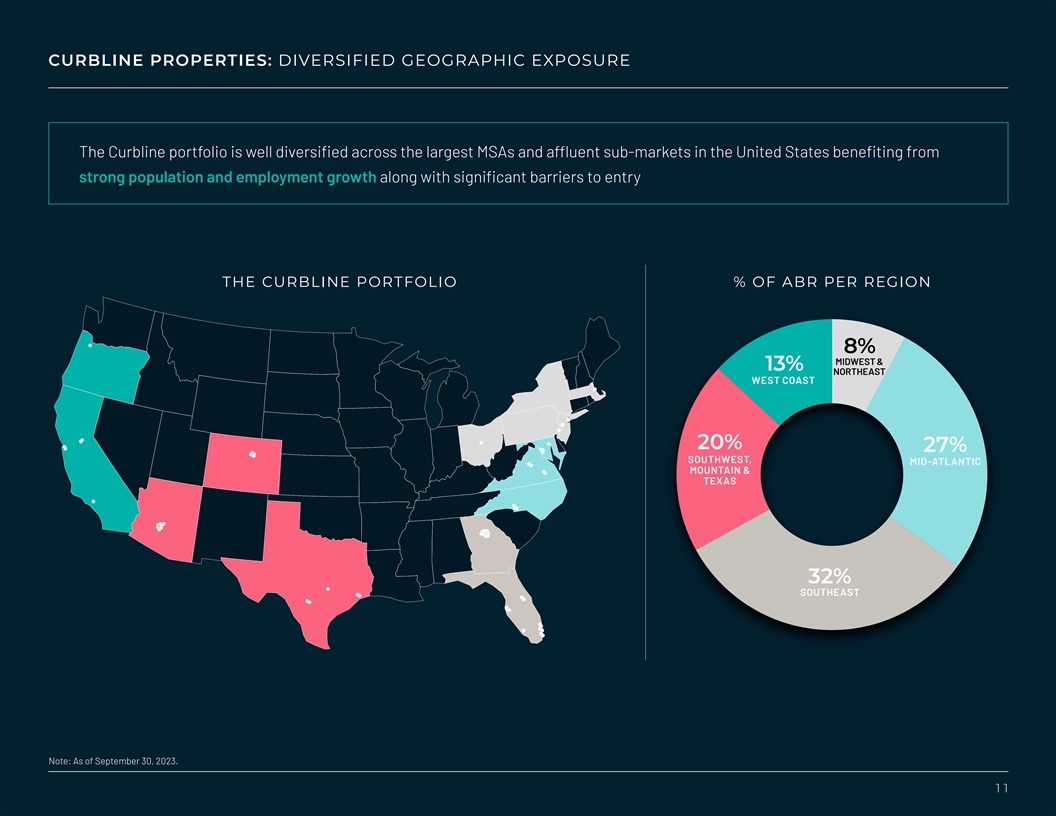
CURBLINE PROPERTIES: DIVERSIFIED GEOGRAPHIC EXPOSURE The Curbline
portfolio is well diversified across the largest MSAs and affluent sub-markets in the United States benefiting from strong population and employment growth along with significant barriers to entry THE CURBLINE PORTFOLIO % OF ABR PER REGION 8%
MIDWEST & 13% NORTHEAST WEST COAST 20% 27% SOUTHWEST, MID-ATLANTIC MOUNTAIN & TEXAS 32% SOUTHEAST Note: As of September 30, 2023. 11
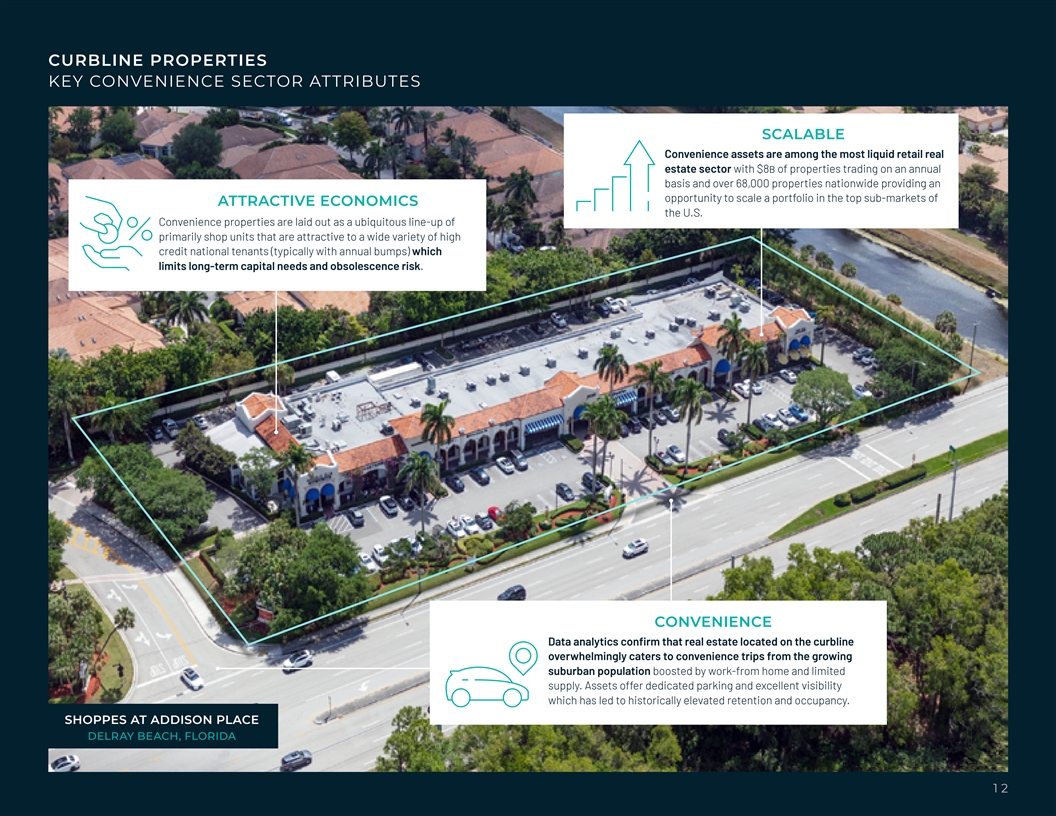
CURBLINE PROPERTIES KEY CONVENIENCE SECTOR ATTRIBUTES SCALABLE
Convenience assets are among the most liquid retail real estate sector with $8b of properties trading on an annual basis and over 68,000 properties nationwide providing an opportunity to scale a portfolio in the top sub-markets of ATTRACTIVE
ECONOMICS the U.S. Convenience properties are laid out as a ubiquitous line-up of primarily shop units that are attractive to a wide variety of high credit national tenants (typically with annual bumps) which limits long-term capital needs and
obsolescence risk. CONVENIENCE Data analytics confirm that real estate located on the curbline overwhelmingly caters to convenience trips from the growing suburban population boosted by work-from home and limited supply. Assets offer dedicated
parking and excellent visibility which has led to historically elevated retention and occupancy. SHOPPES AT ADDISON PLACE DELRAY BEACH, FLORIDA 1 2
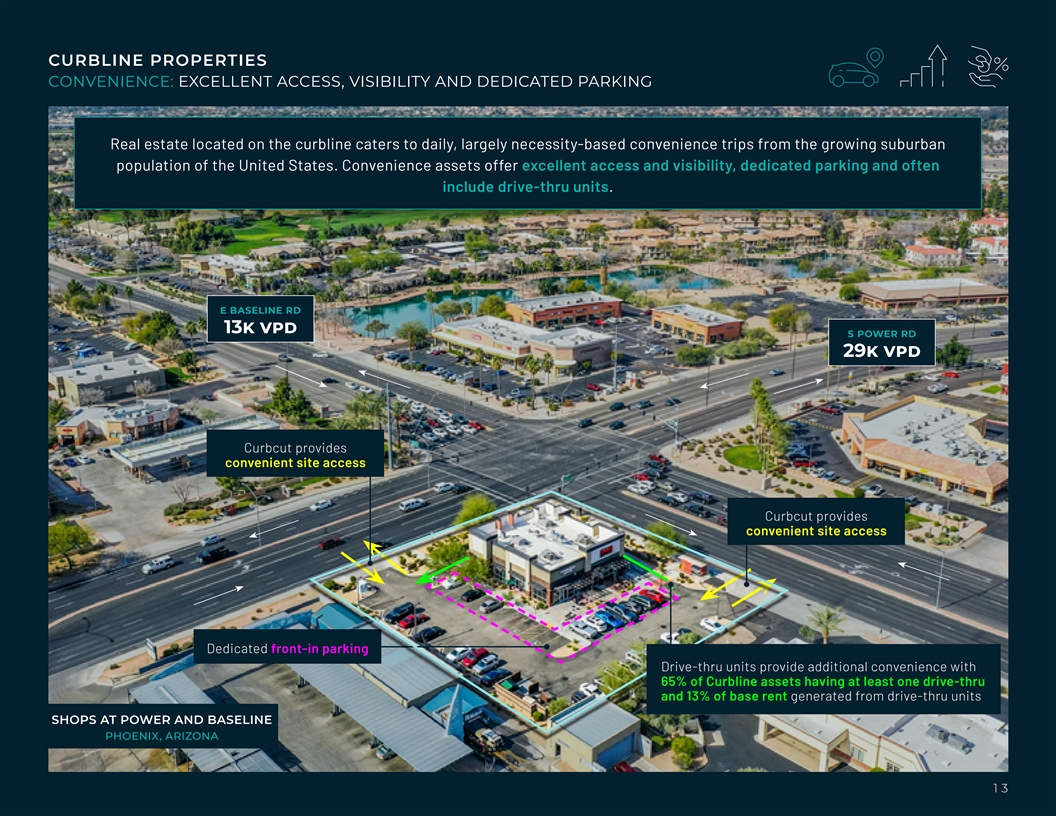
CURBLINE PROPERTIES CONVENIENCE: EXCELLENT ACCESS, VISIBILITY AND
DEDICATED PARKING Real estate located on the curbline caters to daily, largely necessity-based convenience trips from the growing suburban population of the United States. Convenience assets offer excellent access and visibility, dedicated parking
and often include drive-thru units. E BASELINE RD 13k vpd S POWER RD 29k vpd Curbcut provides convenient site access Curbcut provides convenient site access Dedicated front-in parking Drive-thru units provide additional convenience with 65% of
Curbline assets having at least one drive-thru and 13% of base rent generated from drive-thru units SHOPS AT POWER AND BASELINE PHOENIX, ARIZONA 13

CURBLINE PROPERTIES CONVENIENCE: DATA CASE STUDY - SHOPPES OF CRABAPPLE
ALPHARETTA, GEORGIA DEMOGRAPHICS $ 175k 152k DRIVE-THRU AVG. HHI POPULATION ACTUAL TRADE AREA CRABAPPLE RD 17k vpd 3 MILE ARNOLD MILL RD 22k vpd PRIMARY SECONDARY 53% 5% 5% 7% Note: Avg. HHI weighted based on Actual Trade Area data. 1 4
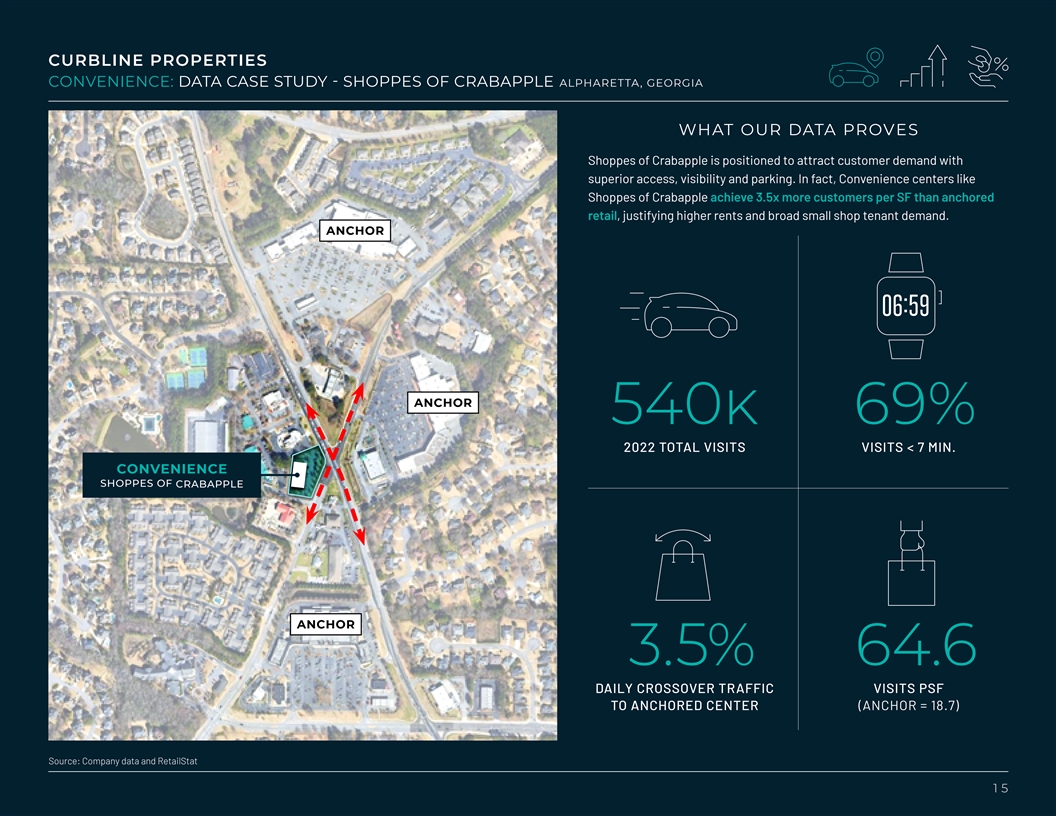
CURBLINE PROPERTIES CONVENIENCE: DATA CASE STUDY - SHOPPES OF CRABAPPLE
ALPHARETTA, GEORGIA WHAT OUR DATA PROVES Shoppes of Crabapple is positioned to attract customer demand with superior access, visibility and parking. In fact, Convenience centers like Shoppes of Crabapple achieve 3.5x more customers per SF than
anchored retail, justifying higher rents and broad small shop tenant demand. ANCHOR ANCHOR 540k 69% 2022 TOTAL VISITS VISITS < 7 MIN. CONVENIENCE SHOPPES OF CRABAPPLE ANCHOR 3.5% 64.6 DAILY CROSSOVER TRAFFIC VISITS PSF TO ANCHORED CENTER (ANCHOR
= 18.7) Source: Company data and RetailStat 15

CURBLINE PROPERTIES CONVENIENCE: SIGNIFICANT DEPTH AND BREADTH OF
DEMAND FOR SPACE Curbline’s access, visibility and standardized unit size attracts a diverse group of primarily national, credit tenants with significant volume with public QSR operators, banks, medical and other service users NEW LEASES BY
ABR SELECT NEW AND RENEWAL ACTIVITY 25% ® LOCAL 75% NATIONAL NEW LEASE TYPE BY ABR 28% RESTAURANTS 28% NATIONAL OTHER 13% 6% RESTAURANTS MED. OFFICE LOCAL 7% FITNESS 9% 9% HOME FURNISHINGS BEER & WINE STORES Note: Leasing data from 1Q20
– 2Q23. 16
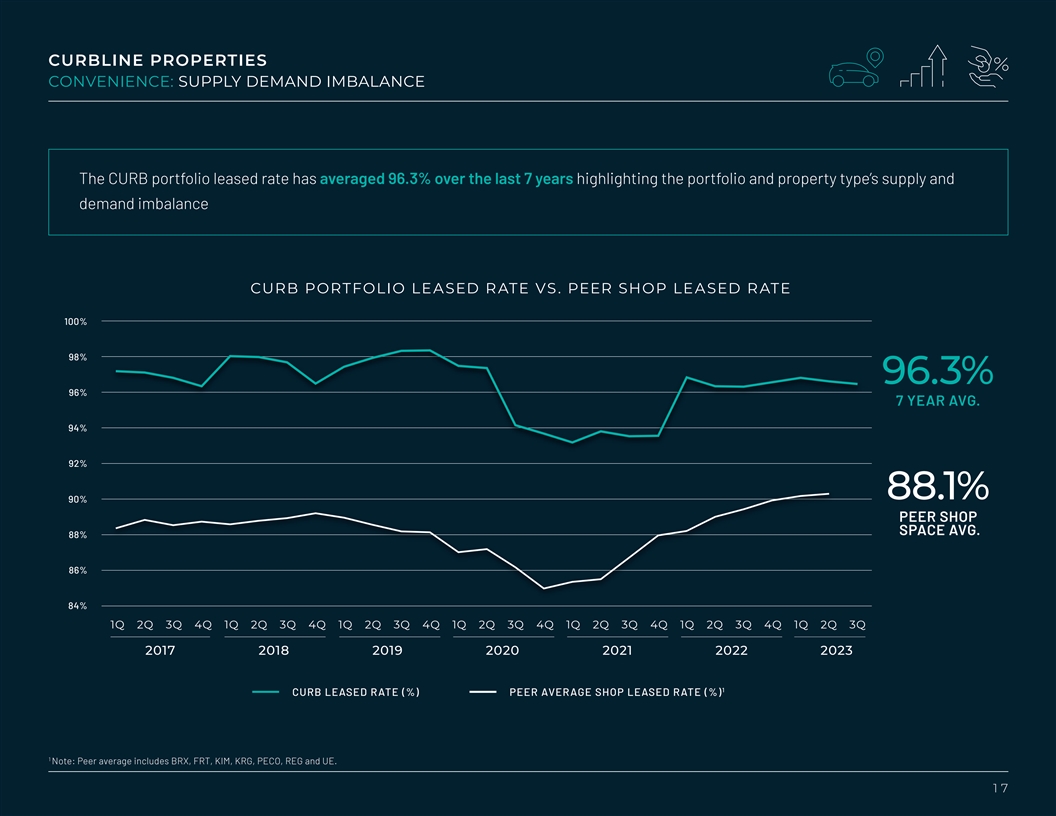
CURBLINE PROPERTIES CONVENIENCE: SUPPLY DEMAND IMBALANCE The CURB
portfolio leased rate has averaged 96.3% over the last 7 years highlighting the portfolio and property type’s supply and demand imbalance CURB PORTFOLIO LEASED RATE VS. PEER SHOP LEASED RATE 100% 98% 96.3% 96% 7 YEAR AVG. 94% 92% 88.1% 90%
PEER SHOP SPACE AVG. 88% 86% 84% 1Q 2Q 3Q 4Q 1Q 2Q 3Q 4Q 1Q 2Q 3Q 4Q 1Q 2Q 3Q 4Q 1Q 2Q 3Q 4Q 1Q 2Q 3Q 4Q 1Q 2Q 3Q 2017 2018 2019 2020 2021 2022 2023 1 CURB LEASED RATE (%) PEER AVERAGE SHOP LEASED RATE (%) 1 Note: Peer average includes BRX, FRT,
KIM, KRG, PECO, REG and UE. 17

CURBLINE PROPERTIES CONVENIENCE: TRAFFIC, ACCESS & DEMAND DRIVE
COMPELLING LEASE ECONOMICS CURB portfolio has generated compelling leasing economics in excess of the open-air retail industry driven by Convenience property type tailwinds and the strength of Curbline’s sub-markets. Key metrics include:
• Average new leasing spreads of +30% • Average renewal spreads of +7% • Net effective rents equal to 82% of base rent highlighting the limited capital required to drive growth CASH NEW LEASING SPREADS CASH RENEWAL LEASING SPREADS
100% 15% 80% +7% 10% 4 YEAR AVG. 60% 5% +30% 40% 4 YEAR AVG. 0% 20% -5% 0% -10% -20% 1Q20 2Q20 3Q20 4Q20 1Q21 2Q21 3Q21 4Q21 1Q22 2Q22 3Q22 4Q22 1Q23 2Q23 3Q23 1Q20 2Q20 3Q20 4Q20 1Q21 2Q21 3Q21 4Q21 1Q22 2Q22 3Q22 4Q22 1Q23 2Q23 3Q23 Note: New
leasing spreads not comparable to SITE Centers reporting metrics as new leases include all leases including those vacant > 12 months. 18
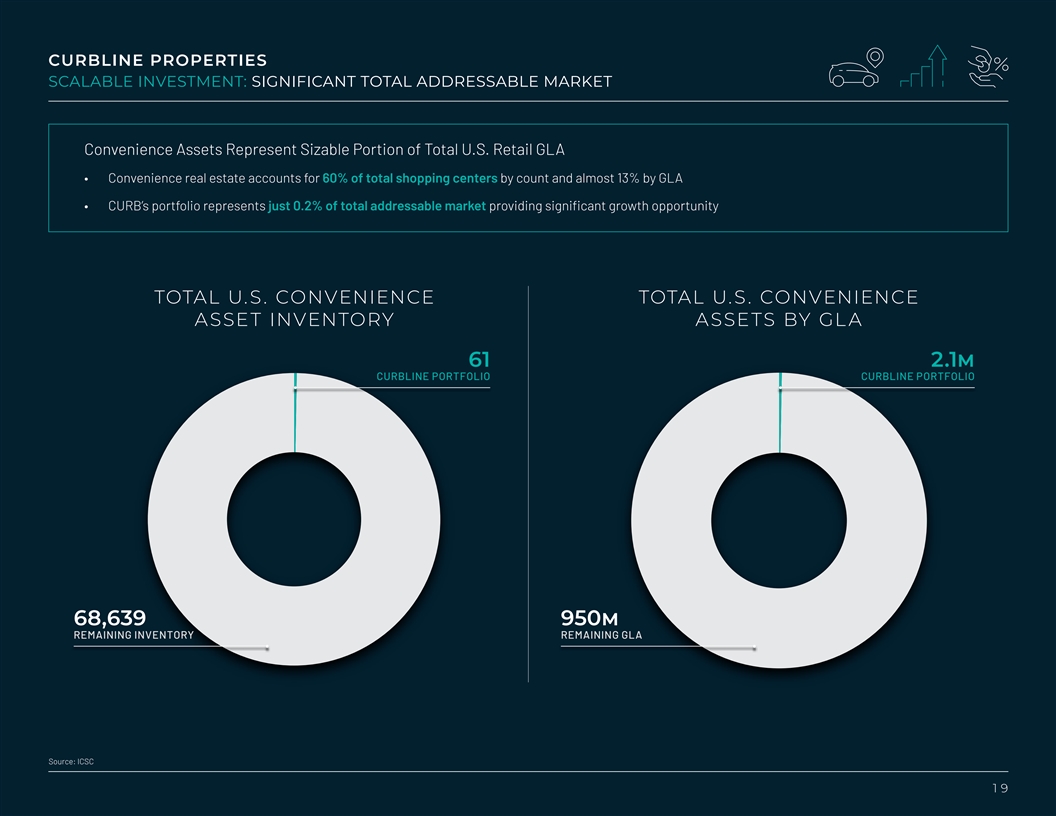
CURBLINE PROPERTIES SCALABLE INVESTMENT: SIGNIFICANT TOTAL ADDRESSABLE
MARKET Convenience Assets Represent Sizable Portion of Total U.S. Retail GLA • Convenience real estate accounts for 60% of total shopping centers by count and almost 13% by GLA • CURB’s portfolio represents just 0.2% of total
addressable market providing significant growth opportunity TOTAL U.S. CONVENIENCE TOTAL U.S. CONVENIENCE ASSET INVENTORY ASSETS BY GLA 61 2.1m CURBLINE PORTFOLIO CURBLINE PORTFOLIO 68,639 950m REMAINING INVENTORY REMAINING GLA Source: ICSC
19
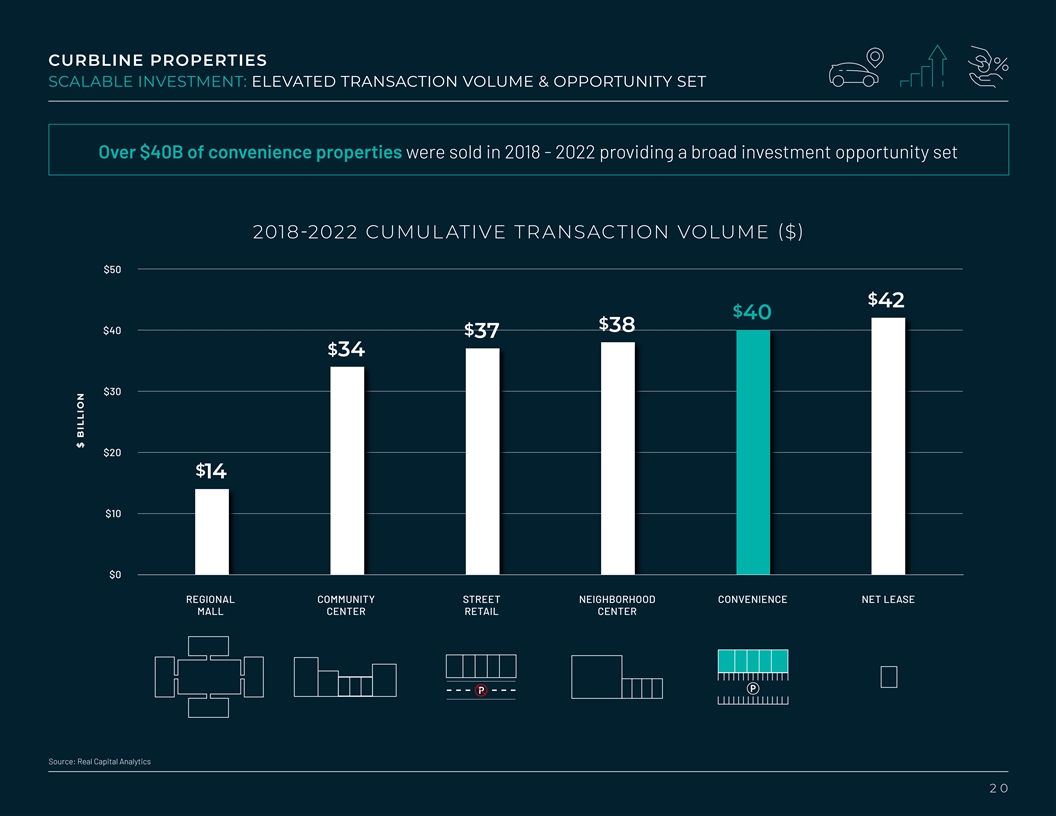
CURBLINE PROPERTIES SCALABLE INVESTMENT: ELEVATED TRANSACTION VOLUME
& OPPORTUNITY SET Over $40B of convenience properties were sold in 2018 - 2022 providing a broad investment opportunity set 2018-2022 CUMUL ATIVE TRANSACTION VOLUME ($) $50 $ 42 $ 40 $ 38 $40 $ 37 $ 34 $30 $20 $ 14 $10 $0 REGIONAL COMMUNITY
STREET NEIGHBORHOOD CONVENIENCE NET LEASE MALL CENTER RETAIL CENTER P P Source: Real Capital Analytics 20 $ BILLION
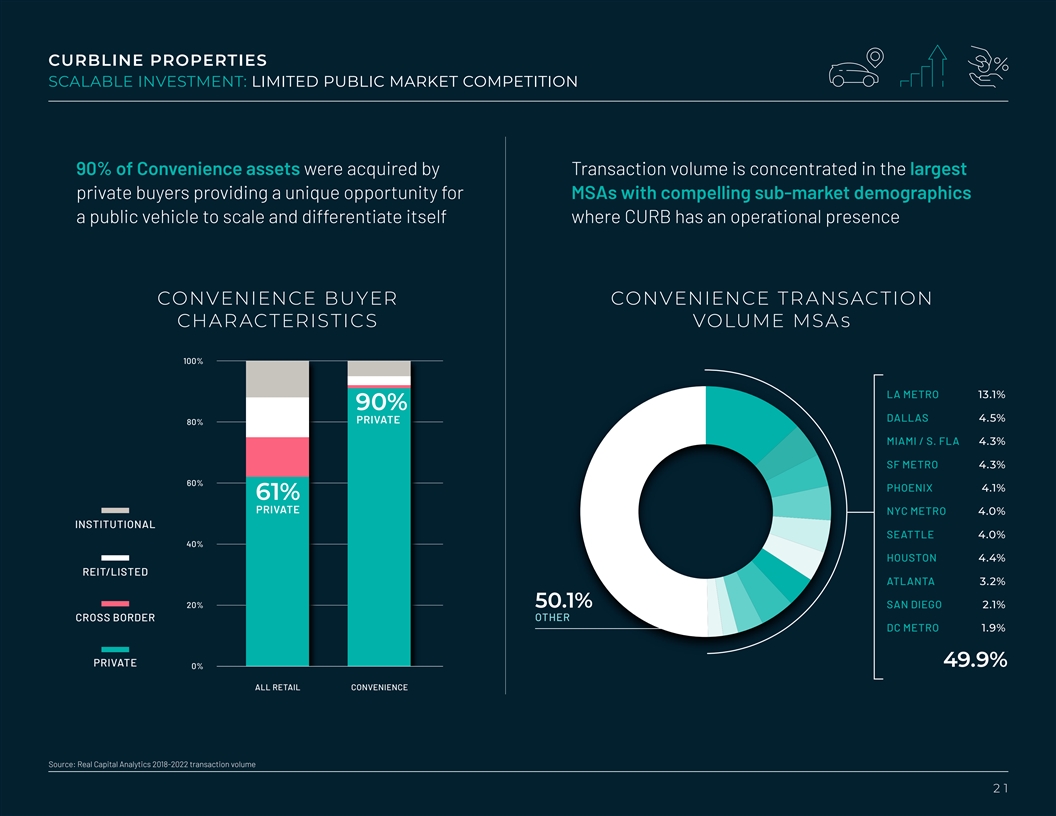
CURBLINE PROPERTIES SCALABLE INVESTMENT: LIMITED PUBLIC MARKET
COMPETITION 90% of Convenience assets were acquired by Transaction volume is concentrated in the largest private buyers providing a unique opportunity for MSAs with compelling sub-market demographics a public vehicle to scale and differentiate
itself where CURB has an operational presence CONVENIENCE BUYER CONVENIENCE TRANSACTION CHARACTERISTICS VOLUME MSA s 100% LA METRO 13.1% 90% DALLAS 4.5% PRIVATE 80% MIAMI / S. FLA 4.3% SF METRO 4.3% 60% PHOENIX 4.1% 61% PRIVATE NYC METRO 4.0%
INSTITUTIONAL SEATTLE 4.0% 40% HOUSTON 4.4% REIT/LISTED ATLANTA 3.2% 20% 50.1% SAN DIEGO 2.1% CROSS BORDER OTHER DC METRO 1.9% PRIVATE 49.9% 0% ALL RETAIL CONVENIENCE Source: Real Capital Analytics 2018-2022 transaction volume 21
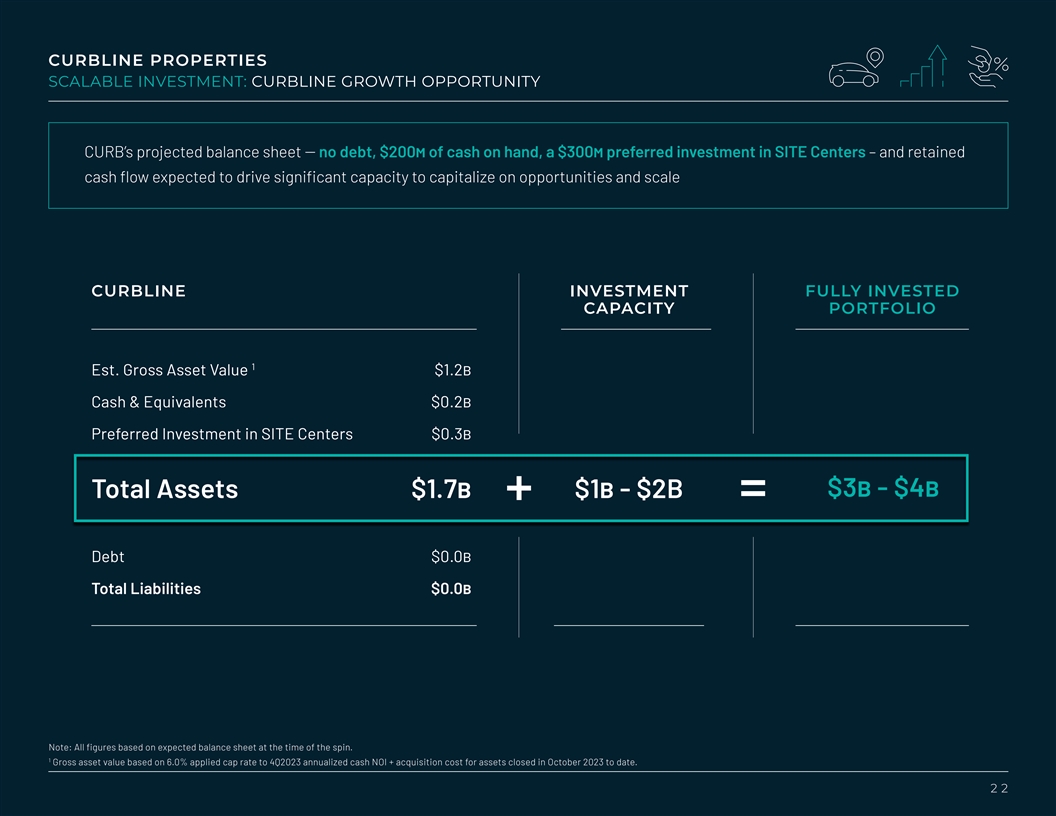
CURBLINE PROPERTIES SCALABLE INVESTMENT: CURBLINE GROWTH OPPORTUNITY
CURB’s projected balance sheet -- no debt, $200m of cash on hand, a $300m preferred investment in SITE Centers – and retained cash flow expected to drive significant capacity to capitalize on opportunities and scale CURBLINE INVESTMENT
FULLY INVESTED CAPACITY PORTFOLIO 1 Est. Gross Asset Value $1.2b Cash & Equivalents $0.2b Preferred Investment in SITE Centers $0.3b $3b - $4b Total Assets $1.7b $1b - $2B Debt $0.0b Total Liabilities $0.0b Note: All figures based on expected
balance sheet at the time of the spin. 1 Gross asset value based on 6.0% applied cap rate to 4Q2023 annualized cash NOI + acquisition cost for assets closed in October 2023 to date. 22

CURBLINE PROPERTIES ATTRACTIVE ECONOMICS: RENEWALS FOCUS REDUCES
DOWNTIME WHILE CAPTURING MTM The unanchored business has attractive economic returns driven by the sector’s standard lease structures, high retention rates and limited CapEx requirements • Lease structures drive above-average occupancy
neutral NOI growth (64% of tenants in the 36 acquired or separately owned properties have annual bumps of at least 2% with blended annual bumps of 2.8%) • Liquid units provide an opportunity to push rents upon maturity and capture rent growth
(27% of leases expire without an option in next 5 years) • Significant tenant diversification with the majority of exposure to national tenants (36% of ABR from public tenants) CURBLINE LEASE MATURITY SCHEDULE TENANT CREDIT PROFILE (% OF ABR)
(% OF ABR) 30% 27% 27% LOCAL 25% 20% 15% 10% 8% 5% 73% 5% 5% 4% 5% NATIONAL 0% 4Q23/2024 2025 2026 2027 2028 5-YEAR TOTAL Note: As of September 30, 2023 23
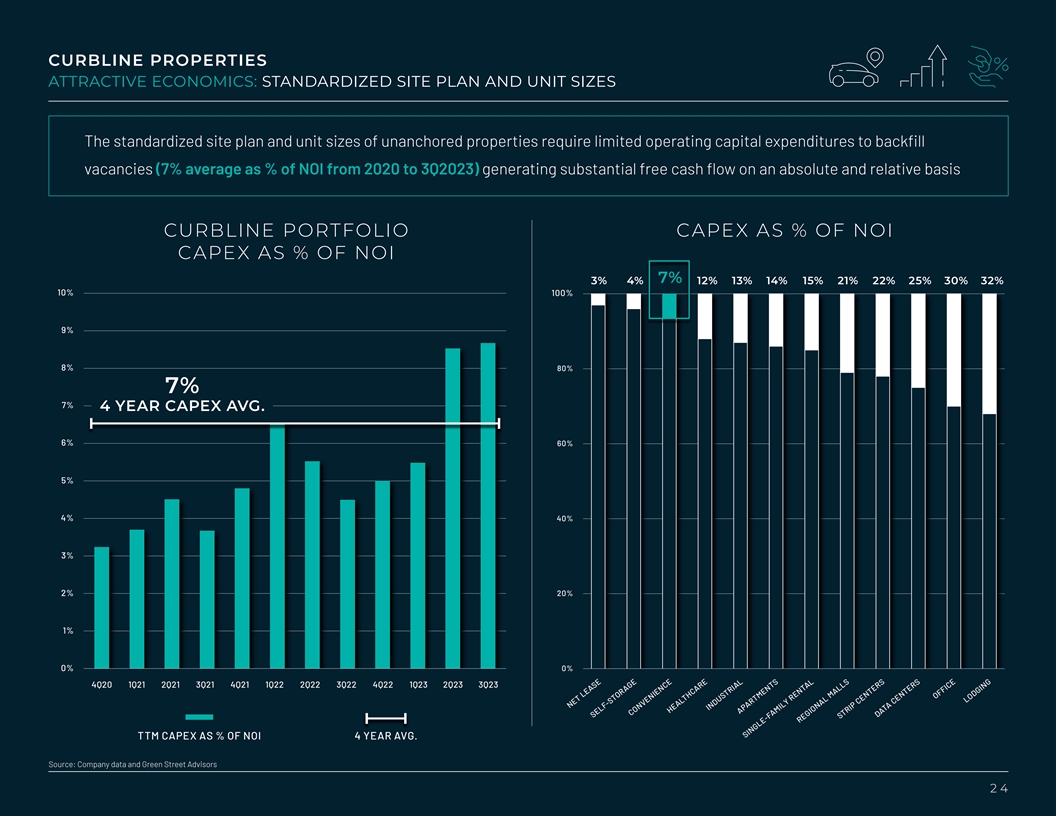
CURBLINE PROPERTIES ATTRACTIVE ECONOMICS: STANDARDIZED SITE PLAN AND
UNIT SIZES The standardized site plan and unit sizes of unanchored properties require limited operating capital expenditures to backfill vacancies (7% average as % of NOI from 2020 to 3Q2023) generating substantial free cash flow on an absolute and
relative basis CURBLINE PORTFOLIO CAPEX AS % OF NOI CAPEX AS % OF NOI 7% 3% 4% 12% 13% 14% 15% 21% 22% 25% 30% 32% 10% 100% 9% 8% 80% 7% 7% 4 YEAR CAPEX AVG. 6% 60% 5% 4% 40% 3% 2% 20% 1% 0% 0% 4Q20 1Q21 2Q21 3Q21 4Q21 1Q22 2Q22 3Q22 4Q22 1Q23 2Q23
3Q23 TTM CAPEX AS % OF NOI 4 YEAR AVG. Source: Company data and Green Street Advisors 24 NET LEASE SELF-STORAGE CONVENIENCE HEALTHCARE INDUSTRIAL APARTMENTS SINGLE-FAMILY RENTAL REGIONAL MALLS STRIP CENTERS DATA CENTERS OFFICE LODGING

CURBLINE PROPERTIES ATTRACTIVE ECONOMICS: DIVERSIFIED NATIONAL TENANT
EXPOSURE REDUCES TURNOVER RANK TENANT % OF GLA % OF ABR The CURB portfolio is populated by a well-diversified 1 STARBUCKS 1.5% 2.3% roster of tenants concentrated in national, credit 2 DARDEN 2.2% 2.0% 3 JPMORGAN CHASE 1.0% 1.4% tenants with the
lowest concentration of Top 20 4 VERIZON 0.9% 1.3% tenants of any of the public open-air REITs which 5 CHIPOTLE 0.9% 1.2% lowers credit risk and increases retention rates. 6 CRACKER BARREL 1.6% 1.2% 7 WELLS FARGO 0.8% 1.2% • 75% of tenants (as
% of ABR) are national with 36% of 8 BRINKER 1.4% 1.2% base rent from public company tenants 9 FEDEX OFFICE 1.0% 1.1% 1 • Only one tenant (Starbucks Baa1/BBB+) represents 10 INSPIRE BRANDS 0.9% 1.1% greater than 2% of ABR 11 AT&T 0.8% 1.1%
12 AMWINS INSURANCE 0.5% 1.1% • Credit risk is further mitigated by the ubiquitous unit 2 13 JAB HOLDING COMPANY 1.0% 1.0% sizes and a significant number of potential backfill tenants 14 MATTRESS FIRM 0.8% 0.9% 15 FIVE GUYS 0.6% 0.9% •
Sh op tenants (<10,000 sf) account for 91% of CURB’s 3 16 RESTAURANT BRANDS INTERNATIONAL 1.4% 0.9% tenant base 17 CVS 0.9% 0.9% 18 CHICK-FIL-A 1.0% 0.8% 19 McDONALD’S 0.8% 0.8% 20 TAILORED BRANDS 0.9% 0.7% 21 XPONENTIAL FITNESS 0.7%
0.7% 22 AMERICA’S BEST CONTACTS 0.6% 0.6% 23 SIXTY VINES 0.4% 0.6% 24 BMO HARRIS BANK 0.4% 0.6% 25 JERSEY MIKE’S 0.6% 0.5% 1 Buffalo Wild Wings, Dunkin Donuts, Jimmy John’s TOP 25 – SHOP TOTAL 23.9% 25.8% 2 Panera Bread,
Bruegger’s 3 Firehouse Subs, Burger King, Popeye’s Chicken Note: As of September 30, 2023. 25
SITE CENTERS (SITC) 2 6

PRO FORMA SITE CENTERS: CURATED SHOPPING CENTER PORTFOLIO 1 OF SHOPPING
CENTERS NATIONALLY 114k 121 53 WO/JV ASSETS WO/JV ASSETS SOLD SINCE 3Q18 ACQUIRED SINCE 3Q18 AVG HHI P OP U L A T I ON 88th 79th P ER C EN T I L E P ER C EN T I L E 70 $ 109k 118k SITC PORTFOLIO WHOLLY-OWNED SHOPPING CENTERS SITC PORTFOLIO WEIGHTED
AVG TAP SCORE 73 55 15 JV AND THIRD PARTY LEGACY ACQUISITIONS PROPERTIES 1 Source: ICSC Note: As of September 30, 2023. 27
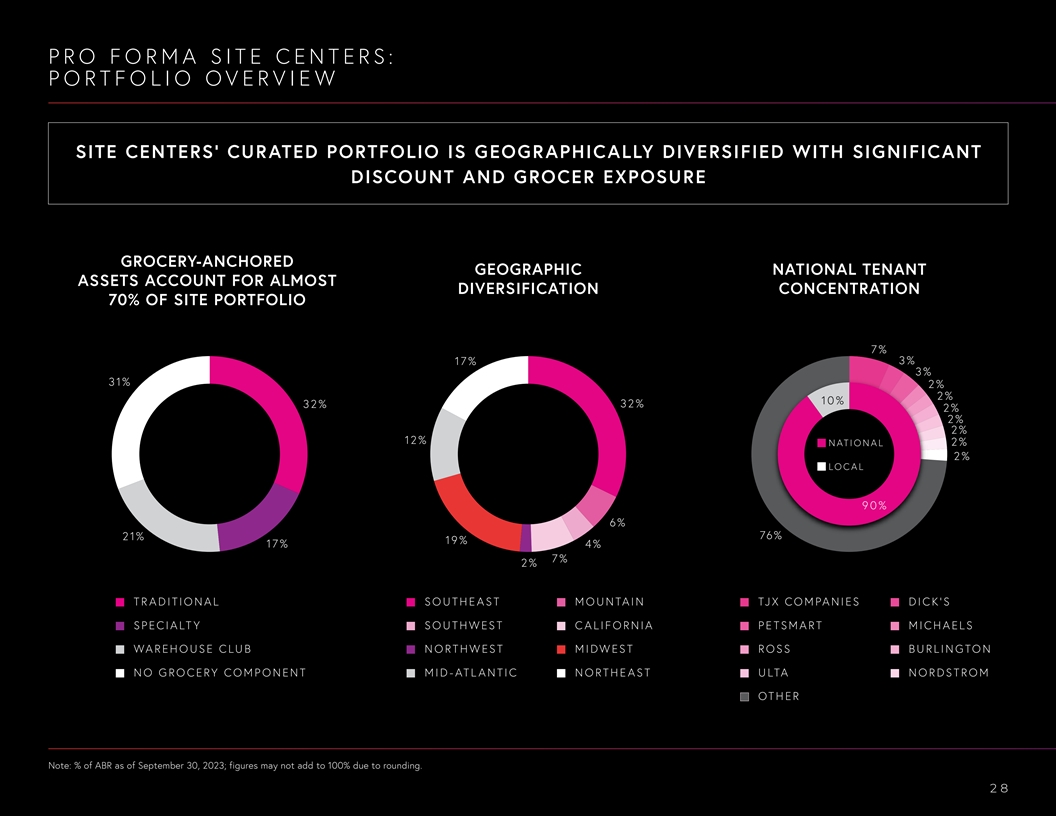
PRO FORMA SITE CENTERS: P O RT F OLIO OVERVIEW SITE CENTERS’
CURATED PORTFOLIO IS GEOGRAPHICALLY DIVERSIFIED WITH SIGNIFICANT DISCOUNT AND GROCER EXPOSURE GROCERY-ANCHORED GEOGRAPHIC NATIONAL TENANT ASSETS ACCOUNT FOR ALMOST DIVERSIFICATION CONCENTRATION 70% OF SITE PORTFOLIO 7% 3% 17 % 3% 3 1% 2% 2% 10 % 32
% 32 % 2% 2% 2% 12 % NAT I O NAL 2% 2% LO C A L 90 % 6% 2 1% 76% 19 % 17 % 4 % 7% 2% T R A D I T I O N A L S O U TH E A ST M O U N TAIN TJX COMPANIES D I CK ’ S S PE C I A LT Y S O U TH W EST C A L I FO R N I A P E T SM A RT M I C H A E L S
WAREHOUSE CLUB N O R TH W EST M I D W ES T R OS S B U R L I N G TO N NO GROCERY COMPONENT M I D - AT L A N T I C N O R TH E A ST U LTA N O R D STR O M OT H E R Note: % of ABR as of September 30, 2023; figures may not add to 100% due to rounding.
28
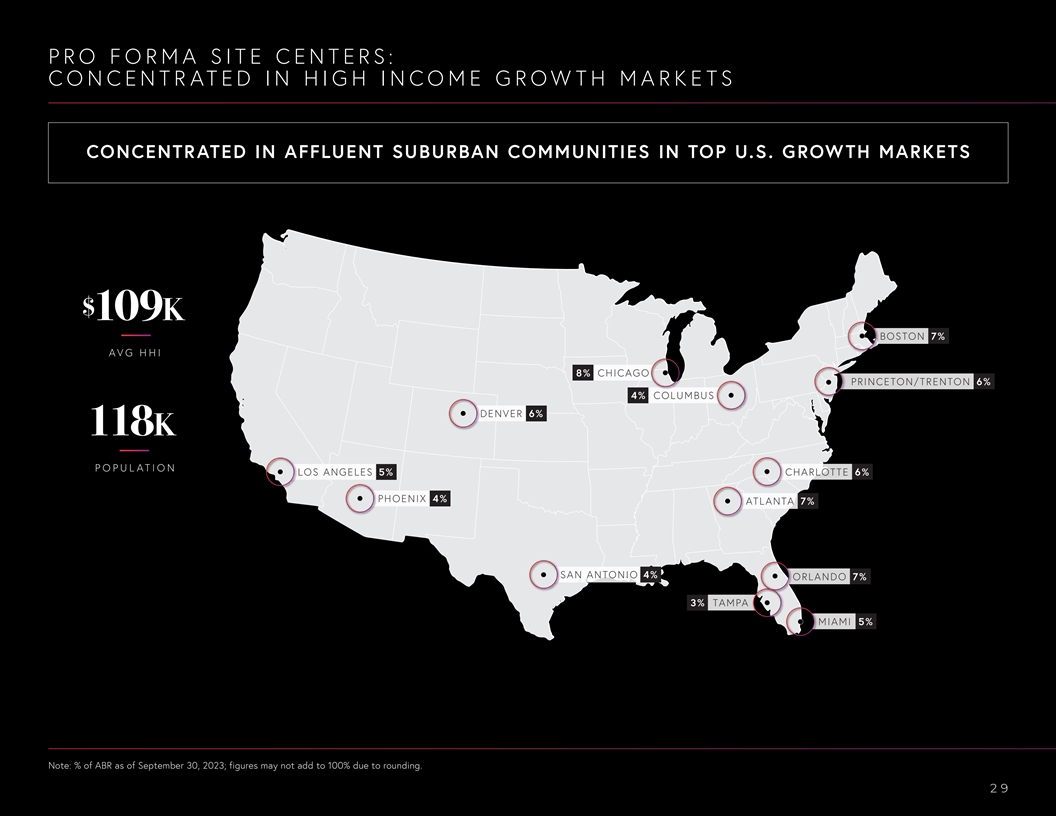
PRO FORMA SITE CENTERS: CONCENTRATED IN HIGH INCOME GROWTH MARKETS
CONCENTRATED IN AFFLUENT SUBURBAN COMMUNITIES IN TOP U.S. GROWTH MARKETS $ 109k BOSTON 7% AVG HHI 8% CHICAGO PRINCETON/TRENTON 6% 4% COLUMBUS DENVER 6% 118k P OP U L A T I ON LOS ANGELES 5% CHARLOTTE 6% PHOENIX 4% ATLANTA 7% SAN ANTONIO 4% ORLANDO
7% 3% TAMPA MIAMI 5% Note: % of ABR as of September 30, 2023; figures may not add to 100% due to rounding. 29
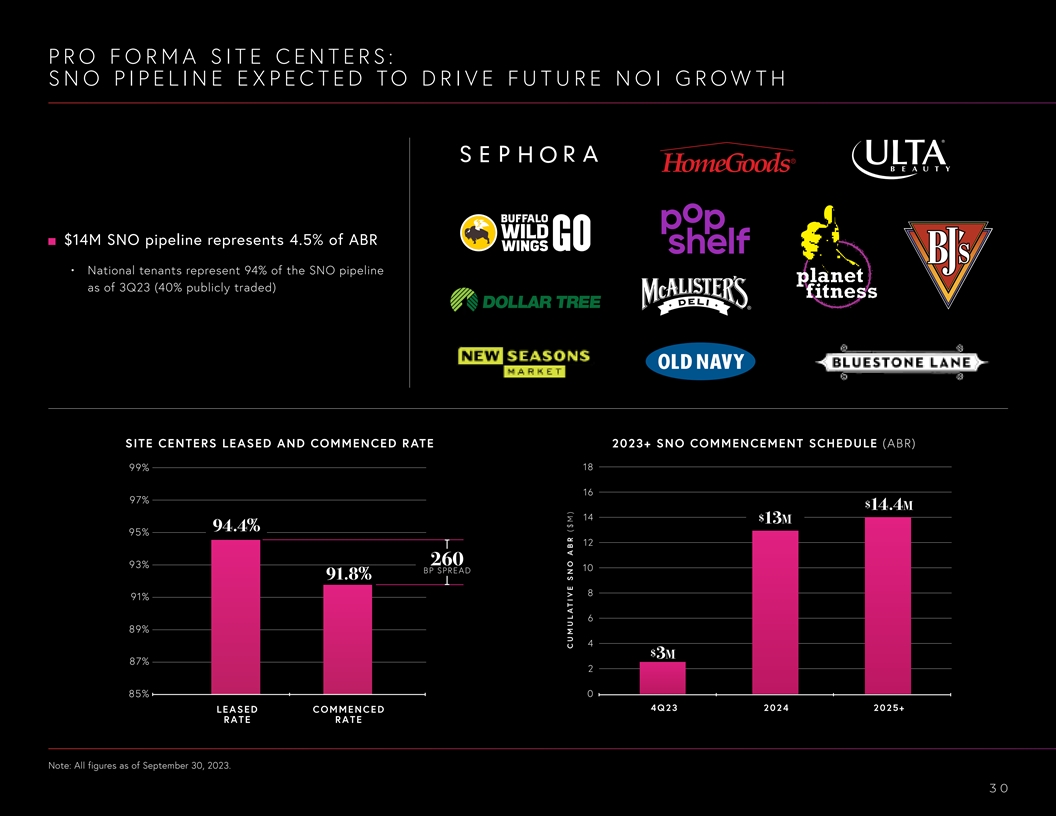
PRO FORMA SITE CENTERS: SNO PIPELINE EXPECTED TO DRIVE FUTURE NOI
GROWTH $14M SNO pipeline represents 4.5% of ABR • National tenants represent 94% of the SNO pipeline as of 3Q23 (40% publicly traded) ® SITE CENTERS LEASED AND COMMENCED RATE 2023+ SNO COMMENCEMENT SCHEDULE (ABR) 99% 18 16 97% $ 14.4m 14
$ 13m 94.4% 95% 12 260 93% 10 BP SPREAD 91.8% 8 91% 6 89% 4 $ 3m 87% 2 85% 0 4Q23 2024 2025+ LEASED COMMENCED RATE RATE Note: All figures as of September 30, 2023. 30 CUMUL ATIVE SNO ABR ($ M )

PRO FORMA SITE CENTERS: SELECT ASSET OVERVIEW CURATED PORTFOLIO OF
ASSETS CONCENTRATED IN TOP SUBMARKETS CARILLON EAST HANOVER FAIRFAX NASSAU PARK PROMENADE WHOLE FOODS PLACE PLAZA TOWNE CENTER PAVILION AT BRENTWOOD AT BAY PLACE NAPLES NEW YORK WASHINGTON, DC PRINCETON ST. LOUIS SAN FRANCISCO MSA MSA MSA MSA MSA
MSA 265k 98k 253k 750k 338k 57k OWNED GLA OWNED GLA OWNED GLA OWNED GLA OWNED GLA OWNED GLA $ $ $ $ $ $ 122k 178k 160k 222k 138k 121k AVG. HHI AVG. HHI AVG. HHI AVG. HHI AVG. HHI AVG. HHI 60 77 98 87 98 95 TAP SCORE TAP SCORE TAP SCORE TAP SCORE TAP
SCORE TAP SCORE $ $ $ $ $ $ 16.93 21.11 25.36 15.54 15.94 51.02 ABR PSF ABR PSF ABR PSF ABR PSF ABR PSF ABR PSF KEY TENANTS KEY TENANTS KEY TENANTS KEY TENANTS KEY TENANTS KEY TENANT Walmart HomeGoods, Safeway, TJMaxx Wegmans, Best Buy, Trader
Joe’s, Whole Foods Neighborhood HomeSense Dick’s Sporting Goods, Target, Market, TJMaxx, HomeGoods, Burlington Ross HomeSense, TJMaxx 31
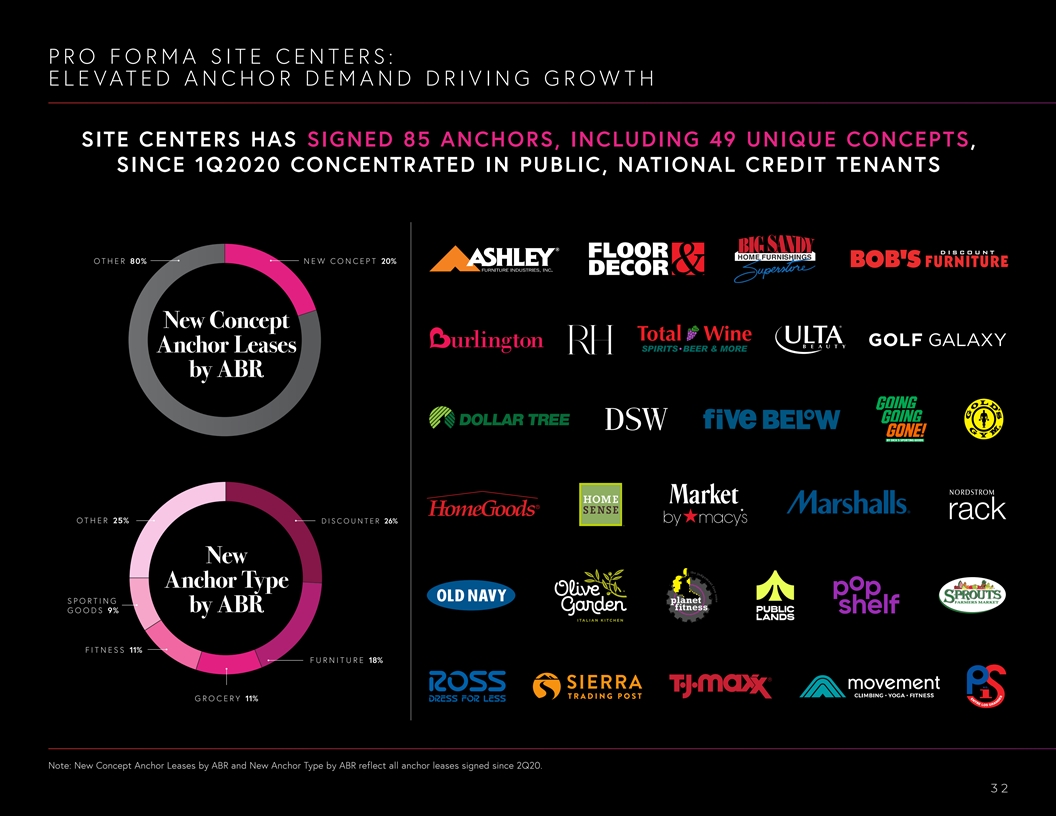
PRO FORMA SITE CENTERS: ELEVATED ANCHOR DEMAND DRIVING GROWTH SITE
CENTERS HAS SIGNED 85 ANCHORS, INCLUDING 49 UNIQUE CONCEPTS, SINCE 1Q2020 CONCENTRATED IN PUBLIC, NATIONAL CREDIT TENANTS OT H E R 80% NEW CONCEPT 20% New Concept Anchor Leases by ABR OT H E R 25% D I S C O U NT E R 26% New Anchor Type SP O R TI N G
by ABR GO OD S 9% ® F I T N ES S 11% F URN I T URE 18% GR OC E R Y 11% Note: New Concept Anchor Leases by ABR and New Anchor Type by ABR reflect all anchor leases signed since 2Q20. 32
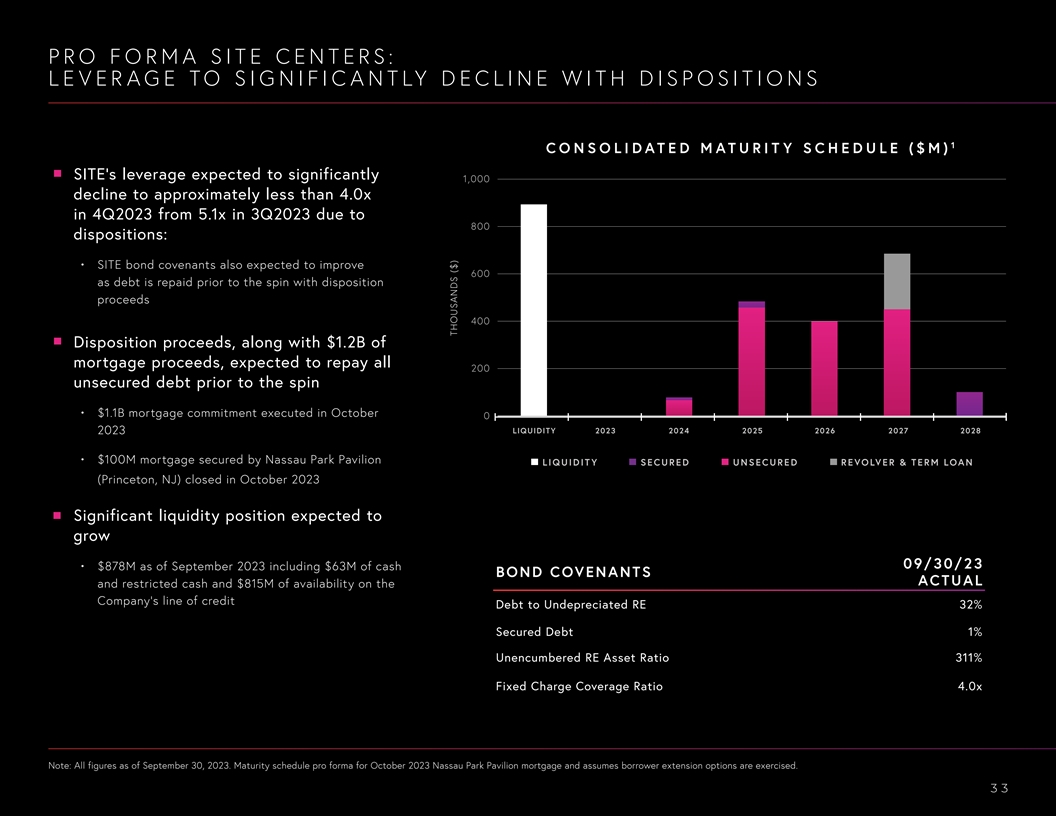
PRO FORMA SITE CENTERS: LEVERAGE TO SIGNIFICANTLY DECLINE WITH
DISPOSITIONS 1 CONSOLIDATED MATURITY SCHEDULE ($M) SITE’s leverage expected to significantly 1,000 decline to approximately less than 4.0x in 4Q2023 from 5.1x in 3Q2023 due to 800 dispositions: • SITE bond covenants also expected to
improve 600 as debt is repaid prior to the spin with disposition proceeds 400 Disposition proceeds, along with $1.2B of mortgage proceeds, expected to repay all 200 unsecured debt prior to the spin • $1.1B mortgage commitment executed in
October 0 LIQUIDITY 2023 2024 2025 2026 2027 2028 2023 • $100M mortgage secured by Nassau Park Pavilion LIQUIDIT Y SECU RE D U NSECU RE D REVOLVER & TERM LOAN (Princeton, NJ) closed in October 2023 Significant liquidity position expected
to grow 09/30/23 • $878M as of September 2023 including $63M of cash BOND COVENANTS ACTUAL and restricted cash and $815M of availability on the Company’s line of credit Debt to Undepreciated RE 32% Secured Debt 1% Unencumbered RE Asset
Ratio 311% Fixed Charge Coverage Ratio 4.0x Note: All figures as of September 30, 2023. Maturity schedule pro forma for October 2023 Nassau Park Pavilion mortgage and assumes borrower extension options are exercised. 33 THOUSANDS ($)
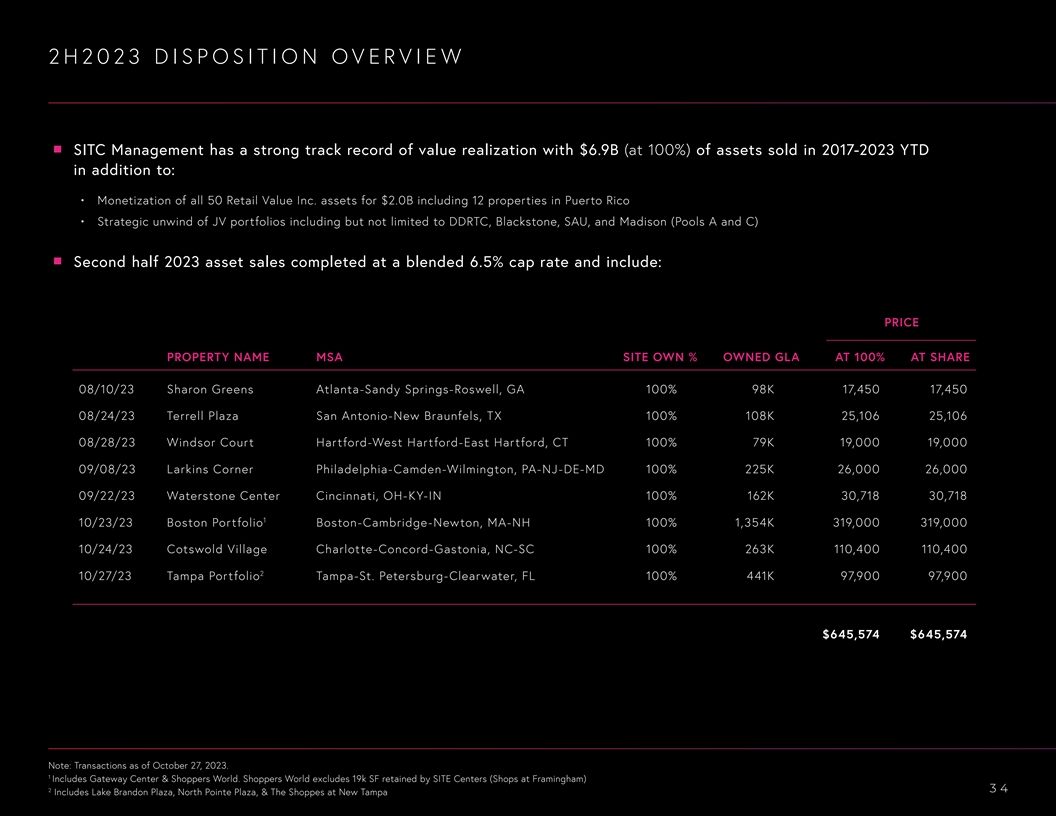
2H2023 DISPOSITION OVERVIEW SITC Management has a strong track record
of value realization with $6.9B (at 100%) of assets sold in 2017-2023 YTD in addition to: • Monetization of all 50 Retail Value Inc. assets for $2.0B including 12 properties in Puerto Rico • Strategic unwind of JV portfolios including
but not limited to DDRTC, Blackstone, SAU, and Madison (Pools A and C) Second half 2023 asset sales completed at a blended 6.5% cap rate and include: PRICE PROPERTY NAME MSA SITE OWN % OWNED GLA AT 100% AT SHARE 08/10/23 Sharon Greens Atlanta-Sandy
Springs-Roswell, GA 100% 98K 17,450 17,450 08/24/23 Terrell Plaza San Antonio-New Braunfels, TX 100% 108K 25,106 25,106 08/28/23 Windsor Court Hartford-West Hartford-East Hartford, CT 100% 79K 19,000 19,000 09/08/23 Larkins Corner
Philadelphia-Camden-Wilmington, PA-NJ-DE-MD 100% 225K 26,000 26,000 09/22/23 Waterstone Center Cincinnati, OH-KY-IN 100% 162K 30,718 30,718 1 10/23/23 Boston Portfolio Boston-Cambridge-Newton, MA-NH 100% 1,354K 319,000 319,000 10/24/23 Cotswold
Village Charlotte-Concord-Gastonia, NC-SC 100% 263K 110,400 110,400 2 10/27/23 Tampa Portfolio Tampa-St. Petersburg-Clearwater, FL 100% 441K 97,900 97,900 $645,574 $645,574 Note: Transactions as of October 27, 2023. 1 Includes Gateway Center &
Shoppers World. Shoppers World excludes 19k SF retained by SITE Centers (Shops at Framingham) 2 34 Includes Lake Brandon Plaza, North Pointe Plaza, & The Shoppes at New Tampa
APPENDIX 35

STOP STOP 400 CHASE 5,000 SF STOP STOP STOP STOP STOP PYLON 38.5' 38.5'
29.8' 24.5' 43.8' U-201 UNOWNED UNOWNED U-203 PYLON OFFICE CENTERS SITE PYLON 90' 296' 386' NORTH / SOUTH RD PYLON PYLON PYLON BEECH AVE U-704 PYLON PYLON YALE AVE 15 19 19 17 21 19 19 24 24 21 15 35 27 149.5' 99.5' SOUTH BLVD CURBLINE PROPERTIES:
CONVENIENCE PARCEL SEPARATION PROJECT SITE Centers has worked to separate Convenience assets from existing properties for the last 2+ years. The separated properties in the Curbline spin share similar characteristics with unanchored assets purchased
to date and were selected based on expected cash flow growth, demographics, tenant credit profile and other key financial and real estate attributes. 15 12 45' 115' 120' 39' U-LOGAN 30' EXPRESS 19 5 511 512 DSW 5 12 513 MICHAELS 24,560 SF 27,089 SF
24' 259' 45' 165' 191.7' 35' 4 21 514 18 22 MARSHALLS 12 50,081 SF 47 20 7 47 5 287 16 8 22 17 16 16 12 224' 5 8 17 16 16 22.6' 515B ULTA BEAUTY 9,990 SF 48 11 143' 15 19 48 15 12 3 20 13 15 14 14 600 14 15 14 14 AMC THEATRES 388 17 515A 107' 85,000
SF PUBLIC LANDS 48 506 19 49,148 SF 48 J.CREW FACTORY 17 6,490 SF 22 17 22 17 16 18 177.3' 29 19 17 16 18 578 505A 7 4 200' GOLF GALAXY 21 20 21,848 SF 14 13 9 41 21 20 10 505B 14 SHOPPERS 8 17 16 18 FIVE BELOW 505C 14 UNIVERSITY 9940 9,743 SF 15 19
19 17 16 18 69' 19 19 KOHL'S 4 517 397 15 15 10 88,216 SF NORDSTROM 54 19 21 54 665 22 22 RACK 19 40,159 SF 19 16 16 16 504 13 27 WORLD 8 T.J. MAXX 22 HILLS 200' 16 16 16 39,884 SF 22 13 12 230' 21 6 19 50 15 518 18 HOME SENSE 50 22 25,447 SF 200'
24 21 17 14 15 518A 17 14 15 MSA: BOSTON 368 MSA: DENVER 25' SIERRA TRADING POST 16 17,396 SF 49 503 49 MACY'S FURNITURE 215' GALLERY 17 14 15 40,000 SF 5 15 5 519 17 14 15 PETSMART 30,000 SF 190' 19 17 19 17 U-WALMART 212.7' 9 49 520 49 5 275 31
BEST BUY 502 25' 30 50,090 SF 16 14 15 HOBBY LOBBY 16 14 15 45,000 SF 16 35' 27 10' 51 521C 51 521B 198.4' 16' 81.3' 501 521A 16 14 15 COST PLUS WORLD 214' 16 14 15 15 MARKET 18 344 18,249 SF 49 182' 36' 33' 45' 522 49 FUTURE GROCER 20' 38,644 SF
25' 16 14 15 16 14 15 11 5 U-BEN & JERRY'S 42.3' 14 21 12 13 U-BOLOCO PYLON U-THE 3 8 22 31 2 13 CONTAINER 9 289 STORE 11 10 13 26 26 9 9 9 9 40' 34.7' 28.8' 108' 601U OLIVE GARDEN 15 8 9,200 SF 13 16 18 9 RTE 9 WORCESTER RD 108 DETENTION AMC
THEATRES 22 83,172 SF BASIN 24 16 25 12 14 5 18 87 214-A 4 18 18 5 14 14 6 6 6 6 14 14 12 20 20 20 20 204 ROSS DRESS FOR 21 17 18 U-216 LESS 206A 8 10 30,187 SF OLD NAVY 11 11 11 11 14,070 SF TARGET 5 123,735 SF 6 8 DETENTION 4 44' 68' 51' 27 210
BASIN 6 118 14 18' COZY FOX 212 25 25 13 13 26 26 13 13 74.3' 37.9' 104 104 10 12 23 22 25 25 92.8' 8,750 SF 35 3 17 11 11 24 34 35 214 51.6' 65.9' 11 31 33 116 11 11 12 25.6' DOLLAR TREE 608 7 12 12 12 11 11 82' 10,800 SF 112 34 312 DSW 159.1'
116.9' 77 68 19,329 SF 223' 40.5' 81 40 39 79 79 67 300 24 HOUR FITNESS 41 11 40,000 SF 135.1' 20' 24 CVS 147.6' 114 94' 135' 14,984 SF AVAILABLE 77' 66.5' 121 122 23 114 4 31,278 SF AMERICAN FREIGHT FLOOR & DECOR 6 7 6 MICHAELS 116 OUTLET
STORES 74,798 SF 6 7 241.6' 24 165.7' AVAILABLE 35,000 SF 6 FALCON RIDGE 24,000 SF 24 37,000 SF 117 119 CAROLINA 33 21 107 189.8' 118 FRONTGATE 6 7 6 BIG LOTS 12 16 3 NORDSTROM OUTLET STORE 6 7 66 33,685 SF 12 CONN'S 26,043 SF 353.9' 6 5 735 19 6
RACK 198.8' 9 42,587 SF 42,375 SF 6 7 50 24 38 25 25 6 6 106 20 20 193.5' 7 6 15 20 20 10 10 22 22 131.1' 124.5' 6 8 33 38 444 105 9 191.8' 24 20 18 12 10 6 5 4 13 TOWN CENTER 26 JUST PLAY 10,000 SF 9 19 19 PAVILION 12 18 14 14 23 32 36 30 42 42 12
18 11 17 17 112 36 11 4 4 32 20 20 45 39 10 10 10 10 22 22 22 22 17 17 8 STATER BROS 22 23 23 35 19 19 7 8 22 17 22 22 23 23 7 32 31 MARKETS 17 31 34 35' 43,718 SF 5 11 17 11 22 22 16 14 11 17 21 21 21 21 15 15 MSA: LOS ANGELES 197 11 12 12 12 12
MSA: CHARLOTTE U-104 23 23 16 16 44 22 19 2 13 TARGET 19 20 20 15 15 14 13 117,300 SF 7 18 10 19 19 19 19 6 17 11 16 15 48 10 17 11 6 8 8 3 24 9 13 13 7 11 11 26 11 11 11 11 49 11 20 13 13 15 11 20 9 62 135 3 4 18 10 10 6 8 7 28 10 6 24 6 STOP 600
606 8 6 4 DETENTION 98' 10 17 46 4 4 8 5 BASIN 10 11 4 U-404 U-402 47 20.2' 17 10 10 10 26 WELLS FARGO BANK 5 23 U-406 5,271 SF 5 14 19 31 5 12 15.6' 18 CHILI'S GRILL & 103 19 17 PLATO'S CLO 124 SET 5 9 19 20 BAR 107.8' 6,457 SF 23 13 14 6,114
SF 4 12 VALUE CITY 23 19 9 10 22 6 9 U-206 FURNITURE 10 19 6 8 102 53,000 SF DOLLAR TR 125 EE JO-ANN 22 13,513 SF U-202 6 10 23,500 SF 127 249.2' AUTOZONE 18 17 6 34,574 SF U-700 123.4' 13 3 5 16 16 16 15 4 4 7 47 11 9 13 3 4 23 3 62 10 12 12 22 14
3 7 12 12 16 12 4 5 U-702 101 5 18 9 9 15 9 22 36 9 70 93.4' 5 9 21 18 79 15 36 16 61 MARSHALLS 22,821 SF 62.5' 8 OFFICE DEPOT 42 40 38 97.7' 7 16,724 SF 11 1 3 13 31.9' 14 15 16 17 19 20 34 36 31.9' 112.6' 117.9' 24.4' 24.4' 24.4' 40.3' 37' 4 11 6
12 32 634 14 9 19 83 9 8 40 U-71 30 40 17 98 38 KING SOOPERS 65,575 SF 9 40 40 74 36 14 74 74 74 74 9 20 6 13 128 346' 5 13 105' 62.5' 23.3' 134.8' 73E 12 12 15 14 73D 23 27 25 56 PETSMART 46.3' 36.6' 51.9' 11 73C 15,250 SF 55 24 26 26 10 MICHAELS
29 73B 86' 32,436 SF 204 73A U-74 69.8' 7 17 28 PEAK DENTAL 57B SERVICES GOPUFF 6,878 SF 6,395 SF 11 15 79.3' 148.5' AMHERST AVE PYLON FLUTIE PASS 17 55.4' 66.7' 132.9' 295.6' 46' 128' 216.6' 193.1' 100.5' U-200 SOUTH BLVD SOUTH BLVD PYLON 64.4'
100-C 100-B 100-A COCHITUATE RD RTE 30 SUMMIT AVE 265.5' 9950 15,002 SF MAINELY TUBS 166.5' 9945 PYLON INTERSTATE 15 FREEWAY I-485 PYLON BURR ST EXT 125.6' GOV JAMES G MARTIN FWY 36.5' STOP U-72 50.8' 15.5' 67.3' 25' 32' 132.2' 113.9' 110 115 31,000
SF 21,183 SF ROSS DRESS FOR 19,183 SF BURLINGTON 111 113 OLD NAVY MARKET LESS COST PLUS WORLD 180' 120 88.5' 69.3' 34.9' 25.4' 25,289 SF 197.9' 203.9' 100 102 104 106 108 110 200 STOP STOP STOP STOP PARTY CITY 11,691 SF 139' 201 FAMOUS FOOTWEAR
6,230 SF 152.6' 202 ULTA BEAUTY 10,331 SF 190.8' 203 FIVE BELOW 35' 25' 10,034 SF 22' 25' 28.6' 25' 130' 10' 195' 160' 265' 800 123' 602 200' 228.5' 70' 220' 84.68' 104.5' 12' 15' 604 176.7' 23.8' 23.8' 23.8' 190' 140' 120' 144' 75' 700A 160' 700B
700C 500 502 504 66.7' 506 508 85' 510 512 100.7' 61' 98.7' 50.7' 50.7' 210.5' 200' 80' 120' 61' 523 524 12' 525 49' 66' 76.7' 22' 88.2' 77.8' 36' BOULDER WAY 302 304 306 308 310 188.4' 294' 62.8' 20.7' 24' 57.2' 173.6' 58.3' 28' 117.7' 98.5' 212.3'
32.7' 64.7' 202' 18.5' 20' 24' PYLON 28' PYLON S COLORADO BLVD 114' 30 ULTA BEAUTY 9,744 SF 206.5' 171.2' 220' 57 FIVE BELOW 160' 86.1' 133.9' 57A 67.4' 16.7' 34.3' 114.4' 75.1' 127.8' 236.3' 10,000 SF STOP 90.4' 90.4' 90.4' 48.1' 47.6' 40.7' 175.5'
40.6' PYLON 53.5' 16,398 SF PETSMART 126 244' 200' 86.9' 4' 45.2 PYLON 38' 18.2 STOP STOP STOP
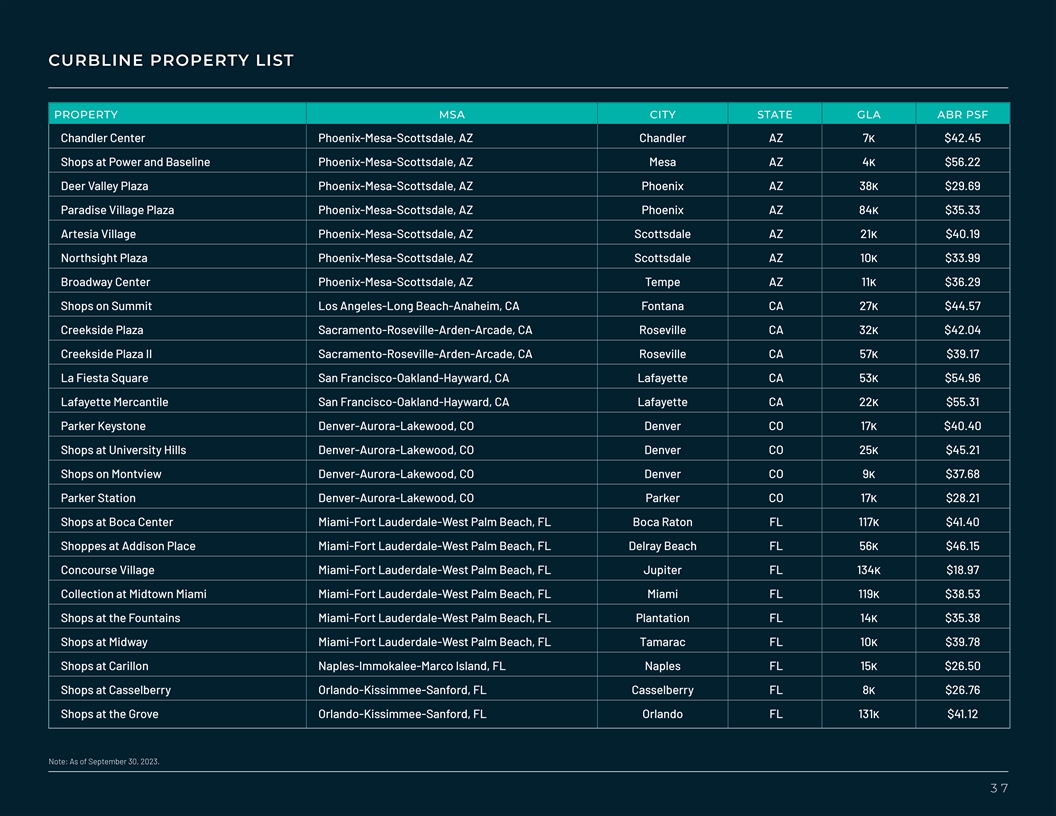
CURBLINE PROPERTY LIST PROPERTY MSA CITY STATE GLA ABR PSF Chandler
Center Phoenix-Mesa-Scottsdale, AZ Chandler AZ 7k $42.45 Shops at Power and Baseline Phoenix-Mesa-Scottsdale, AZ Mesa AZ 4k $56.22 Deer Valley Plaza Phoenix-Mesa-Scottsdale, AZ Phoenix AZ 38k $29.69 Paradise Village Plaza Phoenix-Mesa-Scottsdale, AZ
Phoenix AZ 84k $35.33 Artesia Village Phoenix-Mesa-Scottsdale, AZ Scottsdale AZ 21k $40.19 Northsight Plaza Phoenix-Mesa-Scottsdale, AZ Scottsdale AZ 10k $33.99 Broadway Center Phoenix-Mesa-Scottsdale, AZ Tempe AZ 11k $36.29 Shops on Summit Los
Angeles-Long Beach-Anaheim, CA Fontana CA 27k $44.57 Creekside Plaza Sacramento-Roseville-Arden-Arcade, CA Roseville CA 32k $42.04 Creekside Plaza II Sacramento-Roseville-Arden-Arcade, CA Roseville CA 57k $39.17 La Fiesta Square San
Francisco-Oakland-Hayward, CA Lafayette CA 53k $54.96 Lafayette Mercantile San Francisco-Oakland-Hayward, CA Lafayette CA 22k $55.31 Parker Keystone Denver-Aurora-Lakewood, CO Denver CO 17k $40.40 Shops at University Hills Denver-Aurora-Lakewood, CO
Denver CO 25k $45.21 Shops on Montview Denver-Aurora-Lakewood, CO Denver CO 9k $37.68 Parker Station Denver-Aurora-Lakewood, CO Parker CO 17k $28.21 Shops at Boca Center Miami-Fort Lauderdale-West Palm Beach, FL Boca Raton FL 117k $41.40 Shoppes at
Addison Place Miami-Fort Lauderdale-West Palm Beach, FL Delray Beach FL 56k $46.15 Concourse Village Miami-Fort Lauderdale-West Palm Beach, FL Jupiter FL 134k $18.97 Collection at Midtown Miami Miami-Fort Lauderdale-West Palm Beach, FL Miami FL 119k
$38.53 Shops at the Fountains Miami-Fort Lauderdale-West Palm Beach, FL Plantation FL 14k $35.38 Shops at Midway Miami-Fort Lauderdale-West Palm Beach, FL Tamarac FL 10k $39.78 Shops at Carillon Naples-Immokalee-Marco Island, FL Naples FL 15k $26.50
Shops at Casselberry Orlando-Kissimmee-Sanford, FL Casselberry FL 8k $26.76 Shops at the Grove Orlando-Kissimmee-Sanford, FL Orlando FL 131k $41.12 Note: As of September 30, 2023. 37
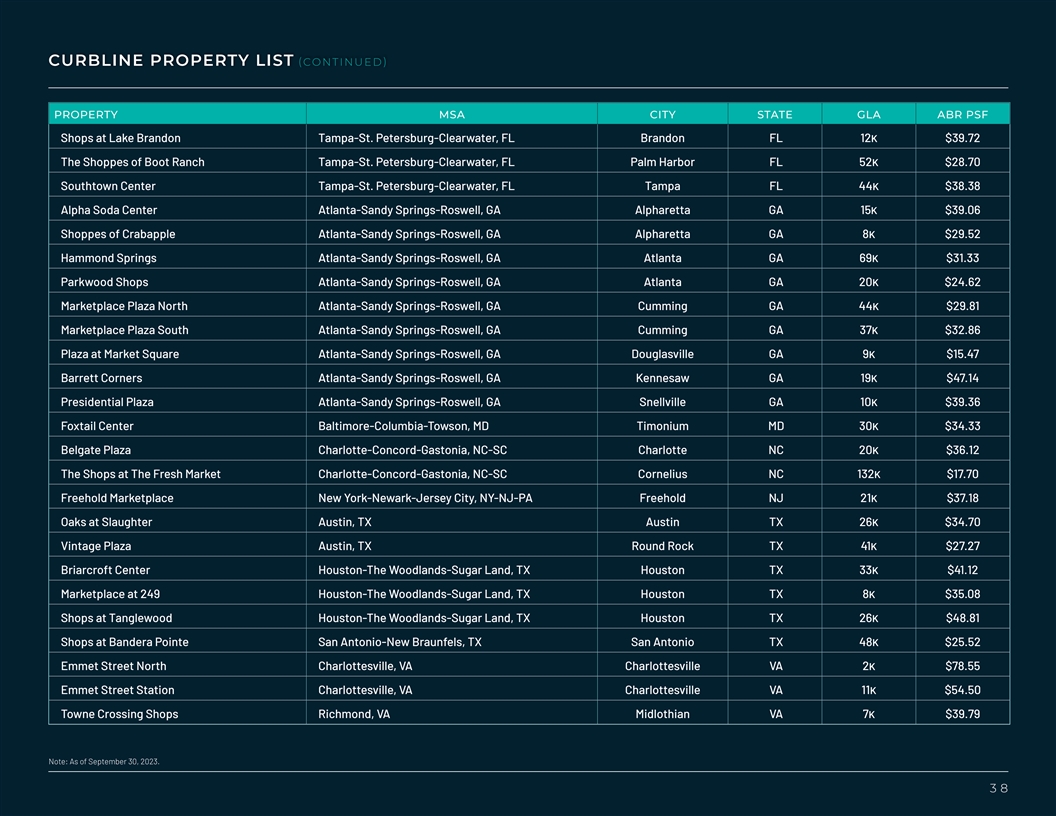
CURBLINE PROPERTY LIST (CONTINUED ) PROPERTY MSA CITY STATE GLA ABR PSF
Shops at Lake Brandon Tampa-St. Petersburg-Clearwater, FL Brandon FL 12k $39.72 The Shoppes of Boot Ranch Tampa-St. Petersburg-Clearwater, FL Palm Harbor FL 52k $28.70 Southtown Center Tampa-St. Petersburg-Clearwater, FL Tampa FL 44k $38.38 Alpha
Soda Center Atlanta-Sandy Springs-Roswell, GA Alpharetta GA 15k $39.06 Shoppes of Crabapple Atlanta-Sandy Springs-Roswell, GA Alpharetta GA 8k $29.52 Hammond Springs Atlanta-Sandy Springs-Roswell, GA Atlanta GA 69k $31.33 Parkwood Shops
Atlanta-Sandy Springs-Roswell, GA Atlanta GA 20k $24.62 Marketplace Plaza North Atlanta-Sandy Springs-Roswell, GA Cumming GA 44k $29.81 Marketplace Plaza South Atlanta-Sandy Springs-Roswell, GA Cumming GA 37k $32.86 Plaza at Market Square
Atlanta-Sandy Springs-Roswell, GA Douglasville GA 9k $15.47 Barrett Corners Atlanta-Sandy Springs-Roswell, GA Kennesaw GA 19k $47.14 Presidential Plaza Atlanta-Sandy Springs-Roswell, GA Snellville GA 10k $39.36 Foxtail Center
Baltimore-Columbia-Towson, MD Timonium MD 30k $34.33 Belgate Plaza Charlotte-Concord-Gastonia, NC-SC Charlotte NC 20k $36.12 The Shops at The Fresh Market Charlotte-Concord-Gastonia, NC-SC Cornelius NC 132k $17.70 Freehold Marketplace New
York-Newark-Jersey City, NY-NJ-PA Freehold NJ 21k $37.18 Oaks at Slaughter Austin, TX Austin TX 26k $34.70 Vintage Plaza Austin, TX Round Rock TX 41k $27.27 Briarcroft Center Houston-The Woodlands-Sugar Land, TX Houston TX 33k $41.12 Marketplace at
249 Houston-The Woodlands-Sugar Land, TX Houston TX 8k $35.08 Shops at Tanglewood Houston-The Woodlands-Sugar Land, TX Houston TX 26k $48.81 Shops at Bandera Pointe San Antonio-New Braunfels, TX San Antonio TX 48k $25.52 Emmet Street North
Charlottesville, VA Charlottesville VA 2k $78.55 Emmet Street Station Charlottesville, VA Charlottesville VA 11k $54.50 Towne Crossing Shops Richmond, VA Midlothian VA 7k $39.79 Note: As of September 30, 2023. 38
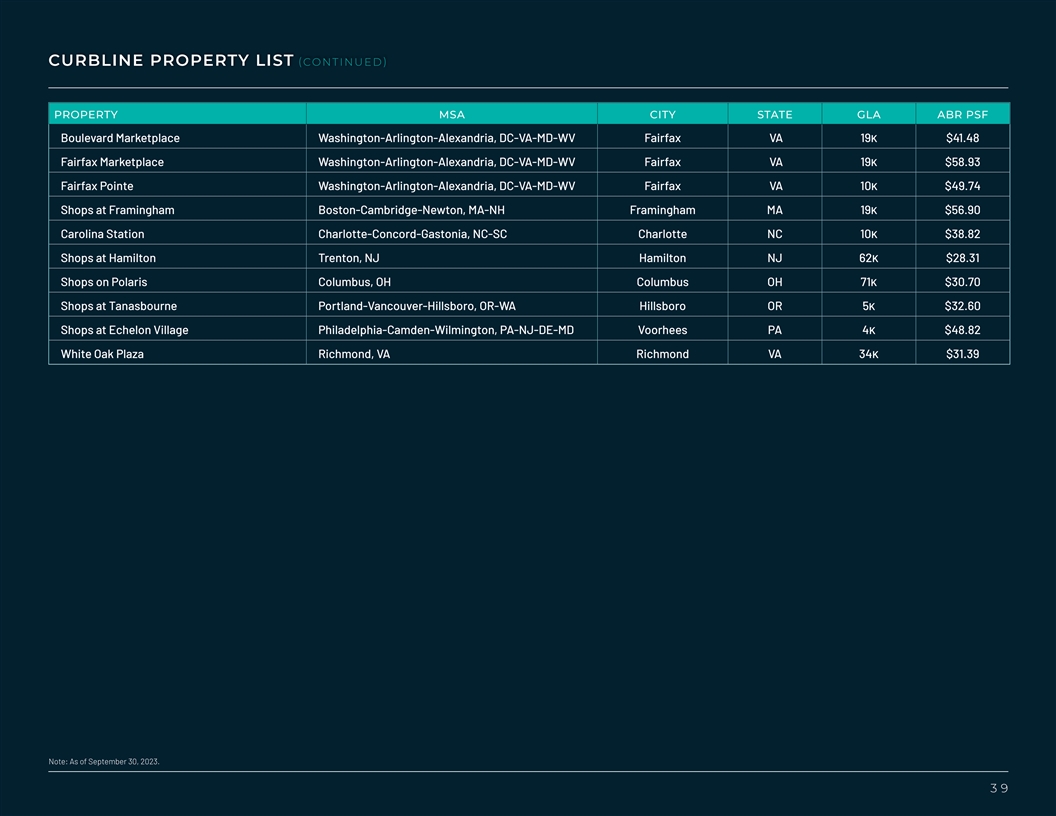
CURBLINE PROPERTY LIST (CONTINUED ) PROPERTY MSA CITY STATE GLA ABR PSF
Boulevard Marketplace Washington-Arlington-Alexandria, DC-VA-MD-WV Fairfax VA 19k $41.48 Fairfax Marketplace Washington-Arlington-Alexandria, DC-VA-MD-WV Fairfax VA 19k $58.93 Fairfax Pointe Washington-Arlington-Alexandria, DC-VA-MD-WV Fairfax VA
10k $49.74 Shops at Framingham Boston-Cambridge-Newton, MA-NH Framingham MA 19k $56.90 Carolina Station Charlotte-Concord-Gastonia, NC-SC Charlotte NC 10k $38.82 Shops at Hamilton Trenton, NJ Hamilton NJ 62k $28.31 Shops on Polaris Columbus, OH
Columbus OH 71k $30.70 Shops at Tanasbourne Portland-Vancouver-Hillsboro, OR-WA Hillsboro OR 5k $32.60 Shops at Echelon Village Philadelphia-Camden-Wilmington, PA-NJ-DE-MD Voorhees PA 4k $48.82 White Oak Plaza Richmond, VA Richmond VA 34k $31.39
Note: As of September 30, 2023. 39
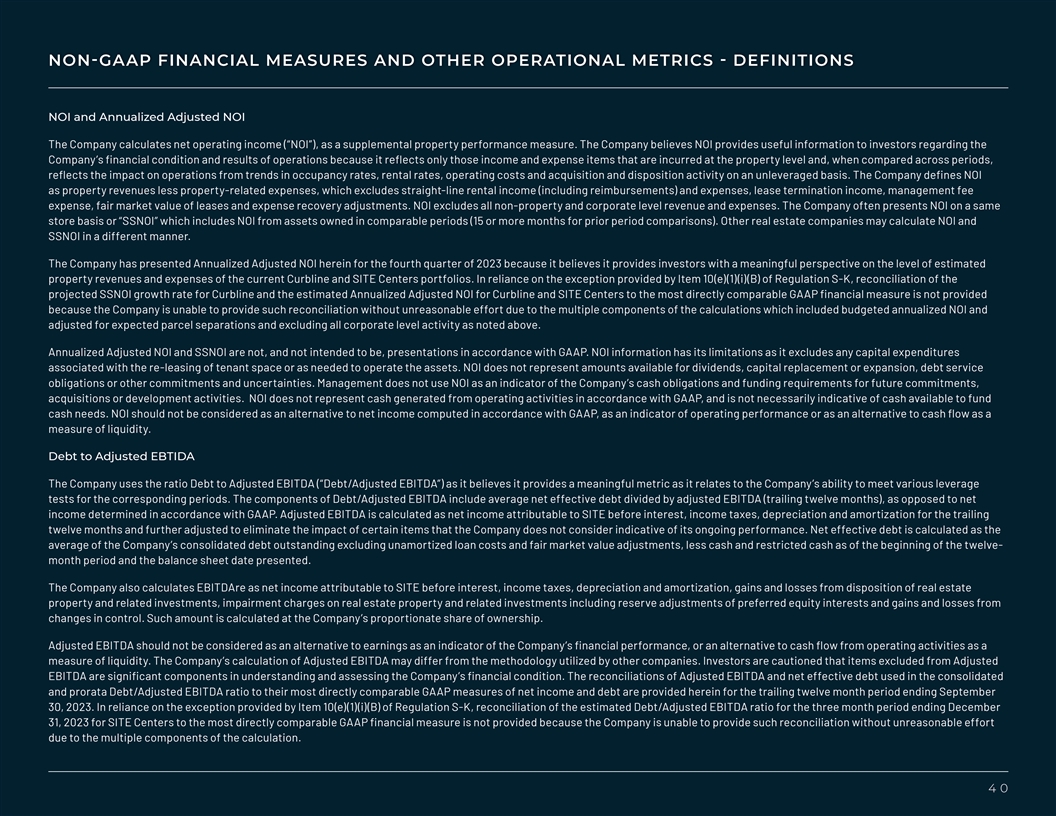
NON-GAAP FINANCIAL MEASURES AND OTHER OPERATIONAL METRICS - DEFINITIONS
NOI and Annualized Adjusted NOI The Company calculates net operating income (“NOI”), as a supplemental property performance measure. The Company believes NOI provides useful information to investors regarding the Company’s
financial condition and results of operations because it reflects only those income and expense items that are incurred at the property level and, when compared across periods, reflects the impact on operations from trends in occupancy rates, rental
rates, operating costs and acquisition and disposition activity on an unleveraged basis. The Company defines NOI as property revenues less property-related expenses, which excludes straight-line rental income (including reimbursements) and expenses,
lease termination income, management fee expense, fair market value of leases and expense recovery adjustments. NOI excludes all non-property and corporate level revenue and expenses. The Company often presents NOI on a same store basis or
“SSNOI” which includes NOI from assets owned in comparable periods (15 or more months for prior period comparisons). Other real estate companies may calculate NOI and SSNOI in a different manner. The Company has presented Annualized
Adjusted NOI herein for the fourth quarter of 2023 because it believes it provides investors with a meaningful perspective on the level of estimated property revenues and expenses of the current Curbline and SITE Centers portfolios. In reliance on
the exception provided by Item 10(e)(1)(i)(B) of Regulation S-K, reconciliation of the projected SSNOI growth rate for Curbline and the estimated Annualized Adjusted NOI for Curbline and SITE Centers to the most directly comparable GAAP financial
measure is not provided because the Company is unable to provide such reconciliation without unreasonable effort due to the multiple components of the calculations which included budgeted annualized NOI and adjusted for expected parcel separations
and excluding all corporate level activity as noted above. Annualized Adjusted NOI and SSNOI are not, and not intended to be, presentations in accordance with GAAP. NOI information has its limitations as it excludes any capital expenditures
associated with the re-leasing of tenant space or as needed to operate the assets. NOI does not represent amounts available for dividends, capital replacement or expansion, debt service obligations or other commitments and uncertainties. Management
does not use NOI as an indicator of the Company’s cash obligations and funding requirements for future commitments, acquisitions or development activities. NOI does not represent cash generated from operating activities in accordance with
GAAP, and is not necessarily indicative of cash available to fund cash needs. NOI should not be considered as an alternative to net income computed in accordance with GAAP, as an indicator of operating performance or as an alternative to cash flow
as a measure of liquidity. Debt to Adjusted EBTIDA The Company uses the ratio Debt to Adjusted EBITDA (“Debt/Adjusted EBITDA”) as it believes it provides a meaningful metric as it relates to the Company’s ability to meet various
leverage tests for the corresponding periods. The components of Debt/Adjusted EBITDA include average net effective debt divided by adjusted EBITDA (trailing twelve months), as opposed to net income determined in accordance with GAAP. Adjusted EBITDA
is calculated as net income attributable to SITE before interest, income taxes, depreciation and amortization for the trailing twelve months and further adjusted to eliminate the impact of certain items that the Company does not consider indicative
of its ongoing performance. Net effective debt is calculated as the average of the Company’s consolidated debt outstanding excluding unamortized loan costs and fair market value adjustments, less cash and restricted cash as of the beginning of
the twelve- month period and the balance sheet date presented. The Company also calculates EBITDAre as net income attributable to SITE before interest, income taxes, depreciation and amortization, gains and losses from disposition of real estate
property and related investments, impairment charges on real estate property and related investments including reserve adjustments of preferred equity interests and gains and losses from changes in control. Such amount is calculated at the
Company’s proportionate share of ownership. Adjusted EBITDA should not be considered as an alternative to earnings as an indicator of the Company’s financial performance, or an alternative to cash flow from operating activities as a
measure of liquidity. The Company’s calculation of Adjusted EBITDA may differ from the methodology utilized by other companies. Investors are cautioned that items excluded from Adjusted EBITDA are significant components in understanding and
assessing the Company’s financial condition. The reconciliations of Adjusted EBITDA and net effective debt used in the consolidated and prorata Debt/Adjusted EBITDA ratio to their most directly comparable GAAP measures of net income and debt
are provided herein for the trailing twelve month period ending September 30, 2023. In reliance on the exception provided by Item 10(e)(1)(i)(B) of Regulation S-K, reconciliation of the estimated Debt/Adjusted EBITDA ratio for the three month period
ending December 31, 2023 for SITE Centers to the most directly comparable GAAP financial measure is not provided because the Company is unable to provide such reconciliation without unreasonable effort due to the multiple components of the
calculation. 40
NON-GAAP FINANCIAL MEASURES AND OTHER OPERATIONAL METRICS - DEFINITIONS
(CONTINUED ) Cash Lease Spreads Cash Leasing Spreads are calculated by comparing the prior tenant’s annual base rent in the final year of the prior lease to the executed tenant’s annual base rent in the first year of the executed lease.
Deals which are either new leases in first generation units or units vacant at the time of acquisition are considered non-comparable and excluded from the calculation. Net Effective Rents Net effective rents are calculated as a weighted average per
rentable square foot over the lease term with full consideration for all costs associated with leasing the space rather than pro rata costs. Landlord work represents property level improvements associated with the lease transactions; however, those
improvements are attributed to the landlord’s property value and typically extend the life of the asset in excess of the lease term. 41
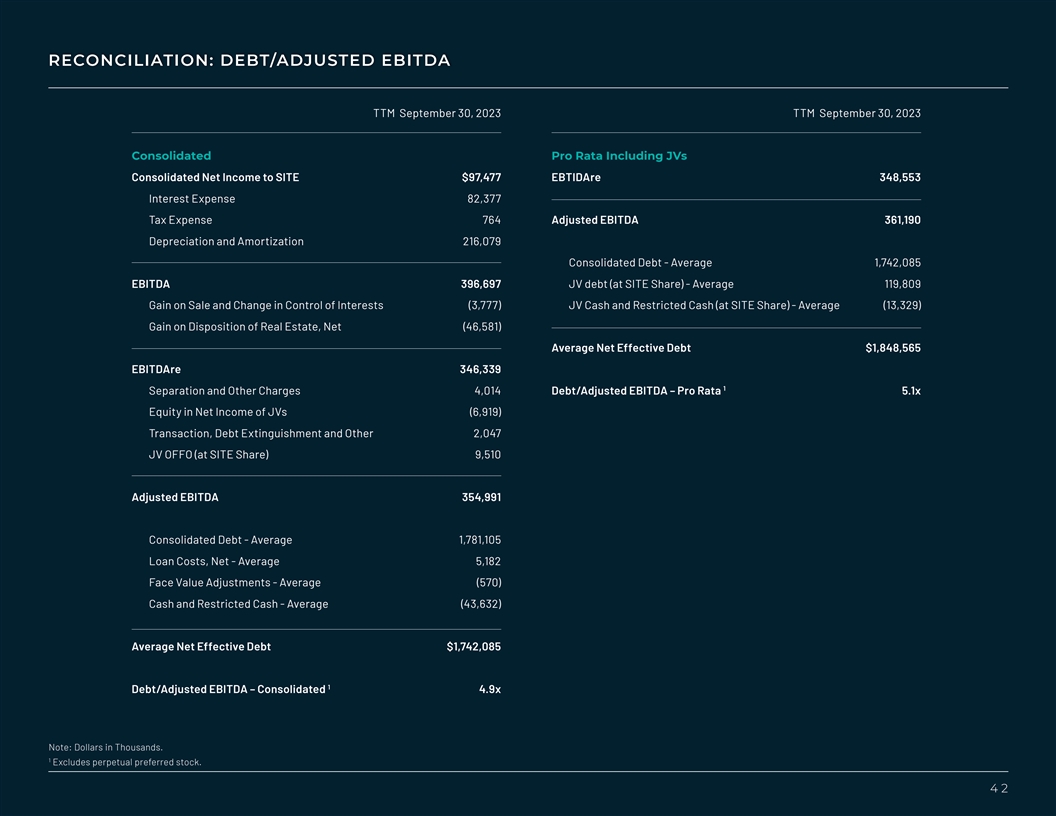
RECONCILIATION: DEBT/ADJUSTED EBITDA TTM September 30, 2023 TTM
September 30, 2023 Consolidated Pro Rata Including JVs Consolidated Net Income to SITE $97,477 EBTIDAre 348,553 Interest Expense 82,377 Tax Expense 764 Adjusted EBITDA 361,190 Depreciation and Amortization 216,079 Consolidated Debt - Average
1,742,085 EBITDA 396,697 JV debt (at SITE Share) - Average 119,809 Gain on Sale and Change in Control of Interests (3,777) JV Cash and Restricted Cash (at SITE Share) - Average (13,329) Gain on Disposition of Real Estate, Net (46,581) Average Net
Effective Debt $1,848,565 EBITDAre 346,339 1 Separation and Other Charges 4,014 Debt/Adjusted EBITDA – Pro Rata 5.1x Equity in Net Income of JVs (6,919) Transaction, Debt Extinguishment and Other 2,047 JV OFFO (at SITE Share) 9,510 Adjusted
EBITDA 354,991 Consolidated Debt - Average 1,781,105 Loan Costs, Net - Average 5,182 Face Value Adjustments - Average (570) Cash and Restricted Cash - Average (43,632) Average Net Effective Debt $1,742,085 1 Debt/Adjusted EBITDA – Consolidated
4.9x Note: Dollars in Thousands. 1 Excludes perpetual preferred stock. 42
v3.23.3
| X |
- DefinitionBoolean flag that is true when the XBRL content amends previously-filed or accepted submission.
| Name: |
dei_AmendmentFlag |
| Namespace Prefix: |
dei_ |
| Data Type: |
xbrli:booleanItemType |
| Balance Type: |
na |
| Period Type: |
duration |
|
| X |
- DefinitionFor the EDGAR submission types of Form 8-K: the date of the report, the date of the earliest event reported; for the EDGAR submission types of Form N-1A: the filing date; for all other submission types: the end of the reporting or transition period. The format of the date is YYYY-MM-DD.
| Name: |
dei_DocumentPeriodEndDate |
| Namespace Prefix: |
dei_ |
| Data Type: |
xbrli:dateItemType |
| Balance Type: |
na |
| Period Type: |
duration |
|
| X |
- DefinitionThe type of document being provided (such as 10-K, 10-Q, 485BPOS, etc). The document type is limited to the same value as the supporting SEC submission type, or the word 'Other'.
| Name: |
dei_DocumentType |
| Namespace Prefix: |
dei_ |
| Data Type: |
dei:submissionTypeItemType |
| Balance Type: |
na |
| Period Type: |
duration |
|
| X |
- DefinitionAddress Line 1 such as Attn, Building Name, Street Name
| Name: |
dei_EntityAddressAddressLine1 |
| Namespace Prefix: |
dei_ |
| Data Type: |
xbrli:normalizedStringItemType |
| Balance Type: |
na |
| Period Type: |
duration |
|
| X |
- Definition
+ References
+ Details
| Name: |
dei_EntityAddressCityOrTown |
| Namespace Prefix: |
dei_ |
| Data Type: |
xbrli:normalizedStringItemType |
| Balance Type: |
na |
| Period Type: |
duration |
|
| X |
- DefinitionCode for the postal or zip code
| Name: |
dei_EntityAddressPostalZipCode |
| Namespace Prefix: |
dei_ |
| Data Type: |
xbrli:normalizedStringItemType |
| Balance Type: |
na |
| Period Type: |
duration |
|
| X |
- DefinitionName of the state or province.
| Name: |
dei_EntityAddressStateOrProvince |
| Namespace Prefix: |
dei_ |
| Data Type: |
dei:stateOrProvinceItemType |
| Balance Type: |
na |
| Period Type: |
duration |
|
| X |
- DefinitionA unique 10-digit SEC-issued value to identify entities that have filed disclosures with the SEC. It is commonly abbreviated as CIK. Reference 1: http://www.xbrl.org/2003/role/presentationRef
-Publisher SEC
-Name Exchange Act
-Number 240
-Section 12
-Subsection b-2
| Name: |
dei_EntityCentralIndexKey |
| Namespace Prefix: |
dei_ |
| Data Type: |
dei:centralIndexKeyItemType |
| Balance Type: |
na |
| Period Type: |
duration |
|
| X |
- DefinitionIndicate if registrant meets the emerging growth company criteria. Reference 1: http://www.xbrl.org/2003/role/presentationRef
-Publisher SEC
-Name Exchange Act
-Number 240
-Section 12
-Subsection b-2
| Name: |
dei_EntityEmergingGrowthCompany |
| Namespace Prefix: |
dei_ |
| Data Type: |
xbrli:booleanItemType |
| Balance Type: |
na |
| Period Type: |
duration |
|
| X |
- DefinitionCommission file number. The field allows up to 17 characters. The prefix may contain 1-3 digits, the sequence number may contain 1-8 digits, the optional suffix may contain 1-4 characters, and the fields are separated with a hyphen.
| Name: |
dei_EntityFileNumber |
| Namespace Prefix: |
dei_ |
| Data Type: |
dei:fileNumberItemType |
| Balance Type: |
na |
| Period Type: |
duration |
|
| X |
- DefinitionTwo-character EDGAR code representing the state or country of incorporation.
| Name: |
dei_EntityIncorporationStateCountryCode |
| Namespace Prefix: |
dei_ |
| Data Type: |
dei:edgarStateCountryItemType |
| Balance Type: |
na |
| Period Type: |
duration |
|
| X |
- DefinitionThe exact name of the entity filing the report as specified in its charter, which is required by forms filed with the SEC. Reference 1: http://www.xbrl.org/2003/role/presentationRef
-Publisher SEC
-Name Exchange Act
-Number 240
-Section 12
-Subsection b-2
| Name: |
dei_EntityRegistrantName |
| Namespace Prefix: |
dei_ |
| Data Type: |
xbrli:normalizedStringItemType |
| Balance Type: |
na |
| Period Type: |
duration |
|
| X |
- DefinitionThe Tax Identification Number (TIN), also known as an Employer Identification Number (EIN), is a unique 9-digit value assigned by the IRS. Reference 1: http://www.xbrl.org/2003/role/presentationRef
-Publisher SEC
-Name Exchange Act
-Number 240
-Section 12
-Subsection b-2
| Name: |
dei_EntityTaxIdentificationNumber |
| Namespace Prefix: |
dei_ |
| Data Type: |
dei:employerIdItemType |
| Balance Type: |
na |
| Period Type: |
duration |
|
| X |
- DefinitionLocal phone number for entity.
| Name: |
dei_LocalPhoneNumber |
| Namespace Prefix: |
dei_ |
| Data Type: |
xbrli:normalizedStringItemType |
| Balance Type: |
na |
| Period Type: |
duration |
|
| X |
- DefinitionBoolean flag that is true when the Form 8-K filing is intended to satisfy the filing obligation of the registrant as pre-commencement communications pursuant to Rule 13e-4(c) under the Exchange Act. Reference 1: http://www.xbrl.org/2003/role/presentationRef
-Publisher SEC
-Name Exchange Act
-Number 240
-Section 13e
-Subsection 4c
| Name: |
dei_PreCommencementIssuerTenderOffer |
| Namespace Prefix: |
dei_ |
| Data Type: |
xbrli:booleanItemType |
| Balance Type: |
na |
| Period Type: |
duration |
|
| X |
- DefinitionBoolean flag that is true when the Form 8-K filing is intended to satisfy the filing obligation of the registrant as pre-commencement communications pursuant to Rule 14d-2(b) under the Exchange Act. Reference 1: http://www.xbrl.org/2003/role/presentationRef
-Publisher SEC
-Name Exchange Act
-Number 240
-Section 14d
-Subsection 2b
| Name: |
dei_PreCommencementTenderOffer |
| Namespace Prefix: |
dei_ |
| Data Type: |
xbrli:booleanItemType |
| Balance Type: |
na |
| Period Type: |
duration |
|
| X |
- DefinitionTitle of a 12(b) registered security. Reference 1: http://www.xbrl.org/2003/role/presentationRef
-Publisher SEC
-Name Exchange Act
-Number 240
-Section 12
-Subsection b
| Name: |
dei_Security12bTitle |
| Namespace Prefix: |
dei_ |
| Data Type: |
dei:securityTitleItemType |
| Balance Type: |
na |
| Period Type: |
duration |
|
| X |
- DefinitionName of the Exchange on which a security is registered. Reference 1: http://www.xbrl.org/2003/role/presentationRef
-Publisher SEC
-Name Exchange Act
-Number 240
-Section 12
-Subsection d1-1
| Name: |
dei_SecurityExchangeName |
| Namespace Prefix: |
dei_ |
| Data Type: |
dei:edgarExchangeCodeItemType |
| Balance Type: |
na |
| Period Type: |
duration |
|
| X |
- DefinitionBoolean flag that is true when the Form 8-K filing is intended to satisfy the filing obligation of the registrant as soliciting material pursuant to Rule 14a-12 under the Exchange Act. Reference 1: http://www.xbrl.org/2003/role/presentationRef
-Publisher SEC
-Name Exchange Act
-Section 14a
-Number 240
-Subsection 12
| Name: |
dei_SolicitingMaterial |
| Namespace Prefix: |
dei_ |
| Data Type: |
xbrli:booleanItemType |
| Balance Type: |
na |
| Period Type: |
duration |
|
| X |
- DefinitionTrading symbol of an instrument as listed on an exchange.
| Name: |
dei_TradingSymbol |
| Namespace Prefix: |
dei_ |
| Data Type: |
dei:tradingSymbolItemType |
| Balance Type: |
na |
| Period Type: |
duration |
|
| X |
- DefinitionBoolean flag that is true when the Form 8-K filing is intended to satisfy the filing obligation of the registrant as written communications pursuant to Rule 425 under the Securities Act. Reference 1: http://www.xbrl.org/2003/role/presentationRef
-Publisher SEC
-Name Securities Act
-Number 230
-Section 425
| Name: |
dei_WrittenCommunications |
| Namespace Prefix: |
dei_ |
| Data Type: |
xbrli:booleanItemType |
| Balance Type: |
na |
| Period Type: |
duration |
|
| X |
- Details
| Name: |
us-gaap_StatementClassOfStockAxis=us-gaap_CommonStockMember |
| Namespace Prefix: |
|
| Data Type: |
na |
| Balance Type: |
|
| Period Type: |
|
|
| X |
- Details
| Name: |
us-gaap_StatementClassOfStockAxis=sitc_ClassACumulativeRedeemablePreferredSharesMember |
| Namespace Prefix: |
|
| Data Type: |
na |
| Balance Type: |
|
| Period Type: |
|
|
SITE Centers (NYSE:SITC-A)
Historical Stock Chart
Von Apr 2024 bis Mai 2024

SITE Centers (NYSE:SITC-A)
Historical Stock Chart
Von Mai 2023 bis Mai 2024
