UNITED STATES
SECURITIES AND EXCHANGE COMMISSION
Washington, D.C. 20549
FORM
N-CSR
CERTIFIED SHAREHOLDER REPORT OF REGISTERED
MANAGEMENT INVESTMENT COMPANIES
|
|
|
| Investment Company Act file number |
|
811-23381 |
Nuveen Corporate Income 2023 Target Term Fund
(Exact name of registrant as
specified in charter)
Nuveen Investments
333 West Wacker Drive,
Chicago, IL
60606
(Address of principal
executive offices) (Zip code)
Mark L. Winget
Nuveen Investments
333 West Wacker
Drive,
Chicago, IL 60606
(Name and address of agent for service)
|
|
|
| Registrant’s telephone number, including area code: |
|
(312) 917-7700 |
|
|
|
| Date of fiscal year end: |
|
December 31 |
|
|
|
| Date of reporting period: |
|
June 30, 2023 |
Form N-CSR is to be used by management investment companies to file reports with the Commission not later than 10 days after
the transmission to stockholders of any report that is required to be transmitted to stockholders under Rule 30e-1 under the Investment Company Act of 1940 (17 CFR 270.30e-1). The Commission may use the information provided on Form N-CSR in its
regulatory, disclosure review, inspection, and policy making roles.
A registrant is required to disclose the information specified by Form N-CSR, and the
Commission will make this information public. A registrant is not required to respond to the collection of information contained in Form N-CSR unless the Form displays a currently valid Office of Management and Budget (“OMB”) control
number. Please direct comments concerning the accuracy of the information collection burden estimate and any suggestions for reducing the burden to Secretary, Securities and Exchange Commission, 450 Fifth Street, NW, Washington, DC 20549-0609. The
OMB has reviewed this collection of information under the clearance requirements of 44 U.S.C. ss.3507.
| ITEM 1. |
REPORTS TO STOCKHOLDERS. |

Closed-End Funds
June 30, 2023
Nuveen Closed-End Funds
This semi-annual report contains the Fund’s
unaudited financial statements.
|
|
|
| JHAA |
|
Nuveen Corporate Income 2023 Target Term Fund |
Semi-annual Report
Table of Contents
2
Chair’s Letter to Shareholders

Dear Shareholders,
The
significant measures taken by the U.S. Federal Reserve (Fed) and other global central banks since 2022 to contain inflation have begun to take effect. From March 2022 to July 2023, the Fed raised the target fed funds rate by 5.25% to a range of
5.25% to 5.50%. Even with a brief pause in June 2023, this has been one of the fastest interest rate hiking cycles in the Fed’s history. Inflation rates in the U.S. and across most of the world have fallen from their post-pandemic highs but
currently remain above the levels that central banks consider supportive of their economies’ long-term growth, particularly when looking at core inflation measures, which exclude volatile food and energy prices.
At the same time, the U.S. and other large economies have remained relatively resilient, even as financial conditions have tightened. U.S. gross domestic product
accelerated to 2.4% in the second quarter of 2023 from 2.0% in the first quarter of 2023, after growing 2.1% in 2022 overall compared to 2021. A relatively strong jobs market has helped support consumer sentiment and spending despite historically
high inflation. Markets are concerned that these conditions could keep upward pressure on prices and wages and continue to assess the impact of the collapse of three regional U.S. banks (Silicon Valley Bank, Signature Bank and First Republic Bank)
and major European bank Credit Suisse in March 2023.
Fed officials are closely monitoring inflation data and other economic measures to modify their rate setting
activity based upon these factors on a meeting-by-meeting basis, including pausing rate adjustments at the June 2023 meeting to assess the effects of monetary policy on
the economy. While uncertainty has increased given the unpredictable outcome of tighter credit conditions on the economy, the Fed remains committed to acting until it sees sustainable progress toward its inflation goals. Additionally, market
concerns surrounding the U.S. debt ceiling faded after the government agreed in June 2023 to suspend the nation’s borrowing limit until January 2025, averting a near-term default scenario. In the meantime, markets are likely to continue
reacting in the short term to news about inflation data, economic indicators and central bank policy. We encourage investors to keep a long-term perspective amid the short-term turbulence. Your financial professional can help you review how well
your portfolio is aligned with your time horizon, risk tolerance and investment goals.
On behalf of the other members of the Nuveen Fund Board, we look forward to
continuing to earn your trust in the months and years ahead.
Sincerely,

Terence J. Toth
Chair of the Board
August 22, 2023
3
Important Notices
For Shareholders of
Nuveen Corporate Income 2023 Target Term Fund
Portfolio Manager
Commentaries in Semi-annual Shareholder Reports
The Fund includes portfolio manager commentary in its annual shareholder reports. For the Fund’s most
recent annual portfolio manager discussion, please refer to the Portfolio Managers’ Comments section of the Fund’s December 31, 2022 annual shareholder report.
For current information on your Fund’s investment objectives, portfolio management team and average annual total returns please refer to the Fund’s website at
www.nuveen.com.
For changes that occurred to your Fund both during and subsequent to this reporting period, please refer to the Notes to Financial Statements
section of this report.
For average annual total returns as of the end of this reporting period, please refer to the Performance Overview and Holding Summaries
section within this report.
Upcoming Fund Liquidation and Termination
The Fund has entered the wind-up period in anticipation of its termination date on December 1, 2023. During the wind-up period the Fund may deviate from its investment objectives and policies, and may invest up to a 100% of its managed assets in high quality, short-term securities. High quality, short-term securities for this
Fund include securities rated investment grade (BBB-/Baa3 or higher or unrated but judged by the Fund’s sub-adviser to be of comparable quality) with a final or
remaining maturity of 397 days or less. Consequently, for the remainder of its term, the Fund will invest at least 80% of its managed assets in (i) corporate debt securities; and (ii) short-term investment grade securities that have a
final or remaining maturity of 397 days or less, so long as the maturity of any security in the Fund does not occur later than June 1, 2024. These expanded investment parameters currently will provide the Fund additional flexibility to reinvest
the proceeds of matured or called portfolio securities in higher quality, short-term securities. As the Fund gets closer to its termination date, the Fund will begin to affirmatively transition its remaining below investment grade portfolio holdings
to such high quality, short-term securities to enhance its ability to efficiently liquidate its portfolio at termination. The Fund has also completed the process of redeeming and retiring its leverage in anticipation of its termination date. The
Fund’s NAV ended the reporting period at $9.58 per share.
4
Fund Leverage
IMPACT OF THE FUND’S LEVERAGE STRATEGY ON PERFORMANCE
One important factor impacting the returns of the Fund’s common shares relative to its comparative benchmarks was the Fund’s use of leverage through the use of
bank borrowings. The Fund uses leverage because our research has shown that, over time, leveraging provides opportunities for additional income. The opportunity arises when short-term rates that the Fund pays on its leveraging instruments are lower
than the interest the Fund earns on its portfolio securities that it has bought with the proceeds of that leverage.
However, use of leverage can expose Fund common
shares to additional price volatility. When a Fund uses leverage, the Fund’s common shares will experience a greater increase in their net asset value if the securities acquired through the use of leverage increase in value, but will also
experience a correspondingly larger decline in their net asset value if the securities acquired through leverage decline in value. All this will make the shares’ total return performance more variable, over time.
In addition, common share income in levered funds will typically decrease in comparison to unlevered funds when short-term interest rates increase and increase when
short-term interest rates decrease. In recent quarters, fund leverage expenses have generally tracked the overall movement of short-term interest rates. While fund leverage expenses are higher than prior year lows, leverage nevertheless continues to
provide the opportunity for incremental common share income, particularly over longer-term periods.
JHAA fully de-levered during the reporting period. The
Fund’s use of leverage had a negligible impact on relative performance during the reporting period.
As of June 30, 2023, the Fund’s percentages of
leverage are shown in the accompanying table.
|
|
|
|
|
| |
|
JHAA |
|
| Effective Leverage* |
|
|
0.00 |
% |
| Regulatory Leverage* |
|
|
0.00 |
% |
| * |
Effective Leverage is a Fund’s effective economic leverage, and includes both regulatory leverage and the leverage
effects of reverse repurchase agreements, certain derivative and other investments in a Fund’s portfolio that increase the Fund’s investment exposure. Regulatory leverage consists of preferred shares issued or borrowings of a Fund. Both of
these are part of a Fund’s capital structure. A Fund, however, may from time to time borrow on a typically transient basis in connection with its day-to-day operations, primarily in connection with the need to settle portfolio trades. Such
incidental borrowings are excluded from the calculation of a Fund’s effective leverage ratio. Regulatory leverage is subject to asset coverage limits set forth in the Investment Company Act of 1940. |
5
Fund Leverage (continued)
THE FUND’S LEVERAGE
Bank Borrowings
As noted previously, JHAA employs leverage through the use of
bank borrowings. The Fund’s bank borrowing activities are as shown in the accompanying table.
|
|
|
|
|
|
|
|
|
|
|
|
|
|
|
|
|
|
|
|
|
|
|
|
|
|
|
|
|
|
|
|
|
|
|
|
|
| |
|
Current Reporting Period |
|
|
|
|
|
Subsequent to the Close of
the Reporting Period |
|
| Fund |
|
Outstanding
Balance as of
January 1, 2023 |
|
|
Draws |
|
|
Paydowns |
|
|
Outstanding
Balance as of
June 30, 2023 |
|
|
Average Balance
Outstanding |
|
|
|
|
|
Draws |
|
|
Paydowns |
|
|
Outstanding
Balance as of
August 22, 2023 |
|
| JHAA |
|
$ |
24,500,000 |
|
|
$ |
— |
|
|
$ |
(24,500,000 |
) |
|
$ |
— |
|
|
$ |
10,319,337 |
|
|
|
|
|
|
$ |
— |
|
|
$ |
— |
|
|
$ |
— |
|
Refer to Notes to Financial Statements for further details on bank borrowings for the Fund.
6
Common Share Information
COMMON SHARE DISTRIBUTION INFORMATION
The following information regarding the Fund’s distributions is current as of June 30, 2023. The Fund’s distribution levels may vary over time based on the
Fund’s investment activity and portfolio investment value changes.
During the current reporting period, the Fund’s distributions to common shareholders
were as shown in the accompanying table.
|
|
|
|
|
| Monthly Distributions (Ex-Dividend Date) |
|
|
|
| January |
|
$ |
0.0250 |
|
| February |
|
|
0.0250 |
|
| March |
|
|
0.0185 |
|
| April |
|
|
0.0185 |
|
| May |
|
|
0.0185 |
|
| June |
|
|
0.0185 |
|
| Total Distributions from Net Investment Income |
|
$ |
0.1240 |
|
|
|
| Current Distribution Rate* |
|
|
2.37 |
% |
| * |
Current distribution rate is based on the Fund’s current annualized monthly distribution divided by the Fund’s
current market price. The Fund’s monthly distributions to its shareholders may be comprised of ordinary income, net realized capital gains and, if at the end of the fiscal year the Fund’s cumulative net ordinary income and net realized
gains are less than the Fund’s distributions, a return of capital for tax purposes. |
The Fund seeks to pay regular monthly dividends out of
its net investment income at a rate that reflects its past and projected net income performance. To permit the Fund to maintain a more stable monthly dividend, the Fund may pay dividends at a rate that may be more or less than the amount of net
income actually earned by the Fund during the period. Distributions to common shareholders are determined on a tax basis, which may differ from amounts recorded in the accounting records. In instances where the monthly dividend exceeds the earned
net investment income, the Fund would report a negative undistributed net ordinary income. Refer to Notes to Financial Statements for additional information regarding the amounts of undistributed net ordinary income and undistributed net long-term
capital gains and the character of the actual distributions paid by the Fund during the period.
All monthly dividends paid by the Fund during the current reporting
period were paid from net investment income. If a portion of the Fund’s monthly distributions is sourced or comprised of elements other than net investment income, including capital gains and/or a return of capital, shareholders will be
notified of those sources. For financial reporting purposes, the per share amounts of each Fund’s distributions for the reporting period are presented in this report’s Financial Highlights. For income tax purposes, distribution information
for the Fund as of its most recent tax year end is presented in the Notes to Financial Statements of this report.
NUVEEN CLOSED-END FUND DISTRIBUTION AMOUNTS
The Nuveen Closed-End Funds’ monthly and quarterly periodic distributions to shareholders are posted on www.nuveen.com and can be found on Nuveen’s
enhanced closed-end fund resource page, which is at https://www.nuveen.com/resource-center-closed-end-funds, along with other Nuveen closed-end fund product updates. To ensure timely access to the latest information, shareholders may use a subscribe
function, which can be activated at this web page (https://www.nuveen.com/subscriptions).
7
Common Share Information (continued)
COMMON SHARE REPURCHASES
The Fund’s Board of Trustees authorized an open-market share repurchase program, allowing the Fund to repurchase and retire an aggregate of up to approximately 10%
of its outstanding shares.
As of June 30, 2023 (and since the inception of the Fund’s repurchase program), the Fund has cumulatively repurchased and retired
its outstanding common shares as shown in the accompanying table.
|
|
|
|
|
| |
|
JHAA |
|
| Common shares cumulatively repurchased and retired |
|
|
134,596 |
|
| Common shares authorized for repurchase |
|
|
780,000 |
|
During the current reporting period, the Fund repurchased and retired its common shares at a weighted average price per share and a
weighted average discount per share as shown in the following table.
|
|
|
|
|
| Common shares repurchased and retired |
|
|
66,296 |
|
| Weighted average price per common share repurchased and retired |
|
$ |
9.19 |
|
| Weighted average discount per common share repurchased and
retired |
|
|
3.30 |
% |
OTHER COMMON SHARE INFORMATION
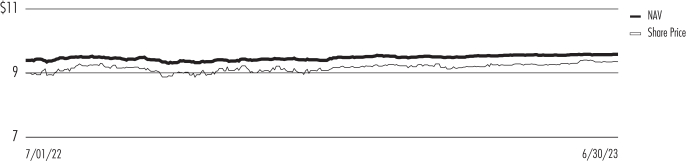
As of June 30,
2023, the Fund’s common share prices were trading at a premium/(discount) to their common share NAVs and trading at an average premium/(discount) to NAV during the current reporting period, as follows:
|
|
|
|
|
| Common share NAV |
|
$ |
9.58 |
|
| Common share price |
|
$ |
9.35 |
|
| Premium/(Discount) to NAV |
|
|
(2.40 |
)% |
| Average premium/(discount) to NAV |
|
|
(3.00 |
)% |
JHAA has an investment objective to return $9.875 (the original net asset value following the Fund’s initial public offering (the
“Original NAV”)) to shareholders on or about the end of the Fund’s term. There can be no assurance that the Fund will be able to return the Original NAV to shareholders, and such return is not backed or otherwise guaranteed by the
Fund’s investment adviser, Nuveen Fund Advisors, LLC (the “Adviser”), or any other entity.
In connection with the objective of returning Original
NAV, the Fund currently intends to set aside and retain in its net assets a portion of its net investment income and possibly all or a portion of its gains. This will reduce the amounts otherwise available for distribution prior to the liquidation
of the Fund, and the Fund may incur taxes on such retained amount, which will reduce the overall amounts that the Fund would have otherwise been able to distribute. Such retained income or gains, net of any taxes, would constitute a portion of the
liquidating distribution returned to investors at the end of the Fund’s term. In addition, the Fund’s investment in shorter term and lower yielding securities, especially as the Fund nears the end of its term, may reduce investment income
and, therefore, the monthly dividends during the period prior to termination. Investors that purchase shares in the secondary market (particularly if their purchase price differs meaningfully from the Original NAV) may receive more or less than
their original investment.
As noted above, the Fund’s objective to return Original NAV to common shareholders on or about the termination date is not a
guarantee and will depend on a number of factors, including market conditions and the success of various portfolio and cash flow management techniques such as the cumulative level of income retained in relation to cumulative portfolio gains net of
losses. Based on market conditions as of the date of this report, management anticipates that the Fund’s objective of returning the original $9.875 NAV on December 1, 2023 will not be met.
8
About the Fund’s Benchmarks
| ∎ |
|
Bloomberg U.S. Corporate High Yield 1-5 Year Cash Pay 2% Issuer Capped Bond Index: A maturity and issuer-constrained
version of the U.S. Corporate High Yield Bond Index, which is an index designed to measure the performance of USD-denominated, fixed-rate corporate high yield bonds with maturities of 1 to 4.99 years that limits each issue to 2% of the index. Index
returns assume reinvestment of distributions, but do not reflect any applicable sales charges or management fees. |
9
|
|
|
| JHAA |
|
Nuveen Corporate Income 2023 Target Term Fund
Performance Overview and Holding Summaries as of June 30, 2023 |
Refer to the Glossary of Terms Used in this Report for further definition of the terms used within
this section.
Average Annual Total Returns as of June 30, 2023*
|
|
|
|
|
|
|
|
|
|
|
|
|
| |
|
Cumulative |
|
|
Average Annual |
|
| |
|
6-Month |
|
|
1-Year |
|
|
Since
Inception |
|
| JHAA at Common Share NAV |
|
|
3.36% |
|
|
|
5.24% |
|
|
|
3.85% |
|
| JHAA at Common Share Price |
|
|
4.44% |
|
|
|
8.71% |
|
|
|
3.08% |
|
| Bloomberg U.S. Corporate High Yield 1-5 Year Cash Pay 2% Issuer Capped Bond Index |
|
|
5.00% |
|
|
|
9.34% |
|
|
|
3.86% |
|
| * |
For purposes of Fund performance, relative results are measured against the Bloomberg U.S. Corporate High Yield 1-5 Year
Cash Pay 2% Issuer Capped Bond Index. |
Since inception returns are from 12/18/18. Performance data shown represents past performance and does not
predict or guarantee future results. Current performance may be higher or lower than the data shown. Returns do not reflect the deduction of taxes that shareholders may have to pay on Fund distributions or upon the sale of Fund shares. Returns at
NAV are net of Fund expenses, and assume reinvestment of distributions. Comparative index return information is provided for the Fund’s shares at NAV only. Indexes are not available for direct investment.
Daily Common Share NAV and Share Price
10
This data relates to the securities held in the
Fund’s portfolio of investments as of the end of the reporting period. It should not be construed as a measure of performance for the Fund itself. Holdings are subject to change.
For financial reporting purposes, the ratings disclosed are the highest rating given by one of the following national rating agencies: Standard & Poor’s Group,
Moody’s Investors Service, Inc. or Fitch, Inc. This treatment of split-rated securities may differ from that used for other purposes, such as for Fund investment policies. Credit ratings are subject to change. AAA, AA, A and BBB are investment
grade ratings; BB, B, CCC, CC, C and D are below-investment grade ratings. Holdings designated N/R are not rated by these national rating agencies.
Fund Allocation
(% of net
assets)
|
|
|
|
|
| Corporate Bonds |
|
|
94.6% |
|
| Variable Rate Senior Loan Interests |
|
|
1.4% |
|
| Convertible Bonds |
|
|
0.9% |
|
| Repurchase Agreements |
|
|
1.2% |
|
| Other Assets & Liabilities, Net |
|
|
1.9% |
|
| Net Assets |
|
|
100% |
|
Country Allocation1
(% of total investments)
|
|
|
|
|
| United States |
|
|
88.0% |
|
| Canada |
|
|
5.4% |
|
| Israel |
|
|
3.8% |
|
| Mexico |
|
|
2.1% |
|
| Ireland |
|
|
0.7% |
|
| Total |
|
|
100% |
|
Portfolio Composition2
(% of total investments)
|
|
|
|
|
| Chemicals |
|
|
14.1% |
|
| Automobiles |
|
|
9.0% |
|
| Oil, Gas & Consumable Fuels |
|
|
8.0% |
|
| Consumer Finance |
|
|
6.3% |
|
| Containers & Packaging |
|
|
6.1% |
|
| Wireless Telecommunication Services |
|
|
5.9% |
|
| Electric Utilities |
|
|
4.8% |
|
| Biotechnology |
|
|
4.1% |
|
| Media |
|
|
4.1% |
|
| Pharmaceuticals |
|
|
3.8% |
|
| Hotels, Restaurants & Leisure |
|
|
3.8% |
|
| Commercial Services & Supplies |
|
|
3.0% |
|
| Household Durables |
|
|
2.8% |
|
| Specialized REITs |
|
|
2.8% |
|
| Independent Power And Renewable Electricity Producers |
|
|
2.7% |
|
| Other |
|
|
17.5% |
|
| Repurchase Agreements |
|
|
1.2% |
|
| Total |
|
|
100% |
|
Portfolio Credit Quality
(%
of total long-term investments)
|
|
|
|
|
| A |
|
|
3.6% |
|
| BBB |
|
|
52.1% |
|
| BB or Lower |
|
|
44.3% |
|
| Total |
|
|
100% |
|
Top Five Issuers
(% of total long-term
investments)
|
|
|
|
|
| Sprint LLC |
|
|
6.0% |
|
| Celanese US Holdings LLC |
|
|
6.0% |
|
| NOVA Chemicals Corp |
|
|
5.5% |
|
| Ball Corp |
|
|
4.2% |
|
| Yum! Brands Inc |
|
|
3.8% |
|
| 1 |
Includes 2.1% (as a percentage of total investments) in emerging markets countries. |
| 2 |
See the Portfolio of Investments for the industries/sectors comprising “Other” and not listed in the table
above. |
11
Shareholder Meeting Report
The annual meeting of shareholders was held on May 8, 2023 for JHAA; at this meeting the
shareholders were asked to elect Board members.
|
|
|
|
|
| |
|
JHAA |
|
| |
|
Common
Shares |
|
| Approval of the Board Members was reached as follows: |
|
|
|
|
| Amy B.R. Lancellotta |
|
|
|
|
| For |
|
|
5,538,715 |
|
| Withhold |
|
|
196,015 |
|
| Total |
|
|
5,734,730 |
|
| John K. Nelson |
|
|
|
|
| For |
|
|
5,551,124 |
|
| Withhold |
|
|
183,606 |
|
| Total |
|
|
5,734,730 |
|
| Terence J. Toth |
|
|
|
|
| For |
|
|
5,551,124 |
|
| Withhold |
|
|
183,606 |
|
| Total |
|
|
5,734,730 |
|
| Robert L. Young |
|
|
|
|
| For |
|
|
5,551,124 |
|
| Withhold |
|
|
183,606 |
|
| Total |
|
|
5,734,730 |
|
12
|
|
|
| JHAA |
|
Nuveen Corporate Income 2023
Target Term Fund
Portfolio of Investments June 30, 2023 |
| |
|
(Unaudited) |
|
|
|
|
|
|
|
|
|
|
|
|
|
|
|
|
|
|
|
|
|
|
|
|
|
Principal
Amount (000) |
|
|
Description (1) |
|
|
|
|
|
Coupon |
|
|
Maturity |
|
|
Ratings (2) |
|
|
Value |
|
|
|
|
|
|
|
LONG-TERM INVESTMENTS – 96.9% (98.8% of Total Investments) |
|
|
|
|
|
|
|
|
CORPORATE BONDS – 94.6% (96.4% of Total Investments) |
|
|
|
|
|
|
|
| |
|
|
Automobiles – 8.8% |
|
|
|
|
|
|
|
| $ |
2,000 |
|
|
Ford Motor Credit Co LLC |
|
|
3.370% |
|
|
|
11/17/23 |
|
|
|
BB+ |
|
|
$ |
1,979,498 |
|
| |
2,550 |
|
|
Ford Motor Credit Co LLC |
|
|
5.584% |
|
|
|
3/18/24 |
|
|
|
BB+ |
|
|
|
2,532,013 |
|
| |
2,000 |
|
|
General Motors Financial Co Inc |
|
|
5.100% |
|
|
|
1/17/24 |
|
|
|
BBB |
|
|
|
1,992,670 |
|
|
|
|
|
Total Automobiles |
|
|
|
|
|
|
|
|
|
|
|
|
|
|
6,504,181 |
|
|
|
|
|
|
|
| |
|
|
Biotechnology – 4.2% |
|
|
|
|
|
|
|
|
|
|
|
|
|
|
|
|
|
|
| |
1,600 |
|
|
Gilead Sciences Inc |
|
|
0.750% |
|
|
|
9/29/23 |
|
|
|
A3 |
|
|
|
1,581,943 |
|
| |
1,500 |
|
|
Shire Acquisitions Investments Ireland DAC |
|
|
2.875% |
|
|
|
9/23/23 |
|
|
|
BBB+ |
|
|
|
1,490,092 |
|
|
|
|
|
Total Biotechnology |
|
|
|
|
|
|
|
|
|
|
|
|
|
|
3,072,035 |
|
|
|
|
|
|
|
| |
|
|
Chemicals – 13.8% |
|
|
|
|
|
|
|
|
|
|
|
|
|
|
|
|
|
|
| |
4,378 |
|
|
Celanese US Holdings LLC |
|
|
3.500% |
|
|
|
5/08/24 |
|
|
|
BBB- |
|
|
|
4,284,560 |
|
| |
2,000 |
|
|
Mosaic Co/The |
|
|
4.250% |
|
|
|
11/15/23 |
|
|
|
BBB |
|
|
|
1,987,873 |
|
| |
4,025 |
|
|
NOVA Chemicals Corp, 144A |
|
|
4.875% |
|
|
|
6/01/24 |
|
|
|
BB |
|
|
|
3,932,344 |
|
|
|
|
|
Total Chemicals |
|
|
|
|
|
|
|
|
|
|
|
|
|
|
10,204,777 |
|
|
|
|
|
|
|
| |
|
|
Commercial Services & Supplies – 3.0% |
|
|
|
|
|
|
|
|
|
|
|
|
|
|
|
|
|
|
| |
2,200 |
|
|
Prime Security Services Borrower LLC / Prime Finance
Inc, 144A |
|
|
5.250% |
|
|
|
4/15/24 |
|
|
|
BB |
|
|
|
2,181,855 |
|
|
|
|
|
Total Commercial Services & Supplies |
|
|
|
|
|
|
|
|
|
|
|
|
|
|
2,181,855 |
|
|
|
|
|
|
|
| |
|
|
Consumer Finance – 6.2% |
|
|
|
|
|
|
|
|
|
|
|
|
|
|
|
|
|
|
| |
1,250 |
|
|
Navient Corp |
|
|
6.125% |
|
|
|
3/25/24 |
|
|
|
Ba3 |
|
|
|
1,240,221 |
|
| |
780 |
|
|
Navient Corp |
|
|
7.250% |
|
|
|
9/25/23 |
|
|
|
Ba3 |
|
|
|
780,000 |
|
| |
1,300 |
|
|
OneMain Finance Corp |
|
|
8.250% |
|
|
|
10/01/23 |
|
|
|
BB |
|
|
|
1,304,875 |
|
| |
1,250 |
|
|
OneMain Finance Corp |
|
|
6.125% |
|
|
|
3/15/24 |
|
|
|
BB |
|
|
|
1,245,736 |
|
|
|
|
|
Total Consumer Finance |
|
|
|
|
|
|
|
|
|
|
|
|
|
|
4,570,832 |
|
|
|
|
|
|
|
| |
|
|
Consumer Staples Distribution & Retail – 2.0% |
|
|
|
|
|
|
|
|
|
|
|
|
|
|
|
|
|
|
| |
1,500 |
|
|
Kroger Co/The |
|
|
4.000% |
|
|
|
2/01/24 |
|
|
|
Baa1 |
|
|
|
1,486,232 |
|
|
|
|
|
Total Consumer Staples Distribution &
Retail |
|
|
|
|
|
|
|
|
|
|
|
|
|
|
1,486,232 |
|
|
|
|
|
|
|
| |
|
|
Containers & Packaging – 6.0% |
|
|
|
|
|
|
|
|
|
|
|
|
|
|
|
|
|
|
| |
3,000 |
|
|
Ball Corp |
|
|
4.000% |
|
|
|
11/15/23 |
|
|
|
BB+ |
|
|
|
2,977,500 |
|
| |
1,000 |
|
|
Berry Global Inc |
|
|
0.950% |
|
|
|
2/15/24 |
|
|
|
BBB- |
|
|
|
961,300 |
|
| |
500 |
|
|
Graphic Packaging International LLC, 144A |
|
|
0.821% |
|
|
|
4/15/24 |
|
|
|
BBB- |
|
|
|
479,749 |
|
|
|
|
|
Total Containers & Packaging |
|
|
|
|
|
|
|
|
|
|
|
|
|
|
4,418,549 |
|
|
|
|
|
|
|
| |
|
|
Diversified REITs – 2.4% |
|
|
|
|
|
|
|
|
|
|
|
|
|
|
|
|
|
|
| |
1,750 |
|
|
Starwood Property Trust Inc, 144A |
|
|
5.500% |
|
|
|
11/01/23 |
|
|
|
BB+ |
|
|
|
1,734,879 |
|
|
|
|
|
Total Diversified Reits |
|
|
|
|
|
|
|
|
|
|
|
|
|
|
1,734,879 |
|
|
|
|
|
|
|
| |
|
|
Electric Utilities – 4.7% |
|
|
|
|
|
|
|
|
|
|
|
|
|
|
|
|
|
|
| |
1,000 |
|
|
Georgia Power Co |
|
|
2.100% |
|
|
|
7/30/23 |
|
|
|
BBB+ |
|
|
|
997,151 |
|
| |
1,000 |
|
|
NextEra Energy Capital Holdings Inc |
|
|
2.940% |
|
|
|
3/21/24 |
|
|
|
A- |
|
|
|
981,075 |
|
| |
1,500 |
|
|
Pacific Gas and Electric Co |
|
|
1.700% |
|
|
|
11/15/23 |
|
|
|
BBB |
|
|
|
1,474,230 |
|
|
|
|
|
Total Electric Utilities |
|
|
|
|
|
|
|
|
|
|
|
|
|
|
3,452,456 |
|
13
|
|
|
|
|
| JHAA |
|
Nuveen Corporate Income 2023 Target Term Fund (continued) |
| |
Portfolio of Investments June 30, 2023 |
|
|
(Unaudited) |
|
|
|
|
|
|
|
|
|
|
|
|
|
|
|
|
|
|
|
|
|
|
|
|
|
Principal
Amount (000) |
|
|
Description (1) |
|
|
|
|
|
Coupon |
|
|
Maturity |
|
|
Ratings (2) |
|
|
Value |
|
|
|
|
|
|
|
| |
|
|
Financial Services – 0.5% |
|
|
|
|
|
|
|
|
|
|
|
|
|
|
|
|
|
|
| $ |
350 |
|
|
Park Aerospace Holdings Ltd, 144A |
|
|
5.500% |
|
|
|
2/15/24 |
|
|
|
BBB- |
|
|
$ |
346,013 |
|
|
|
|
|
Total Financial Services |
|
|
|
|
|
|
|
|
|
|
|
|
|
|
346,013 |
|
|
|
|
|
|
|
| |
|
|
Health Care Equipment & Supplies – 2.0% |
|
|
|
|
|
|
|
|
|
|
|
|
|
|
|
|
|
|
| |
1,500 |
|
|
Baxter International Inc |
|
|
0.868% |
|
|
|
12/01/23 |
|
|
|
BBB |
|
|
|
1,468,700 |
|
|
|
|
|
Total Health Care Equipment & Supplies |
|
|
|
|
|
|
|
|
|
|
|
|
|
|
1,468,700 |
|
|
|
|
|
|
|
| |
|
|
Health Care Providers & Services – 1.4% |
|
|
|
|
|
|
|
|
|
|
|
|
|
|
|
|
|
|
| |
1,000 |
|
|
HCA Inc |
|
|
5.000% |
|
|
|
3/15/24 |
|
|
|
BBB- |
|
|
|
993,577 |
|
|
|
|
|
Total Health Care Providers & Services |
|
|
|
|
|
|
|
|
|
|
|
|
|
|
993,577 |
|
|
|
|
|
|
|
| |
|
|
Hotels, Restaurants & Leisure – 3.7% |
|
|
|
|
|
|
|
|
|
|
|
|
|
|
|
|
|
|
| |
2,750 |
|
|
Yum! Brands Inc |
|
|
3.875% |
|
|
|
11/01/23 |
|
|
|
BB |
|
|
|
2,726,090 |
|
|
|
|
|
Total Hotels, Restaurants & Leisure |
|
|
|
|
|
|
|
|
|
|
|
|
|
|
2,726,090 |
|
|
|
|
|
|
|
| |
|
|
Household Durables – 2.7% |
|
|
|
|
|
|
|
|
|
|
|
|
|
|
|
|
|
|
| |
2,035 |
|
|
Taylor Morrison Communities Inc / Taylor Morrison
Holdings II Inc, 144A |
|
|
5.625% |
|
|
|
3/01/24 |
|
|
|
BB |
|
|
|
2,019,738 |
|
|
|
|
|
Total Household Durables |
|
|
|
|
|
|
|
|
|
|
|
|
|
|
2,019,738 |
|
|
|
|
|
|
|
| |
|
|
Independent Power And Renewable Electricity Producers – 2.7% |
|
|
|
|
|
|
|
|
|
|
|
|
|
|
|
|
|
|
| |
2,000 |
|
|
Vistra Operations Co LLC, 144A |
|
|
4.875% |
|
|
|
5/13/24 |
|
|
|
BBB- |
|
|
|
1,960,768 |
|
|
|
|
|
Total Independent Power And Renewable Electricity
Producers |
|
|
|
|
|
|
|
|
|
|
|
|
|
|
1,960,768 |
|
|
|
|
|
|
|
| |
|
|
Media – 3.7% |
|
|
|
|
|
|
|
|
|
|
|
|
|
|
|
|
|
|
| |
340 |
|
|
AMC Networks Inc |
|
|
5.000% |
|
|
|
4/01/24 |
|
|
|
BB- |
|
|
|
334,734 |
|
| |
1,750 |
|
|
CSC Holdings LLC |
|
|
5.250% |
|
|
|
6/01/24 |
|
|
|
CCC+ |
|
|
|
1,627,574 |
|
| |
750 |
|
|
Warnermedia Holdings Inc |
|
|
3.528% |
|
|
|
3/15/24 |
|
|
|
BBB- |
|
|
|
736,371 |
|
|
|
|
|
Total Media |
|
|
|
|
|
|
|
|
|
|
|
|
|
|
2,698,679 |
|
|
|
|
|
|
|
| |
|
|
Multi-Utilities – 1.8% |
|
|
|
|
|
|
|
|
|
|
|
|
|
|
|
|
|
|
| |
1,341 |
|
|
Public Service Enterprise Group Inc |
|
|
0.841% |
|
|
|
11/08/23 |
|
|
|
BBB |
|
|
|
1,317,438 |
|
|
|
|
|
Total Multi-Utilities |
|
|
|
|
|
|
|
|
|
|
|
|
|
|
1,317,438 |
|
|
|
|
|
|
|
| |
|
|
Oil, Gas & Consumable Fuels – 7.8% |
|
|
|
|
|
|
|
|
|
|
|
|
|
|
|
|
|
|
| |
550 |
|
|
Buckeye Partners LP |
|
|
4.150% |
|
|
|
7/01/23 |
|
|
|
BB |
|
|
|
550,000 |
|
| |
1,000 |
|
|
Continental Resources Inc/OK |
|
|
3.800% |
|
|
|
6/01/24 |
|
|
|
BBB |
|
|
|
980,202 |
|
| |
794 |
|
|
Energean Israel Finance Ltd, 144A , Reg S |
|
|
4.500% |
|
|
|
3/30/24 |
|
|
|
BB- |
|
|
|
784,472 |
|
| |
250 |
|
|
Energy Transfer LP |
|
|
5.875% |
|
|
|
1/15/24 |
|
|
|
BBB- |
|
|
|
250,042 |
|
| |
1,000 |
|
|
Energy Transfer LP / Regency Energy Finance Corp |
|
|
4.500% |
|
|
|
11/01/23 |
|
|
|
BBB- |
|
|
|
995,928 |
|
| |
500 |
|
|
Kinder Morgan Inc, 144A |
|
|
5.625% |
|
|
|
11/15/23 |
|
|
|
BBB- |
|
|
|
499,698 |
|
| |
1,000 |
|
|
Petroleos Mexicanos |
|
|
4.875% |
|
|
|
1/18/24 |
|
|
|
BBB |
|
|
|
982,756 |
|
| |
500 |
|
|
Petroleos Mexicanos |
|
|
4.625% |
|
|
|
9/21/23 |
|
|
|
BBB |
|
|
|
495,325 |
|
| |
221 |
|
|
Sabine Pass Liquefaction LLC |
|
|
5.750% |
|
|
|
5/15/24 |
|
|
|
BBB+ |
|
|
|
220,620 |
|
|
|
|
|
Total Oil, Gas & Consumable Fuels |
|
|
|
|
|
|
|
|
|
|
|
|
|
|
5,759,043 |
|
|
|
|
|
|
|
| |
|
|
Passenger Airlines – 1.3% |
|
|
|
|
|
|
|
|
|
|
|
|
|
|
|
|
|
|
| |
1,000 |
|
|
United Airlines Holdings Inc |
|
|
5.000% |
|
|
|
2/01/24 |
|
|
|
BB- |
|
|
|
990,009 |
|
|
|
|
|
Total Passenger Airlines |
|
|
|
|
|
|
|
|
|
|
|
|
|
|
990,009 |
|
|
|
|
|
|
|
| |
|
|
Pharmaceuticals – 3.7% |
|
|
|
|
|
|
|
|
|
|
|
|
|
|
|
|
|
|
| |
750 |
|
|
Mylan Inc |
|
|
4.200% |
|
|
|
11/29/23 |
|
|
|
BBB |
|
|
|
744,701 |
|
| |
2,000 |
|
|
Teva Pharmaceutical Finance Netherlands III
BV |
|
|
6.000% |
|
|
|
4/15/24 |
|
|
|
Ba2 |
|
|
|
1,986,975 |
|
|
|
|
|
Total Pharmaceuticals |
|
|
|
|
|
|
|
|
|
|
|
|
|
|
2,731,676 |
|
|
|
|
|
|
|
| |
|
|
Semiconductors & Semiconductor Equipment – 1.0% |
|
|
|
|
|
|
|
|
|
|
|
|
|
|
|
|
|
|
| |
750 |
|
|
Broadcom Corp / Broadcom Cayman Finance Ltd |
|
|
3.625% |
|
|
|
1/15/24 |
|
|
|
Baa2 |
|
|
|
741,088 |
|
|
|
|
|
Total Semiconductors & Semiconductor
Equipment |
|
|
|
|
|
|
|
|
|
|
|
|
|
|
741,088 |
|
14
|
|
|
|
|
|
|
|
|
|
|
|
|
|
|
|
|
|
|
|
|
|
|
|
|
|
|
|
|
Principal
Amount (000) |
|
|
Description (1) |
|
|
|
|
|
|
|
Coupon |
|
|
Maturity |
|
|
Ratings (2) |
|
|
Value |
|
|
|
|
|
|
|
| |
|
|
Software – 2.0% |
|
|
|
|
|
|
|
|
|
|
|
|
|
|
|
|
|
|
|
| $ |
1,500 |
|
|
Roper Technologies Inc |
|
|
|
3.650% |
|
|
|
9/15/23 |
|
|
|
BBB+ |
|
|
$ |
1,493,393 |
|
|
|
|
|
Total Software |
|
|
|
|
|
|
|
|
|
|
|
|
|
|
|
1,493,393 |
|
|
|
|
|
|
|
| |
|
|
Specialized REITs – 2.7% |
|
|
|
|
|
|
|
|
|
|
|
|
|
|
|
|
|
|
|
| |
1,000 |
|
|
American Tower Corp |
|
|
|
5.000% |
|
|
|
2/15/24 |
|
|
|
BBB+ |
|
|
|
994,147 |
|
| |
1,000 |
|
|
Crown Castle Inc |
|
|
|
3.150% |
|
|
|
7/15/23 |
|
|
|
BBB+ |
|
|
|
998,775 |
|
|
|
|
|
Total Specialized Reits |
|
|
|
|
|
|
|
|
|
|
|
|
|
|
|
1,992,922 |
|
|
|
|
|
|
|
| |
|
|
Trading Companies & Distributors – 0.7% |
|
|
|
|
|
|
|
|
|
|
|
|
|
|
|
|
|
|
|
| |
150 |
|
|
AerCap Ireland Capital DAC / AerCap Global Aviation Trust |
|
|
|
4.500% |
|
|
|
9/15/23 |
|
|
|
BBB |
|
|
|
149,437 |
|
| |
400 |
|
|
Aircastle Ltd |
|
|
|
4.400% |
|
|
|
9/25/23 |
|
|
|
BBB |
|
|
|
397,958 |
|
|
|
|
|
Total Trading Companies & Distributors |
|
|
|
|
|
|
|
|
|
|
|
|
|
|
|
547,395 |
|
|
|
|
|
|
|
| |
|
|
Wireless Telecommunication Services – 5.8% |
|
|
|
|
|
|
|
|
|
|
|
|
|
|
|
|
|
|
|
| |
4,275 |
|
|
Sprint LLC |
|
|
|
7.875% |
|
|
|
9/15/23 |
|
|
|
Baa2 |
|
|
|
4,285,324 |
|
|
|
|
|
Total Wireless Telecommunication Services |
|
|
|
|
|
|
|
|
|
|
|
|
|
|
|
4,285,324 |
|
|
|
|
|
Total Corporate Bonds
(cost $70,363,716) |
|
|
|
|
|
|
|
|
|
|
|
|
|
|
|
69,697,649 |
|
|
|
|
|
|
|
|
|
Principal
Amount (000) |
|
|
Description (1) |
|
Coupon (3) |
|
|
Reference
Rate (3) |
|
|
Spread (3) |
|
|
Maturity(4) |
|
|
Ratings (2) |
|
|
Value |
|
|
|
|
|
|
|
|
VARIABLE RATE SENIOR LOAN INTERESTS – 1.4% (1.4% of Total Investments)
(3) |
|
|
|
|
|
|
|
| |
|
|
Entertainment – 0.9% |
|
|
|
|
|
|
|
|
|
| $ |
632 |
|
|
Univision Communications Inc., Term Loan C5 |
|
|
7.943% |
|
|
|
1-Month LIBOR |
|
|
|
2.750% |
|
|
|
3/15/24 |
|
|
|
B+ |
|
|
$ |
633,623 |
|
|
|
|
|
Total Entertainment |
|
|
|
|
|
|
|
|
|
|
|
|
|
|
|
633,623 |
|
|
|
| |
|
|
Media – 0.4% |
|
|
|
|
|
|
|
|
|
| |
295 |
|
|
Nexstar Broadcasting, Inc., Term Loan B4 |
|
|
7.717% |
|
|
|
SOFR30A |
|
|
|
2.500% |
|
|
|
9/18/26 |
|
|
|
BBB- |
|
|
|
295,270 |
|
|
|
|
|
Total Media |
|
|
|
|
|
|
|
|
|
|
|
|
|
|
|
295,270 |
|
|
|
| |
|
|
Semiconductors & Semiconductor Equipment – 0.1% |
|
|
|
|
|
|
|
|
|
| |
107 |
|
|
MACOM Technology Solutions Holdings, Inc., Term Loan |
|
|
7.443% |
|
|
|
1-Month LIBOR |
|
|
|
2.250% |
|
|
|
5/19/24 |
|
|
|
Ba1 |
|
|
|
106,939 |
|
|
|
|
|
Total Semiconductors & Semiconductor
Equipment |
|
|
|
|
|
|
|
|
|
|
|
|
|
|
|
106,939 |
|
|
|
|
|
Total Variable Rate Senior Loan Interests
(cost $1,015,843) |
|
|
|
|
|
|
|
|
|
|
|
|
|
|
|
1,035,832 |
|
|
|
|
|
|
|
|
|
Principal
Amount (000) |
|
|
Description (1) |
|
|
|
|
|
|
|
Coupon |
|
|
Maturity |
|
|
Ratings (2) |
|
|
Value |
|
|
|
|
|
|
|
|
CONVERTIBLE BONDS – 0.9% (1.0% of Total Investments) |
|
|
|
|
|
|
|
| |
|
|
Computers & Peripherals – 0.9% |
|
|
|
|
|
|
|
| $ |
700 |
|
|
Western Digital Corp |
|
|
|
1.500% |
|
|
|
2/01/24 |
|
|
|
Baa3 |
|
|
$ |
678,650 |
|
|
|
|
|
Total Computers & Peripherals |
|
|
|
|
|
|
|
|
|
|
|
|
|
|
|
678,650 |
|
|
|
|
|
Total Convertible Bonds
(cost $700,416) |
|
|
|
|
|
|
|
|
|
|
|
|
|
|
|
678,650 |
|
|
|
|
|
Total Long-Term Investments
(cost $72,079,975) |
|
|
|
|
|
|
|
|
|
|
|
71,412,131 |
|
15
|
|
|
|
|
| JHAA |
|
Nuveen Corporate Income 2023 Target Term Fund (continued) |
| |
Portfolio of Investments June 30, 2023 |
|
|
(Unaudited) |
|
|
|
|
|
|
|
|
|
|
|
|
|
|
|
|
|
|
|
|
|
|
|
|
|
Principal
Amount (000) |
|
|
Description (1) |
|
|
|
|
|
Coupon |
|
|
Maturity |
|
|
|
|
|
Value |
|
|
|
| |
|
|
SHORT-TERM INVESTMENTS – 1.2%(1.2% of Total Investments) |
|
|
|
|
| |
|
|
REPURCHASE AGREEMENTS – 1.2% (1.2% of Total Investments) |
|
|
|
|
|
|
|
|
|
|
| $ |
880 |
|
|
Repurchase Agreement with Fixed Income Clearing
Corporation,
dated 6/30/23, repurchase price $880,367,
collateralized by $910,200, U.S. Treasury Notes,
3.625%, due 3/31/30, value $897,675 |
|
|
5.010% |
|
|
|
7/03/23 |
|
|
|
|
|
|
$ |
880,000 |
|
|
|
|
|
Total Short-Term Investments
(cost $880,000) |
|
|
|
|
|
|
|
|
|
|
|
|
|
|
880,000 |
|
|
|
|
|
Total Investments
(cost $72,959,975) – 98.1% |
|
|
|
|
|
|
|
|
|
|
|
|
|
|
72,292,131 |
|
|
|
|
|
Other Assets & Liabilities, Net –
1.9% |
|
|
|
|
|
|
|
|
|
|
|
|
|
|
1,412,779 |
|
|
|
|
|
Net Assets Applicable to Common Shares –
100% |
|
|
|
|
|
|
|
|
|
|
|
|
|
$ |
73,704,910 |
|
For Fund portfolio compliance purposes, the
Fund’s industry classifications refer to any one or more of the industry sub-classifications used by one or more widely recognized market indexes or ratings group indexes, and/or as defined by Fund management. This definition may not apply for
purposes of this report, which may combine industry sub-classifications into sectors for reporting ease.
| (1) |
All percentages shown in the Portfolio of Investments are based on net assets applicable to common shares unless otherwise
noted. |
| (2) |
For financial reporting purposes, the ratings disclosed are the highest of Standard & Poor’s Group
(“Standard & Poor’s”), Moody’s Investors Service, Inc. (“Moody’s”) or Fitch, Inc. (“Fitch”) rating. This treatment of split-rated securities may differ from that used for other purposes, such as
for Fund investment policies. Ratings below BBB by Standard & Poor’s, Baa by Moody’s or BBB by Fitch are considered to be below investment grade. Holdings designated N/R are not rated by any of these national rating agencies.
|
| (3) |
Senior loans generally pay interest at rates which are periodically adjusted by reference to a base short-term, floating
lending rate (Reference Rate) plus an assigned fixed rate (Spread). These floating lending rates are generally (i) the lending rate referenced by the London Inter-Bank Offered Rate (“LIBOR”), or (ii) the prime rate offered by one
or more major United States banks. Senior loans may be considered restricted in that the Fund ordinarily is contractually obligated to receive approval from the agent bank and/or borrower prior to the disposition of a senior loan. The rate shown is
the coupon as of the end of the reporting period. |
| (4) |
Senior loans generally are subject to mandatory and/or optional prepayment. Because of these mandatory prepayment
conditions and because there may be significant economic incentives for a borrower to prepay, prepayments of senior loans may occur. As a result, the actual remaining maturity of senior loans held may be substantially less than the stated maturities
shown. |
| 144A |
Investment is exempt from registration under Rule 144A of the Securities Act of 1933, as amended. These investments may
only be resold in transactions exempt from registration, which are normally those transactions with qualified institutional buyers. |
| LIBOR |
London Inter-Bank Offered Rate |
| Reg S |
Regulation S allows U.S. companies to sell securities to persons or entities located outside of the United States without
registering those securities with the Securities and Exchange Commission. Specifically, Regulation S provides a safe harbor from the registration requirements of the Securities Act for the offers and sales of securities by both foreign and domestic
issuers that are made outside the United States. |
| REIT |
Real Estate Investment Trust |
| SOFR 30A |
30 Day Average Secured Overnight Financing Rate |
See accompanying notes to financial statements.
16
Statement of Assets and Liabilities
|
|
|
|
|
| June 30, 2023 (Unaudited) |
|
JHAA |
|
| ASSETS |
|
|
|
|
| Long-term investments, at value
† |
|
$ |
71,412,131 |
|
| Short-term investments, at value ◇ |
|
|
880,000 |
|
| Cash |
|
|
82,595 |
|
| Receivable for: |
|
|
|
|
| Interest |
|
|
785,594 |
|
| Investment sold |
|
|
808,994 |
|
| Other assets |
|
|
4,795 |
|
| Total assets |
|
|
73,974,109 |
|
| LIABILITIES |
|
|
|
|
| Payable for: |
|
|
|
|
| Dividends |
|
|
140,582 |
|
| Interest |
|
|
7,727 |
|
| Investments purchased—regular settlement |
|
|
22,466 |
|
| Accrued expenses: |
|
|
|
|
| Custodian fees |
|
|
20,580 |
|
| Investor relations |
|
|
458 |
|
| Management fees |
|
|
39,884 |
|
| Trustees fees |
|
|
1,645 |
|
| Professional fees |
|
|
15,054 |
|
| Shareholder reporting expenses |
|
|
16,424 |
|
| Shareholder servicing agent fees |
|
|
11 |
|
| Other |
|
|
4,368 |
|
| Total liabilities |
|
|
269,199 |
|
| Net assets applicable to common shares |
|
$ |
73,704,910 |
|
| Common shares outstanding |
|
|
7,691,546 |
|
| Net asset value (“NAV”) per common share
outstanding |
|
$ |
9.58 |
|
| NET ASSETS APPLICABLE TO COMMON SHARES CONSIST OF: |
|
|
|
|
| Common shares, $0.01 par value per share |
|
$ |
76,915 |
|
| Paid-in capital |
|
|
75,680,301 |
|
| Total distributable earnings (loss) |
|
|
(2,052,306 |
) |
| Net assets applicable to common shares |
|
$ |
73,704,910 |
|
| Authorized common shares |
|
|
Unlimited |
|
| † Long-term investments, cost |
|
$ |
72,079,975 |
|
| ◇Short-term investments, cost |
|
$ |
880,000 |
|
See Notes to Financial Statements.
17
Statement of Operations
|
|
|
|
|
| Six Months Ended June 30, 2023 (Unaudited) |
|
JHAA |
|
| INVESTMENT INCOME |
|
|
|
|
| Interest |
|
$ |
1,944,324 |
|
| Total investment income |
|
|
1,944,324 |
|
| EXPENSES |
|
|
|
|
| Management fees |
|
|
274,176 |
|
| Interest expense |
|
|
281,467 |
|
| Custodian expenses |
|
|
7,023 |
|
| Trustees fees |
|
|
1,455 |
|
| Professional fees |
|
|
21,516 |
|
| Shareholder reporting expenses |
|
|
34,645 |
|
| Shareholder servicing agent fees |
|
|
63 |
|
| Stock exchange listing fees |
|
|
3,648 |
|
| Investor relations expenses |
|
|
2,391 |
|
| Other |
|
|
5,741 |
|
| Total expenses |
|
|
632,125 |
|
| Net investment income (loss) |
|
|
1,312,199 |
|
| REALIZED AND UNREALIZED GAIN (LOSS) |
|
|
|
|
| Realized gain (loss) from: |
|
|
|
|
| Investments |
|
|
(897,827 |
) |
| Net realized gain (loss) |
|
|
(897,827 |
) |
| Change in unrealized appreciation (depreciation) on: |
|
|
|
|
| Investments |
|
|
1,983,406 |
|
| Change in net unrealized appreciation (depreciation) |
|
|
1,983,406 |
|
| Net realized and unrealized gain (loss) |
|
|
1,085,579 |
|
| Net increase (decrease) in net assets applicable to common
shares from operations |
|
$ |
2,397,778 |
|
See Notes to Financial Statements.
18
Statement of Changes in Net Assets
|
|
|
|
|
|
|
|
|
| |
|
JHAA |
|
| |
|
Unaudited
Six Months
Ended
6/30/23 |
|
|
Year Ended
12/31/22 |
|
| OPERATIONS |
|
|
|
|
|
|
|
|
| Net investment income (loss) |
|
$ |
1,312,199 |
|
|
$ |
2,578,538 |
|
| Net realized gain (loss) |
|
|
(897,827 |
) |
|
|
(160,547 |
) |
| Change in net unrealized appreciation (depreciation) |
|
|
1,983,406 |
|
|
|
(4,592,850 |
) |
| Net increase (decrease) in net assets applicable to common shares
from operations |
|
|
2,397,778 |
|
|
|
(2,174,859 |
) |
| DISTRIBUTIONS TO COMMON SHAREHOLDERS |
|
|
|
|
|
|
|
|
| Dividends |
|
|
(957,620 |
) |
|
|
(2,600,733 |
) |
| Decrease in net assets applicable to common shares from distributions
to common shareholders |
|
|
(957,620 |
) |
|
|
(2,600,733 |
) |
| CAPITAL SHARE TRANSACTIONS |
|
|
|
|
|
|
|
|
| Common shares: |
|
|
|
|
|
|
|
|
| Cost of shares repurchase and retired |
|
|
(610,351 |
) |
|
|
(619,790 |
) |
| Net increase (decrease) in net assets applicable to common shares
from capital share transactions |
|
|
(610,351 |
) |
|
|
(619,790 |
) |
| Net increase (decrease) in net assets applicable to common
shares |
|
|
829,807 |
|
|
|
(5,395,382 |
) |
| Net assets applicable to common shares at the beginning of
period |
|
|
72,875,103 |
|
|
|
78,270,485 |
|
| Net assets applicable to common shares at the end of
period |
|
$ |
73,704,910 |
|
|
$ |
72,875,103 |
|
See Notes to Financial Statements.
19
Statement of Cash Flows
|
|
|
|
|
| June 30, 2023 (Unaudited) |
|
JHAA |
|
| CASH FLOWS FROM OPERATING ACTIVITIES |
|
|
|
|
| Net Increase (Decrease) in Net Assets Applicable to Common Shares from Operations |
|
$ |
2,397,778 |
|
| Adjustments to reconcile the net increase (decrease) in net assets applicable to common shares from
operations to net cash provided by (used in) operating activities: |
|
|
|
|
| Purchases of investments |
|
|
(12,967,522 |
) |
| Proceeds from sales and maturities of investments |
|
|
36,598,655 |
|
| Proceeds from (Purchase of) short-term investments, net |
|
|
5,805,949 |
|
| Taxes paid |
|
|
(30,499 |
) |
| Amortization (Accretion) of premiums and discounts, net |
|
|
26,651 |
|
| (Increase) Decrease in: |
|
|
|
|
| Receivable for interest |
|
|
300,644 |
|
| Receivable for investments sold |
|
|
(781,545 |
) |
| Other assets |
|
|
(3,982 |
) |
| Increase (Decrease) in: |
|
|
|
|
| Payable for interest |
|
|
118 |
|
| Payable for investments purchased—regular settlement |
|
|
(4,253,723 |
) |
| Payable for shares redeemed |
|
|
(36,668 |
) |
| Accrued custodian fees |
|
|
(9,519 |
) |
| Accrued investor relations fees |
|
|
458 |
|
| Accrued management fees |
|
|
(14,796 |
) |
| Accrued Trustees fees |
|
|
302 |
|
| Accrued professional fees |
|
|
12,868 |
|
| Accrued shareholder reporting expenses |
|
|
7,778 |
|
| Accrued shareholder servicing agent fees |
|
|
(10 |
) |
| Accrued other expenses |
|
|
(499 |
) |
| Net realized (gain) loss from investments |
|
|
897,827 |
|
| Change in net unrealized (appreciation) depreciation of
investments |
|
|
(1,983,406 |
) |
| Net cash provided by (used in) operating activities |
|
|
25,966,859 |
|
| CASH FLOWS FROM FINANCING ACTIVITIES |
|
|
|
|
| (Repayments of) borrowings |
|
|
(24,500,000 |
) |
| Cash distributions paid to common shareholders |
|
|
(817,038 |
) |
| Cost of shares repurchased and retired |
|
|
(610,351 |
) |
| Net cash provided by (used in) financing activities |
|
|
(25,927,389 |
) |
| Net Increase (Decrease) in Cash |
|
|
39,470 |
|
| Cash at the beginning of period |
|
|
43,125 |
|
| Cash at the end of period |
|
|
82,595 |
|
|
|
| Supplemental Disclosure of Cash Flow Information |
|
|
|
| Cash paid for interest (excluding costs) |
|
$ |
272,424 |
|
See Notes to Financial Statements.
20
THIS PAGE INTENTIONALLY LEFT BLANK
21
Financial Highlights
The following data is for a common share outstanding for each fiscal year end unless otherwise
noted:
|
|
|
|
|
|
|
|
|
|
|
|
|
|
|
|
|
|
|
|
|
|
|
|
|
|
|
|
|
|
|
|
|
|
|
|
|
|
|
|
|
|
|
|
|
| |
|
|
|
|
|
|
|
|
|
|
|
|
|
|
|
| |
|
|
|
|
Investment Operations |
|
|
Less Distributions to
Common Shareholders |
|
|
Common Share |
|
| |
|
Beginning
Common
Share
Net Asset
Value |
|
|
Net
Investment
Income (NII)
(Loss)(a) |
|
|
Net
Realized/
Unrealized
Gain (Loss) |
|
|
Total |
|
|
From
NII |
|
|
From
Net
Realized
Gains |
|
|
Total |
|
|
Shelf
Offering
costs |
|
|
Discount
per
Share
Repurchased
and Retired |
|
|
Ending
Net
Asset
Value |
|
|
Ending
Share
Price |
|
| 6/30/23(i) |
|
$ |
9.39 |
|
|
$ |
0.17 |
|
|
$ |
0.14 |
|
|
$ |
0.31 |
|
|
$ |
(0.12 |
) |
|
$ |
— |
|
|
$ |
(0.12 |
) |
|
$ |
— |
|
|
$ |
— |
|
|
$ |
9.58 |
|
|
$ |
9.35 |
|
| 12/31/22 |
|
|
10.00 |
|
|
|
0.33 |
|
|
|
(0.61 |
) |
|
|
(0.28 |
) |
|
|
(0.33 |
) |
|
|
— |
|
|
|
(0.33 |
) |
|
|
— |
|
|
|
— |
(g) |
|
|
9.39 |
|
|
|
9.07 |
|
| 12/31/21 |
|
|
10.03 |
|
|
|
0.42 |
|
|
|
(0.03 |
) |
|
|
0.39 |
|
|
|
(0.42 |
) |
|
|
— |
|
|
|
(0.42 |
) |
|
|
— |
|
|
|
— |
|
|
|
10.00 |
|
|
|
9.98 |
|
| 12/31/20 |
|
|
10.36 |
|
|
|
0.53 |
|
|
|
(0.31 |
) |
|
|
0.22 |
|
|
|
(0.55 |
) |
|
|
— |
|
|
|
(0.55 |
) |
|
|
— |
|
|
|
— |
|
|
|
10.03 |
|
|
|
9.58 |
|
| 12/31/19 |
|
|
9.85 |
|
|
|
0.63 |
|
|
|
0.45 |
|
|
|
1.08 |
|
|
|
(0.57 |
) |
|
|
— |
|
|
|
(0.57 |
) |
|
|
— |
|
|
|
— |
|
|
|
10.36 |
|
|
|
10.85 |
|
| 12/31/18(d) |
|
|
9.88 |
|
|
|
(0.01 |
) |
|
|
— |
|
|
|
(0.01 |
) |
|
|
— |
|
|
|
— |
|
|
|
— |
|
|
|
(0.02 |
) |
|
|
— |
|
|
|
9.85 |
|
|
|
10.85 |
|
The following table sets forth information regarding the Fund’s outstanding senior securities as of the end of the Fund’s last
five fiscal periods, as applicable.
|
|
|
|
|
|
|
|
|
| |
|
Borrowings |
|
| |
|
Aggregate
Amount
Outstanding
(000)(e) |
|
|
Asset
Coverage
Per $1,000(f) |
|
| 6/30/23(i) |
|
$ |
— |
|
|
$ |
— |
|
| 12/31/22 |
|
|
24,500 |
|
|
|
3,974 |
|
| 12/31/21 |
|
|
24,525 |
|
|
|
4,191 |
|
| 12/31/20 |
|
|
24,525 |
|
|
|
4,202 |
|
| 12/31/19 |
|
|
27,025 |
|
|
|
3,998 |
|
22
|
|
|
|
|
|
|
|
|
|
|
|
|
|
|
|
|
|
|
|
|
|
|
| |
|
|
|
|
|
Common Share Supplemental Data/
Ratios Applicable to Common Shares |
|
Common Shares
Total Returns |
|
|
|
|
|
Ratios to Average Net Assets |
|
|
|
|
Based
on
Net
Asset
Value(b) |
|
|
Based
on
Share
Price(b) |
|
|
Ending
Net Assets
(000) |
|
|
Expenses(c) |
|
|
Net Investment
Income (Loss)(c) |
|
|
Portfolio
Turnover
Rate |
|
| |
3.36 |
% |
|
|
4.44 |
% |
|
$ |
73,705 |
|
|
|
1.73 |
%(h) |
|
|
3.60 |
%(h) |
|
|
16 |
% |
| |
(2.77 |
) |
|
|
(5.82 |
) |
|
|
72,875 |
|
|
|
1.89 |
|
|
|
3.46 |
|
|
|
54 |
|
| |
3.92 |
|
|
|
8.63 |
|
|
|
78,270 |
|
|
|
1.29 |
|
|
|
4.14 |
|
|
|
70 |
|
| |
2.51 |
|
|
|
(6.43 |
) |
|
|
78,524 |
|
|
|
1.57 |
|
|
|
5.49 |
|
|
|
47 |
|
| |
11.20 |
|
|
|
5.71 |
|
|
|
81,028 |
|
|
|
2.03 |
|
|
|
6.13 |
|
|
|
34 |
|
| |
(0.30 |
) |
|
|
8.50 |
|
|
|
69,042 |
|
|
|
1.74 |
(h) |
|
|
(1.74 |
)(h) |
|
|
— |
|
| (a) |
Based on average shares outstanding. |
| (b) |
Percentage is not annualized. |
|
|
|
|
|
| (c) |
|
• |
|
Net Investment Income (Loss) ratios reflect income earned and expenses incurred on assets attributable to borrowings and/or reverse repurchase agreements, (as described in Notes to Financial statements), where applicable. |
|
|
• |
|
Each ratio includes the effect of all interest expense paid and other costs related to borrowings and/or reverse repurchase agreements, where applicable, as follows: |
|
|
|
|
|
Ratios of Interest Expense
to Average Net Assets Applicable
to Common Shares |
|
| JHAA |
|
|
|
|
| 6/30/23(i) |
|
|
0.77 |
%(h) |
| 12/31/22 |
|
|
0.81 |
% |
| 12/31/21 |
|
|
0.27 |
|
| 12/31/20 |
|
|
0.47 |
|
| 12/31/19 |
|
|
0.99 |
(h) |
| (d) |
For the period December 18, 2018 (commencement of operations) through December 31, 2018. |
| (e) |
Aggregate Amount Outstanding: Aggregate amount outstanding represents the principal amount as of the end of the relevant
fiscal year. |
| (f) |
Asset Coverage Per $1,000: Asset coverage per $1,000 is calculated by subtracting the Fund’s liabilities and
indebtedness not represented by senior securities from the Fund’s total assets, dividing the results by the aggregate amount of the Fund’s senior securities representing indebtedness then outstanding (if applicable), and multiplying the
result by 1,000. |
| (g) |
Value rounded to zero. |
See Notes to Financial Statements.
23
Notes to Financial Statements
(Unaudited)
1. General Information
Fund Information: Nuveen Corporate Income 2023
Target Term Fund (the “Fund”) is registered under the Investment Company Act of 1940 (the “1940 Act”), as amended, as a diversified closed-end management investment company. The Fund was organized as Massachusetts business trust
on September 20, 2018.
The Fund seeks to return its original net asset value (“NAV”) per share on or about its termination date as noted in the following
table.
|
|
|
|
|
|
|
|
|
| |
|
Original NAV
Per Share |
|
|
Termination Date |
|
| JHAA* |
|
$ |
9.875 |
|
|
|
December 1, 2023 |
|
| * |
Based on market conditions as of the date of this report, management anticipates that JHAA’s objective of returning
the original $9.875 NAV on December 1, 2023 will not be met. |
Current Fiscal Period: The end of the reporting period for the Fund is June 30,
2023, and the period covered by these Notes to Financial Statements is the six months ended June 30, 2023 (the “current fiscal period”).
Investment
Adviser and Sub Adviser: The Fund’s investment adviser is Nuveen Fund Advisors, LLC (the “Adviser”), a subsidiary of Nuveen, LLC (“Nuveen”). Nuveen is the investment management arm of Teachers Insurance and Annuity
Association of America (TIAA). The Adviser has overall responsibility for management of the Funds, oversees the management of the Fund’s portfolio, manages the Fund’s business affairs and provides certain clerical, bookkeeping and other
administrative services, and, if necessary, asset allocation decisions. The Adviser has entered into a sub-advisory agreement with Nuveen Asset Management, LLC, (the “Sub-Adviser”), a subsidiary of the Adviser, under which the Sub-Adviser
manages the investment portfolio of the Fund.
Fund Announces Wind-Up Period: JHAA has entered the wind-up period in anticipation of its termination date on
December 1, 2023. During the wind-up period the Fund may deviate from its investment objectives and policies, and may invest up to a 100% of its managed assets in high quality, short-term securities. High quality, short-term securities for this Fund
include securities rated investment grade (BBB-/Baa3 or higher or unrated but judged by the Fund’s sub-adviser to be of comparable quality) with a final or remaining maturity of 397 days or less. Consequently, for the remainder of its term, the
Fund will invest at least 80% of its managed assets in (i) corporate debt securities; and (ii) short-term investment grade securities that have a final or remaining maturity of 397 days or less, so long as the maturity of any security in the Fund
does not occur later than June 1, 2024. These expanded investment parameters currently will provide the Fund additional flexibility to reinvest the proceeds of matured or called portfolio securities in higher quality, short-term securities. As the
Fund gets closer to its termination date, the Fund will begin to affirmatively transition its remaining below investment grade portfolio holdings to such high quality, short-term securities to enhance its ability to efficiently liquidate its
portfolio at termination. The Fund’s NAV ended the reporting period at $9.58 per share.
Development Regarding the Fund’s Control Share By Law: On
October 5, 2020, the Fund and certain other closed-end funds in the Nuveen fund complex amended their by-laws. Among other things, the amended by-laws included provisions pursuant to which, in summary, a shareholder who obtains beneficial ownership
of common shares in a Control Share Acquisition (as defined in the by-laws) shall have the same voting rights as other common shareholders only to the extent authorized by the other disinterested shareholders(the “Control Share By-Law”).
On January 14, 2021, a shareholder of certain Nuveen closed-end funds filed a civil complaint in the U.S. District Court for the Southern District of New York (the “District Court”) against certain Nuveen funds and their trustees, seeking
a declaration that such funds’ Control Share By-Laws violate the 1940 Act, rescission of such fund’s Control Share By-Laws and a permanent injunction against such funds applying the Control Share By-Laws. On February 18, 2022, the District
Court granted judgment in favor of the plaintiff’s claim for rescission of such funds’ Control Share By-Laws and the plaintiff’s declaratory judgment claim, and declared that such funds’ Control Share By-Laws violate Section
18(i) of the 1940 Act. Following review of the judgment of the District Court, on February 22, 2022, the Fund’s Board of Trustees (the “Board”) amended the Fund’s by-laws to provide that the Fund’s Control Share By-Law
shall be of no forceand effect for so long as the judgment of the District Court is effective and that if the judgment of the District Court is reversed, overturned, vacated, stayed, orotherwise nullified, the Fund’s Control Share By-Law will
be automatically reinstated and apply to any beneficial owner of common shares acquired in a Control Share Acquisition, regardless of whether such Control Share Acquisition occurs before or after such reinstatement, for the duration of the stay or
upon issuance of the mandate reversing, overturning, vacating or otherwise nullifying the judgment of the District Court. On February 25, 2022, the Board and the Fund appealed the District Court’s decision to the U.S. Court of Appeals for the
Second Circuit.
24
2. Significant Accounting Policies
The accompanying financial statements were prepared in accordance with accounting principles generally accepted in the United States of America
(“U.S. GAAP”), which may require the use of estimates made by management and the evaluation of subsequent events. Actual results may differ from those estimates. The Fund is an investment company and follows the accounting guidance in
the Financial Accounting Standards Board (“FASB”) Accounting Standards Codification 946, Financial Services – Investment Companies. The NAV for financial reporting purposes may differ from the NAV for processing security and common
share transactions. The NAV for financial reporting purposes includes security and common share transactions through the date of the report. Total return is computed based on the NAV used for processing security and common share transactions. The
following is a summary of the significant accounting policies consistently followed by the Fund.
Compensation: The Fund pays no compensation directly to those
of its officers, all of whom receive remuneration for their services to the Fund from the Adviser or its affiliates. The Board has adopted a deferred compensation plan for independent trustees that enables trustees to elect to defer receipt of all
or a portion of the annual compensation they are entitled to receive from certain Nuveen-advised funds. Under the plan, deferred amounts are treated as though equal dollar amounts had been invested in shares of select Nuveen-advised funds.
Distribution to Common Shareholders: Distributions to common shareholders are recorded on the ex-dividend date. The amount,
character and timing of distributions are determined in accordance with federal income tax regulations, which may differ from U.S. GAAP.
In seeking to achieve its
investment objectives, the Fund currently intends to set aside and retain in its net assets (and therefore its NAV) a portion of its net investment income, and possibly all or a portion of its gains. This will reduce the amounts otherwise available
for distribution prior to the liquidation of the Fund, and the Fund may incur taxes on such retained amounts. Such retained income or gains, net of any taxes, would constitute a portion of the liquidating distribution returned to investors on or
about the termination date.
Indemnifications: Under the Fund’s organizational documents, its officers and trustees are indemnified against certain
liabilities arising out of the performance of their duties to the Fund. In addition, in the normal course of business, the Fund enters into contracts that provide general indemnifications to other parties. The Fund’s maximum exposure under
these arrangements is unknown as this would involve future claims that may be made against the Fund that have not yet occurred. However, the Fund has not had prior claims or losses pursuant to these contracts and expects the risk of loss to be
remote.
Investment and Investment Income: Securities transactions are accounted for as of the trade date for financial reporting purposes. Trade date for
senior and subordinated loans purchased in the “primary market” is considered the date on which the loan allocations are determined. Trade date for senior and subordinated loans purchased in the “secondary market” is the date on
which the transaction is entered into. Realized gains and losses on securities transactions are based upon the specific identification method. Investment income is comprised of interest income, which is recorded on an accrual basis and includes
accretion of discounts and amortization of premiums for financial reporting purposes. Investment income also reflects payment-in-kind (“PIK”) interest, fee
income and paydown gains and losses, if any. PIK interest represents income received in the form of securities in lieu of cash. Fee income consists primarily of amendment fees. Amendment fees are earned as compensation for evaluating and accepting
changes to an original senior loan agreement and are recognized when received.
Netting Agreements: In the ordinary course of business, the Fund may enter into
transactions subject to enforceable master repurchase agreements, International Swaps and Derivatives Association, Inc. (ISDA) master agreements or other similar arrangements (“netting agreements”). Generally, the right to offset in
netting agreements allows the Fund to offset certain securities and derivatives with a specific counterparty, when applicable, as well as any collateral received or delivered to that counterparty based on the terms of the agreements. Generally, the
Fund manages its cash collateral and securities collateral on a counterparty basis. With respect to certain counterparties, in accordance with the terms of the netting agreements, collateral posted to the Fund is held in a segregated account by the
Fund’s custodian and/or with respect to those amounts which can be sold or repledged, are presented in the Fund’s Portfolio of Investments or Statements of Assets and Liabilities.
The Fund’s investments subject to netting agreements as of the end of the reporting period, if any, are further described later in these Notes to Financial.
New Accounting Pronouncement: In March 2020, FASB issued Accounting Standards Update (“ASU”) 2020-04, Reference
Rate Reform: Facilitation of the Effects of Reference Rate Reform on Financial Reporting. The main objective of the new guidance is to provide relief to companies that will be impacted by the expected change in benchmark interest rates, when
participating banks will no longer be required to submit London Interbank Offered Rate (LIBOR) quotes by the UK Financial Conduct Authority (FCA). The new guidance allows companies to, provided the only changes to existing contracts are a change to
an approved benchmark interest rate, account for modifications as a continuance of the existing contract without additional analysis. For new and existing contracts, the Fund may elect to apply the amendments as of March 12, 2020 through
December 31, 2022. In December 2022, FASB deferred ASU 2022-04 and issued ASU 2022-06, Reference Rate Reform: Deferral of the Sunset Date of Topic 848, which extends the application of the amendments through December 31, 2024. Management has
not yet elected to apply the amendments, is continuously evaluating the potential effect a discontinuation of LIBOR could have on the Fund’s investments and has currently determined that it is unlikely the ASU’s adoption will have a
significant impact on the Fund’s financial statements and various filings.
25
Notes to Financial Statements (continued)
(Unaudited)
3. Investment Valuation and Fair Value Measurements
The Fund’s
investments in securities are recorded at their estimated fair value utilizing valuation methods approved by the Adviser, subject to oversight of the Board. Fair value is defined as the price that would be received upon selling an investment or
transferring a liability in an orderly transaction to an independent buyer in the principal or most advantageous market for the investment. U.S. GAAP establishes the three-tier hierarchy which is used to maximize the use of observable market data
and minimize the use of unobservable inputs and to establish classification of fair value measurements for disclosure purposes. Observable inputs reflect the assumptions market participants would use in pricing the asset or liability. Observable
inputs are based on market data obtained from sources independent of the reporting entity. Unobservable inputs reflect management’s assumptions about the assumptions market participants would use in pricing the asset or liability. Unobservable
inputs are based on the best information available in the circumstances. The following is a summary of the three-tiered hierarchy of valuation input levels.
|
|
|
| Level 1 – |
|
Inputs are unadjusted and prices are determined using quoted prices in active markets for identical securities. |
| Level 2 – |
|
Prices are determined using other significant observable inputs (including quoted prices for similar securities, interest rates, credit spreads, etc.). |
| Level 3 – |
|
Prices are determined using significant unobservable inputs (including management’s assumptions in determining the fair value of investments). |
A description of the valuation techniques applied to the Fund’s major classifications of assets and liabilities measured at fair
value follows:
Prices of fixed-income securities are generally provided by pricing services approved by the Adviser, which is subject to review by the Adviser and
oversight of the Board. Pricing services establish a security’s fair value using methods that may include consideration of the following: yields or prices of investments of comparable quality, type of issue, coupon, maturity and rating, market
quotes or indications of value from security dealers, evaluations of anticipated cash flows or collateral, general market conditions and other information and analysis, including the obligor’s credit characteristics considered relevant. In
pricing certain securities, particularly less liquid and lower quality securities, pricing services may consider information about a security, its issuer or market activity provided by the Adviser. These securities are generally classified as
Level 2.
Repurchase agreements are valued at contract amount plus accrued interest, which approximates market value. These securities are generally classified
as Level 2.
For any portfolio security or derivative for which market quotations are not readily available or for which the Adviser deems the valuations derived
using the valuation procedures described above not to reflect fair value, the Adviser will determine a fair value in good faith using alternative procedures approved by the Adviser, subject to the oversight of the Board. As a general principle, the
fair value of a security is the amount that the owner might reasonably expect to receive for it in a current sale. A variety of factors may be considered in determining the fair value of such securities, which may include consideration of the
following: yields or prices of investments of comparable quality, type of issue, coupon, maturity and rating, market quotes or indications of value from security dealers, evaluations of anticipated cash flows or collateral, general market conditions
and other information and analysis, including the obligor’s credit characteristics considered relevant. To the extent the inputs are observable and timely, the values would be classified as Level 2 otherwise they would be classified as
Level 3.
The following table summarizes the market value of the Fund’s investments as of the end of the reporting period, based on the inputs used to value
them:
|
|
|
|
|
|
|
|
|
|
|
|
|
|
|
|
|
|
|
|
|
|
| JHAA |
|
Level 1 |
|
|
Level 2 |
|
|
Level 3 |
|
|
Total |
|
| Long-Term Investments: |
|
|
|
|
|
|
|
|
|
|
|
|
|
|
|
|
| Corporate Bonds |
|
$ |
— |
|
|
$ |
69,697,649 |
|
|
$ |
— |
|
|
$ |
69,697,649 |
|
| Variable Rate Senior Loan Interests |
|
|
— |
|
|
|
1,035,832 |
|
|
|
— |
|
|
|
1,035,832 |
|
| Convertible Bonds |
|
|
— |
|
|
|
678,650 |
|
|
|
— |
|
|
|
678,650 |
|
|
|
|
|
|
| Short-Term Investments: |
|
|
|
|
|
|
|
|
|
|
|
|
|
|
|
|
| Repurchase Agreements |
|
|
— |
|
|
|
880,000 |
|
|
|
— |
|
|
|
880,000 |
|
| Total |
|
$ |
— |
|
|
$ |
72,292,131 |
|
|
$ |
— |
|
|
$ |
72,292,131 |
|
26
4. Portfolio Securities
Unfunded Commitments: Pursuant to the terms of certain of the variable rate senior loan agreements, the Fund may have unfunded senior loan commitments. The Fund
will maintain with its custodian, cash, liquid securities and/or liquid senior loans having an aggregate value at least equal to the amount of unfunded senior loan commitments. As of the end of the reporting period, the Fund had no such outstanding
unfunded senior loan commitments.
Participation Commitments: With respect to the senior loans held in the Fund’s portfolio, a Fund may: 1) invest in
assignments; 2) act as a participant in primary lending syndicates; or 3) invest in participations. If a Fund purchases a participation of a senior loan interest, the Fund would typically enter into a contractual agreement with the lender or other
third party selling the participation, rather than directly with the borrower. As such, a Fund not only assumes the credit risk of the borrower, but also that of the selling participant or other persons interpositioned between the Fund and the
borrower. As of the end of the reporting period, the Fund had no such outstanding participation commitments.
Repurchase Agreements: In connection with
transactions in repurchase agreements, it is the Fund’s policy that its custodian take possession of the underlying collateral securities, the fair value of which exceeds the principal amount of the repurchase transaction, including accrued
interest, at all times. If the counterparty defaults, and the fair value of the collateral declines, realization of the collateral may be delayed or limited.
The
following table presents the repurchase agreements for the Fund that are subject to netting agreements as of the end of the reporting period, and the collateral delivered related to those repurchase agreements.
|
|
|
|
|
|
|
|
|
|
|
| Fund |
|
Counterparty |
|
Short-Term
Investments, at Value |
|
|
Collateral
Pledged (From)
Counterparty |
|
| JHAA |
|
Fixed Income Clearing Corporation |
|
$ |
880,000 |
|
|
$ |
897,675 |
|
Zero Coupon Securities: A zero coupon security does not pay a regular interest coupon to its holders during the life of the
security. Income to the holder of the security comes from accretion of the difference between the original purchase price of the security at issuance and the par value of the security at maturity and is effectively paid at maturity. The market
prices of zero coupon securities generally are more volatile than the market prices of securities that pay interest periodically.
Purchases and Sales:
Long-term purchases and sales during the current fiscal period were as follows:
|
|
|
|
|
|
|
|
|
| Fund |
|
Purchases |
|
|
Sales and
Maturities |
|
| JHAA |
|
$ |
12,967,522 |
|
|
$ |
36,598,655 |
|
The Fund may purchase securities on a when-issued or delayed-delivery basis. Securities purchased on a when-issued or delayed-delivery
basis may have extended settlement periods; interest income is not accrued until settlement date. Any securities so purchased are subject to market fluctuation during this period. The Fund has earmarked securities in their portfolios with a current
value at least equal to the amount of the when-issued/delayed-delivery purchase commitments. If a Fund has outstanding when-issued/delayed-delivery purchases commitments as of the end of the reporting period, such amounts are recognized on the
Statement of Assets and Liabilities.
5. Derivative Investments
The Fund
is authorized to invest in certain derivative instruments. As defined by U.S. GAAP, a derivative is a financial instrument whose value is derived from an underlying security price, foreign exchange rate, interest rate, index of prices or rates, or
other variables.
Although the Fund is authorized to invest in derivative instruments, and may do so in the future, it did not make any such investments during the
current fiscal period.
Market and Counterparty Credit Risk: In the normal course of business the Fund may invest in financial instruments and enter into
financial transactions where risk of potential loss exists due to changes in the market (market risk) or failure of the other party to the transaction to perform (counterparty credit risk). The potential loss could exceed the value of the financial
assets recorded on the financial statements. Financial assets, which potentially expose the Fund to counterparty credit risk, consist principally of cash due from counterparties on forward, option and swap transactions, when applicable. The extent
of the Fund’s exposure to counterparty credit risk in respect to these financial assets approximates their carrying value as recorded on the Statement of Assets and Liabilities.
27
Notes to Financial Statements (continued)
(Unaudited)
The Fund helps manage counterparty credit risk by entering into agreements only with counterparties the Adviser believes have the financial resources to honor their
obligations and by having the Adviser monitor the financial stability of the counterparties. Additionally, counterparties may be required to pledge collateral daily (based on the daily valuation of the financial asset) on behalf of the Fund with a
value approximately equal to the amount of any unrealized gain above a pre- determined threshold. Reciprocally, when the Fund has an unrealized loss, the Fund has instructed the custodian to pledge assets of the Fund as collateral with a value
approximately equal to the amount of the unrealized loss above a pre-determined threshold. Collateral pledges are monitored and subsequently adjusted if and when the valuations fluctuate, either up or down, by at least the pre-determined threshold
amount.
6. Fund Shares
Common Share Transactions: Transactions in
common shares during the Fund’s current and prior fiscal period were as follows:
|
|
|
|
|
|
|
|
|
| |
|
JHAA |
|
|
|
|
| |
|
Six Months Ended
6/30/2023 |
|
|
Year Ended
12/31/2022 |
|
| Common Shares: |
|
|
|
|
|
|
|
|
| Repurchased and retired |
|
|
(66,296 |
) |
|
|
(68,300 |
) |
| Total |
|
|
(66,296 |
) |
|
|
(68,300 |
) |
| Weighted average common share: |
|
|
|
|
|
|
|
|
| Price per share repurchased and retired |
|
$ |
9.19 |
|
|
$ |
9.05 |
|
| Discount per share repurchased and retired |
|
|
3.30 |
% |
|
|
3.74 |
% |
7. Income Tax Information
The Fund intends to
distribute substantially all of its net investment income and net capital gains to shareholders and otherwise comply with the requirements of Subchapter M of the Internal Revenue Code applicable to regulated investment companies. Therefore, no
federal income tax provision is required.
The Fund files income tax returns in U.S. federal and applicable state and local jurisdictions. A Fund’s federal
income tax returns are generally subject to examination for a period of three fiscal years after being filed. State and local tax returns may be subject to examination for an additional period of time depending on the jurisdiction. Management has
analyzed the Fund’s tax positions taken for all open tax years and has concluded that no provision for income tax is required in the Fund’s financial statements.
As of the end of the reporting period, the aggregate cost and net unrealized appreciation/(depreciation) of all investments for federal income tax purposes were as
follows:
|
|
|
|
|
|
|
|
|
|
|
|
|
|
|
|
|
| Fund |
|
Tax Cost |
|
|
Gross Unrealized
Appreciation |
|
|
Gross Unrealized
(Depreciation) |
|
|
Net
Unrealized
Appreciation
(Depreciation) |
|
| JHAA |
|
$ |
72,993,679 |
|
|
$ |
24,274 |
|
|
$ |
(725,822 |
) |
|
$ |
(701,548 |
) |
For purposes of this disclosure, tax cost generally includes the cost of portfolio investments as well as up-front fees or premiums
exchanged on derivatives and any amounts unrealized for income statement reporting but realized income and/or capital gains for tax reporting, if applicable.
As of
prior fiscal period end, the components of accumulated earnings on a tax basis were as follows:
|
|
|
|
|
|
|
|
|
|
|
|
|
|
|
|
|
|
|
|
|
|
|
|
|
|
|
|
|
| Fund |
|
Undistributed
Ordinary
Income |
|
|
Undistributed
Long-Term
Capital Gains |
|
|
Unrealized
Appreciation
(Depreciation) |
|
|
Capital Loss
Carryforwards |
|
|
Late-Year Loss
Deferrals |
|
|
Other
Book-to-Tax
Differences |
|
|
Total |
|
| JHAA |
|
|
968,804 |
|
|
$ |
— |
|
|
$ |
(2,699,182 |
) |
|
$ |
(1,792,585 |
) |
|
$ |
— |
|
|
$ |
— |
|
|
|
(3,522,963 |
) |
As of prior fiscal period end, the Fund had capital loss carryforward, which will not expire:
|
|
|
|
|
|
|
|
|
| Fund |
|
Short-Term |
|
Long-Term |
|
Total |
|
| JHAA |
|
223,810 |
|
1,568,775 |
|
|
1,792,585 |
|
28
8. Management Fees
The Fund’s management fee compensates the Adviser for overall investment advisory and administrative services and general office facilities. The Sub-Adviser is
compensated for its services to the Fund from the management fees paid to the Adviser.
The Fund’s management fee consists of two components – a fund-level
fee, based only on the amount of assets within the Fund, and a complex-level fee, based on the aggregate amount of all eligible fund assets managed by the Adviser. This pricing structure enables Fund shareholders to benefit from growth in the assets
within their respective Fund as well as from growth in the amount of complex-wide assets managed by the Adviser.
The annual fund-level fee, payable monthly, for the
Fund is calculated according to the following schedule:
|
|
|
|
|
| Average Daily Managed Assets* |
|
Fund-Level Fee Rate |
|
| For the first $500 million |
|
|
0.5000 |
% |
| For the next $250 million |
|
|
0.4875 |
|
| For managed assets over $750 million |
|
|
0.4750 |
|
The annual complex-level fee, payable monthly, is calculated by multiplying the current complex-wide fee rate, determined according to the
following schedule by the Fund’s daily managed assets:
|
|
|
|
|
| Complex-Level Eligible Asset Breakpoint Level* |
|
Effective Complex-Level
Fee Rate at Breakpoint Level |
|
| $55 billion |
|
|
0.2000 |
% |
| $56 billion |
|
|
0.1996 |
|
| $57 billion |
|
|
0.1989 |
|
| $60 billion |
|
|
0.1961 |
|
| $63 billion |
|
|
0.1931 |
|
| $66 billion |
|
|
0.1900 |
|
| $71 billion |
|
|
0.1851 |
|
| $76 billion |
|
|
0.1806 |
|
| $80 billion |
|
|
0.1773 |
|
| $91 billion |
|
|
0.1691 |
|
| $125 billion |
|
|
0.1599 |
|
| $200 billion |
|
|
0.1505 |
|
| $250 billion |
|
|
0.1469 |
|
| $300 billion |
|
|
0.1445 |
|
| * |
For the complex-level fees, managed assets include closed-end fund assets managed by the Adviser that are attributable to
certain types of leverage. For these purposes, leverage includes the funds’ use of preferred stock and borrowings and certain investments in the residual interest certificates (also called inverse floating rate securities) in tender option bond
(TOB) trusts, including the portion of assets held by a TOB trust that has been effectively financed by the trust’s issuance of floating rate securities, subject to an agreement by the Adviser as to certain funds to limit the amount of such
assets for determining managed assets in certain circumstances. The complex-level fee is calculated based upon the aggregate daily managed assets of all Nuveen open-end and closed-end funds that constitute “eligible assets.” Eligible
assets do not include assets attributable to investments in other Nuveen funds or assets in excess of a determined amount (originally $2 billion) added to the Nuveen fund complex in connection with the Adviser’s assumption of the management of
the former First American Funds effective January 1, 2011, but do not include certain assets of certain Nuveen funds that were reorganized into funds advised by an affiliate of the Adviser during the 2019 calendar year. As of June 30, 2023, the
complex-level fee for the Fund was as follows: |
|
|
|
|
|
| Fund |
|
Complex-Level Fee |
|
| JHAA |
|
|
0.1595 |
% |
9. Fund Leverage
Borrowings:
During the current fiscal period, the Fund utilized borrowing arrangements (“Borrowings”) as a means of leverage. Effective from May 3, 2023, the Fund’s borrowings arrangements became inactive and prior to that the Fund had maximum
commitment of $27,500,000.
As of the end of the reporting period, the Fund did not have outstanding balance on its borrowings.
Interest was charged on the Borrowings at 1-Month Term SOFR plus 0.750% per annum on the amounts borrowed and accrued a 0.125% per annum commitment fee on the undrawn
portion of the Borrowings.
29
Notes to Financial Statements (continued)
(Unaudited)
During the current fiscal period, the average daily balance outstanding (which expired during reporting period) and average annual interest rate on the Fund’s
Borrowings were as follows:
|
|
|
|
|
| |
|
|
|
| Average daily balance outstanding |
|
|
$16,241,739 |
|
| Average annual interest rate |
|
|
0.55 |
% |
In order to maintain its Borrowings, the Fund must have met certain collateral, asset coverage and other requirements. The Fund’s
Borrowings outstanding were fully secured by eligible securities held in its portfolio of investments.
Interest expense incurred on the borrowed amount and undrawn
balance are recognized as components of “Interest expense” on the Statement of Operations.
10. Inter-Fund Lending
Inter-Fund Borrowing and Lending: The SEC has granted an exemptive order permitting registered open-end and closed-end Nuveen funds to participate in an inter-fund
lending facility whereby the Nuveen funds may directly lend to and borrow money from each other for temporary purposes (e.g., to satisfy redemption requests or when a sale of securities “fails,” resulting in an unanticipated cash
shortfall) (the “Inter-Fund Program”). The closed-end Nuveen funds, including the Funds covered by this shareholder report, will participate only as lenders, and not as borrowers, in the Inter-Fund Program because such closed-end funds
rarely, if ever, need to borrow cash to meet redemptions. The Inter-Fund Program is subject to a number of conditions, including, among other things, the requirements that (1) no fund may borrow or lend money through the Inter-Fund Program unless it
receives a more favorable interest rate than is typically available from a bank or other financial institution for a comparable transaction; (2) no fund may borrow on an unsecured basis through the Inter-Fund Program unless the Funds’
outstanding borrowings from all sources immediately after the inter-fund borrowing total 10% or less of its total assets; provided that if the borrowing fund has a secured borrowing outstanding from any other lender, including but not limited to
another fund, the inter-fund loan must be secured on at least an equal priority basis with at least an equivalent percentage of collateral to loan value; (3) if a Funds’ total outstanding borrowings immediately after an inter-fund borrowing
would be greater than 10% of its total assets, the fund may borrow through the inter-fund loan on a secured basis only; (4) no fund may lend money if the loan would cause its aggregate outstanding loans through the Inter-Fund Program to exceed 15%
of its net assets at the time of the loan; (5) a Funds’ inter-fund loans to any one fund shall not exceed 5% of the lending Funds’ net assets; (6) the duration of inter-fund loans will be limited to the time required to receive payment for
securities sold, but in no event more than seven days; and (7) each inter-fund loan may be called on one business day’s notice by a lending fund and may be repaid on any day by a borrowing fund. In addition, a Nuveen fund may participate in the
Inter-Fund Program only if and to the extent that such participation is consistent with the Funds’ investment objective and investment policies. The Board is responsible for overseeing the Inter-Fund Program.
The limitations detailed above and the other conditions of the SEC exemptive order permitting the Inter-Fund Program are designed to minimize the risks associated with
Inter-Fund Program for both the lending fund and the borrowing fund. However, no borrowing or lending activity is without risk. When a fund borrows money from another fund, there is a risk that the loan could be called on one day’s notice or
not renewed, in which case the fund may have to borrow from a bank at a higher rate or take other actions to payoff such loan if an inter-fund loan is not available from another fund. Any delay in repayment to a lending fund could result in a lost
investment opportunity or additional borrowing costs.
During the current reporting period, the Fund did not enter into any inter-fund loan activity.
30
Risk Considerations
(Unaudited)
Fund shares are not guaranteed or endorsed by any bank or other insured depository institution, and are not federally insured by the Federal Deposit Insurance
Corporation.
Nuveen Corporate Income 2023 Target Term Fund (JHAA)
Investing in closed-end funds involves risk; principal loss is possible. There is no guarantee the Fund’s investment objectives will be achieved. Closed-end fund
shares may frequently trade at a discount or premium to their net asset value. Debt or fixed income securities such as those held by the Fund, are subject to market risk,
credit risk, interest rate risk, derivatives risk, liquidity risk, and income risk. As interest rates rise, bond prices fall. Lower credit debt securities may be
more likely to fail to make timely interest or principal payments and may be subject to higher liquidity risk. Adjustable Rate Senior Loans may not be fully secured by collateral, generally do not trade on exchanges, and are typically issued
by unrated or below-investment grade companies, and therefore are subject to greater liquidity and credit risk. Leverage increases return volatility and magnifies
the Fund’s potential return and its risks; there is no guarantee a fund’s leverage strategy will be successful. Foreign investments involve additional
risks, including currency fluctuation, political and economic instability, lack of liquidity and differing legal and accounting standards. The risks of foreign investments are magnified in emerging markets. These and other risk considerations
including the Fund’s limited term and call risk are described in more
detail on the Fund’s web page at www.nuveen.com/JHAA.
31
Additional Fund Information (Unaudited)
|
|
|
|
|
|
|
|
|
| Board of Trustees |
|
|
|
|
|
|
|
|
| Jack B. Evans |
|
William C. Hunter |
|
Amy B.R. Lancellotta |
|
Joanne T. Medero |
|
Albin F. Moschner |
| John K. Nelson |
|
Matthew Thornton III |
|
Terence J. Toth |
|
Margaret L. Wolff |
|
Robert L. Young |
|
|
|
|
|
|
|
|
|
| |
|
|
|
|
| Investment Adviser Nuveen Fund Advisors, LLC
333 West Wacker Drive Chicago, IL 60606 |
|
Custodian State Street
Bank
& Trust Company One Congress Street Suite 1
Boston, MA 02114-2016 |
|
Legal Counsel Chapman and Cutler LLP
Chicago, IL 60603 |
|
Independent Registered
Public Accounting Firm KPMG
LLP 200 East Randolph Street Chicago, IL 60601 |
|
Transfer Agent and
Shareholder Services
Computershare Trust Company, N.A.
150 Royall Street Canton, MA 02021
(800) 257-8787 |
Portfolio of Investments Information
The Fund is required to
file its complete schedule of portfolio holdings with the Securities and Exchange Commission (SEC) for the first and third quarters of each fiscal year as an exhibit to its report on Form N-PORT. You may obtain this information on the SEC’s
website at http://www.sec.gov.
Nuveen Funds’ Proxy Voting Information
You may obtain
(i) information regarding how each fund voted proxies relating to portfolio securities held during the most recent twelve-month period ended June 30, without charge, upon request, by calling Nuveen toll-free at (800) 257-8787 or on
Nuveen’s website at www.nuveen.com and (ii) a description of the policies and procedures that each fund used to determine how to vote proxies relating to portfolio securities without charge, upon request, by calling Nuveen toll free
at (800) 257-8787. You may also obtain this information directly from the SEC. Visit the SEC on-line at http://www.sec.gov.
CEO Certification Disclosure
The Fund’s Chief Executive Officer (CEO) has submitted to the New York Stock Exchange (NYSE) the annual CEO certification as required by
Section 303A.12(a) of the NYSE Listed Company Manual. The Fund has filed with the SEC the certification of its CEO and Chief Financial Officer required by Section 302 of the Sarbanes-Oxley Act.
Common Share Repurchases
The Fund intends to repurchase,
through its open-market share repurchase program, shares of its own common stock at such times and in such amounts as is deemed advisable. During the period covered by this report, the Fund repurchased shares of its common stock, as shown in the
accompanying table. Any future repurchases will be reported to shareholders in the next annual or semi-annual report.
|
|
|
|
|
| |
|
JHAA |
|
| Common shares repurchased |
|
|
66,296 |
|
FINRA BrokerCheck
The
Financial Industry Regulatory Authority (FINRA) provides information regarding the disciplinary history of FINRA member firms and associated investment professionals. This information as well as an investor brochure describing FINRA BrokerCheck is
available to the public by calling the FINRA BrokerCheck Hotline number at (800) 289-9999 or by visiting www.FINRA.org.
32
Glossary of Terms Used in this Report
(Unaudited)
| ∎ |
|
Average Annual Total Return: This is a commonly used method to express an investment’s performance over a
particular, usually multi-year time period. It expresses the return that would have been necessary each year to equal the investment’s actual cumulative performance (including change in NAV or market price and reinvested dividends and capital
gains distributions, if any) over the time period being considered. |
| ∎ |
|
Duration: Duration is a measure of the expected period over which a bond’s principal and interest will be paid,
and consequently is a measure of the sensitivity of a bond’s or bond fund’s value to changes when market interest rates change. Generally, the longer a bond’s or fund’s duration, the more the price of the bond or fund will change
as interest rates change. |
| ∎ |
|
Effective Leverage: Effective leverage is a fund’s effective economic leverage, and includes both regulatory
leverage (see below) and the leverage effects of certain derivative investments in the fund’s portfolio. |
| ∎ |
|
Leverage: Leverage is created whenever a fund has investment exposure (both reward and/or risk) equivalent to more
than 100% of the investment capital. |
| ∎ |
|
Net Asset Value (NAV) Per Share: A fund’s Net Assets is equal to its total assets (securities, cash, accrued
earnings and receivables) less its total liabilities. NAV per share is equal to the fund’s Net Assets divided by its number of shares outstanding. |
| ∎ |
|
Regulatory Leverage: Regulatory leverage consists of preferred shares issued by or borrowings of a fund. Both of
these are part of a fund’s capital structure. Regulatory leverage is subject to asset coverage limits set in the Investment Company Act of 1940. |
33
Annual Investment Management Agreement Approval Process
(Unaudited)
At a meeting held on May 23-25, 2023 (the “May Meeting”), the Board of Trustees (the “Board”
and each Trustee, a “Board Member”) of the Fund, which is comprised entirely of Board Members who are not “interested persons” (as defined under the Investment Company Act of 1940 (the “1940 Act”))
(the “Independent Board Members”), approved the renewal of the management agreement (the “Investment Management Agreement”) with Nuveen Fund Advisors, LLC (the “Adviser”) pursuant to which the
Adviser serves as the investment adviser to the Fund and the sub-advisory agreement (the “Sub-Advisory Agreement”) with Nuveen Asset Management, LLC
(the “Sub-Adviser”) pursuant to which the Sub-Adviser serves as the sub-adviser to the Fund for an additional one-year term. As the Board is comprised of all Independent Board Members, the references to the Board and the Independent Board Members are interchangeable.
Following up to an initial two-year period, the Board considers the renewal of the Investment Management Agreement and the Sub-Advisory Agreement on behalf of the Fund on an annual basis. The Investment Management Agreement and Sub-Advisory Agreement are collectively referred to as the
“Advisory Agreements,” and the Adviser and the Sub-Adviser are collectively, the “Fund Advisers” and each, a “Fund Adviser.”
The Independent Board Members considered the review of the advisory agreements for the Nuveen funds to be an ongoing process and employed the accumulated information,
knowledge and experience the Board Members had gained during their tenure on the boards governing the Nuveen funds and working with the Adviser and the applicable sub-advisers in their annual review of the
advisory agreements. Throughout the year, the Board and its committees meet regularly and, at these meetings, receive regular and/or special reports that cover an extensive array of topics and information that are relevant to the Board’s annual
consideration of the renewal of the advisory agreements for the Nuveen funds. Such information may address, among other things, fund performance and risk information; the Adviser’s strategic plans; product initiatives for various funds; the
review of the funds and investment teams; compliance, regulatory and risk management matters; the trading practices of the various sub-advisers to the Nuveen funds; management of distributions; valuation of
securities; fund expenses; securities lending; liquidity management; overall market and regulatory developments; and with respect to closed-end funds, capital management initiatives, institutional ownership,
management of leverage financing and the secondary market trading of the closed-end funds and any actions to address discounts. The Board also seeks to meet periodically with the Nuveen funds’ sub-advisers and/or portfolio teams, when feasible. The presentations, discussions, and meetings throughout the year also provide a means for the Board to evaluate the level, breadth and quality of services provided
by the Adviser and how such services have changed over time in light of new or modified regulatory requirements, changes to market conditions or other factors.
In
connection with its annual consideration of the advisory agreements for the Nuveen funds, the Board, through its independent legal counsel, requested and received extensive materials and information prepared specifically for its review of such
advisory agreements by the Adviser and by Broadridge Financial Solutions, Inc. (“Broadridge”), an independent provider of investment company data. The materials cover a wide range of topics including, but not limited to, a
description of the nature, extent and quality of services provided by the Fund Advisers; a review of product actions advanced in 2022 for the benefit of particular Nuveen funds and/or the Nuveen fund complex; a review of each sub-adviser to the Nuveen funds and/or the applicable investment team; an analysis of fund performance with a focus on any Nuveen funds considered performance outliers; an analysis of the fees and expense ratios of
the Nuveen funds with a focus on any Nuveen funds considered expense outliers; a review of management fee schedules; a description of portfolio manager compensation; an overview of the secondary market trading of shares of the Nuveen closed-end funds (including, among other things, an analysis of secondary market performance and commentary regarding the leverage management, share repurchase and shelf offering programs of Nuveen closed-end funds); a description of the profitability or financial data of Nuveen and the sub-advisers to the Nuveen funds; and a description of indirect benefits received by
the Adviser and the sub-advisers as a result of their relationships with the Nuveen funds. The information prepared specifically for the annual review supplemented the information provided to the Board and its
committees and the evaluations of the Nuveen funds by the Board and its committees during the year. The Board’s review of the advisory agreements for the Nuveen funds is based on all the information provided to the Board and its committees
throughout the year as well as the information prepared specifically with respect to the annual review of such advisory agreements. The performance, fee and
34
expense data and other information provided by a
Fund Adviser, Broadridge or other service providers were not independently verified by the Independent Board Members.
As part of its review, the Board met on April 11-12, 2023 (the “April Meeting”) to review and discuss, in part, the performance of the Nuveen funds and the Adviser’s evaluation of each sub-adviser to
the Nuveen funds and/or its investment teams. At the April Meeting, the Board Members asked questions and requested additional information that was provided for the May Meeting.
The Independent Board Members were advised by independent legal counsel during the annual review process as well as throughout the year, including meeting in executive
sessions with such counsel at which no representatives from the Adviser or the Sub-Adviser were present. In connection with their annual review, the Independent Board Members also received a memorandum from
independent legal counsel outlining their fiduciary duties and legal standards in reviewing the Advisory Agreements, including guidance from court cases evaluating advisory fees.
The Board’s decision to renew the Advisory Agreements was not based on a single identified factor, but rather the decision reflected the comprehensive consideration
of all the information provided to the Board and its committees throughout the year as well as the materials prepared specifically in connection with the renewal process. The contractual arrangements are a result of multiple years of review,
negotiation and information provided in connection with the Board’s annual review of the Nuveen funds’ advisory arrangements and oversight of the Nuveen funds. Each Board Member may have attributed different levels of importance to the
various factors and information considered in connection with the approval process and may place different emphasis on the relevant information year to year in light of, among other things, changing market and economic conditions. A summary of the
principal factors and information, but not all the factors, the Board considered in deciding to renew the Advisory Agreements is set forth below.
| A. |
|
Nature, Extent and Quality of Services |
In evaluating the renewal of the Advisory Agreements, the
Independent Board Members received and considered information regarding the nature, extent and quality of the applicable Fund Adviser’s services provided to the Fund with particular focus on the services and enhancements or changes to such
services provided during the last year. The Independent Board Members considered the Investment Management Agreement and the Sub-Advisory Agreement separately in the course of their review. With this approach,
they considered the respective roles of the Adviser and the Sub-Adviser in providing services to the Fund.
The Board recognized that the Adviser provides a wide array of management, oversight and administrative services to manage and operate the Nuveen funds
and that the scope and complexity of these services, along with the undertakings required of the Adviser in connection with providing these services, have expanded over time as a result of, among other things, regulatory, market and other
developments. The Board noted the Adviser’s dedication of resources, time, personnel and capital and commitment to continuing to develop improvements and innovations that seek to enhance the Nuveen fund complex and meet the needs of the Nuveen
funds in an increasingly complex regulatory environment. The Board received and reviewed information regarding, among other things, the Adviser’s investment oversight responsibilities, regulatory and compliance services, administrative duties
and other services.
The Board considered the breadth and the quality of the services the Adviser and its various teams provide in overseeing the
investment management of the Nuveen funds, including, among other things, overseeing and reviewing the services provided by the various sub-advisers to the Nuveen funds and their investment teams; evaluating
fund performance and market conditions; overseeing operational and investment risks; evaluating investment strategies and recommending any changes thereto; managing liquidity; managing the daily valuation of portfolio securities; overseeing trade
execution and securities lending; and setting and managing distributions consistent with the respective fund’s product design. With respect to closed-end funds, such services also include managing
leverage; monitoring asset coverage levels for leveraged funds and compliance with rating agency criteria; providing capital management and secondary market services (such as implementing common share shelf offerings, capital return programs and
common share repurchases); and maintaining a closed-end fund investor relations program. The Board also reviewed the structure of investment personnel compensation of each Fund Adviser and considered whether
the structure provides appropriate incentives to attract and maintain qualified personnel and to act in the best interests of the respective Nuveen fund.
35
Annual Investment Management Agreement Approval Process (continued)
(Unaudited)
Given the Nuveen funds operate in a highly regulated industry, the Board further considered the extensive compliance, regulatory and administrative
services the Adviser and its various teams provide to manage and operate the Nuveen funds. The Board recognized such services included, but were not limited to, managing compliance policies; monitoring compliance with applicable policies, laws and
regulations; devising internal compliance programs in seeking to enhance compliance with regulatory requirements and creating a framework to review and assess compliance programs; overseeing sub-adviser
compliance testing; preparing compliance training materials; and responding to regulatory requests. The Board reviewed highlights of the various initiatives Nuveen compliance had taken in 2022 including, among other things, additional due diligence
of service providers as their operating environments evolve post-Covid to more hybrid in-person working arrangements; investments in supporting and expanding international trading capabilities; continuing
efforts to enhance policies and controls to address compliance risks including those related to environmental, social and governance (“ESG”) matters and new regulatory developments or guidance; and establishing and maintaining
compliance policies and comprehensive compliance training programs. The Board also considered information regarding the Adviser’s business continuity, disaster recovery and information security programs and the periodic testing and review of
such programs.
In addition to the above functions, the Board considered the quality and extent of other
non-advisory services the Adviser provides including, among other things, various fund administration services (such as preparing, overseeing or assisting with the preparation of tax and regulatory filings);
product management services (such as evaluating and enhancing products and strategies); legal support services; shareholder services and transfer agency function oversight services; and board
support and reporting services. With respect to board support services, the Board reviewed a summary of the annual, quarterly, and special reports the Adviser and/or its affiliates provided to the Board throughout 2022.
The Board further acknowledged various initiatives the Adviser had undertaken or continued in 2022 in seeking to improve the effectiveness of its
organization, the Nuveen funds product line-up as well as particular Nuveen fund(s) through, among other things, rationalizing the product line and gaining efficiencies through mergers, repositionings and
liquidations; launching new funds; reviewing and updating investment policies and benchmarks; reopening certain funds previously closed to new investors; adding or modifying the share classes offered by certain funds; implementing fee waivers and
expense cap changes for certain funds and evaluating and adjusting portfolio management teams as appropriate for various funds; and developing policy positions on a broad range of regulatory proposals that may impact the funds and communicating with
lawmakers and other regulatory authorities to help ensure these positions are represented.
Aside from the services provided, the Board recognized
the financial resources of the Adviser and its affiliates and their willingness to make investments in the technology, personnel and infrastructure to support the Nuveen funds, including maintaining a seed capital budget to support new or existing
funds and/or facilitate changes for a respective fund. The Board noted the benefits to shareholders of investing in a fund that is a part of a large fund complex with a variety of investment disciplines, capabilities, expertise and resources
available to navigate and support the Nuveen funds including during stressed times. The Board recognized the overall reputation and capabilities of the Adviser and its affiliates, the Adviser’s continuing commitment to provide high quality
services, its willingness to implement operational or organizational changes in seeking, among other things, to enhance efficiencies and services to the Nuveen funds and its responsiveness to the Board’s questions and/or concerns raised
throughout the year and during the annual review of advisory agreements. The Board also considered the significant risks borne by the Adviser and its affiliates in connection with their services to the Nuveen funds, including entrepreneurial risks
in sponsoring new funds and ongoing risks with managing the funds such as investment, operational, reputational, regulatory, compliance and litigation risks.
The Board further considered the division of responsibilities between the Adviser and the Sub-Adviser and
recognized that the Sub-Adviser and its investment personnel generally are responsible for the management of the Fund’s portfolio under the oversight of the Adviser and the Board. The Board considered an
analysis of the Sub-Adviser provided by the Adviser which included, among other things, the assets under management of the applicable investment team and changes thereto, a summary of the applicable investment
team and changes to such team, the investment process and philosophy of the applicable investment team, the performance of the Nuveen funds sub-advised by the
Sub-Adviser over various periods of time and a summary of any significant policy and/or other changes to the Nuveen funds sub-advised by the Sub-Adviser. The
36
Board further considered at the May
Meeting or prior meetings evaluations of the Sub-Adviser’s compliance programs and trade execution. The Board noted that the Adviser recommended the renewal of the
Sub-Advisory Agreement.
Based on its review, the Board determined, in the exercise of its reasonable
business judgment, that it was satisfied with the nature, extent and quality of services provided to the Fund under each Advisory Agreement.
| B. |
|
The Investment Performance of the Fund and Fund Advisers |
In evaluating the quality of the
services provided by the Fund Advisers, the Board also considered a variety of investment performance data of the Nuveen funds prepared specifically for the annual review of the advisory agreements as well as the performance data the Board received
throughout the year representing different time periods. In this regard, leading into the May Meeting, the Board reviewed, among other things, Fund performance over the quarter, one- and three-year periods ending December 31, 2022 and March 31, 2023. In addition, the Board reviewed and discussed performance data at its regularly scheduled quarterly meetings during the year. The Board
therefore took into account the performance data, presentations and discussions (written and oral) that have been provided for the annual review as well as in prior meetings over time in evaluating fund performance, including the Adviser’s
analysis of a fund’s performance with particular focus on performance outliers (both overperformance and underperformance), the factors contributing to performance (including relative to a fund’s benchmark and peers and the impact of
market conditions) and any recommendations or steps that had been taken or were proposed to be taken to address significant performance concerns. In this regard, the Board noted, among other things, that certain Nuveen funds had changes in portfolio
managers or other significant changes to their investment strategies or policies since March 2020, and, as a result, the Board reviewed certain tracking performance data comparing the performance of such funds before and after such changes.
The Board recognized that performance data reflects performance over a specified period which may differ significantly depending on the ending dates
selected, particularly during periods of market volatility. Further, the Board noted that shareholders may evaluate performance based on their own respective holding periods which may differ from the performance periods reviewed by the Board and
lead to differing results.
In its evaluation, the Board reviewed Nuveen fund performance results from different perspectives. In general, subject to
certain exceptions, the Board reviewed both absolute and relative fund performance during the annual review over the various time periods and evaluated performance results in light of a fund’s investment objective(s), strategies and risks. With
respect to the relative performance, the Board considered fund performance in comparison to the performance of peer funds (the “Performance Peer Group”) and recognized and/or customized benchmarks (i.e., generally benchmarks
derived from multiple recognized benchmarks). In reviewing such comparative performance, the Board was cognizant of the inherent limitations of such data which can make meaningful performance comparisons generally difficult. As an illustration,
differences in the composition of the Performance Peer Group, the investment objective(s), strategies and other characteristics of the peers in the Performance Peer Group, the level, type and cost of leverage (if any) of the peers, and the varying
sizes of peers all may contribute to differences in the performance results of a Performance Peer Group compared to the applicable Nuveen fund. With respect to relative performance of a Nuveen fund compared to a benchmark index, differences, among
other things, in the investment objective(s) and strategies of a fund and the benchmark (particularly an actively managed fund that does not directly follow an index) as well as the costs of operating a fund would necessarily contribute to
differences in performance results and limit the value of the comparative performance information. To assist the Board in its review of the comparability of the relative performance, the Adviser has ranked the relevancy of the peer group to the Fund
as low, medium or high.
The secondary market trading of shares of the Nuveen closed-end funds also continues
to be a priority for the Board given its importance to shareholders, and therefore the Board and/or its Closed-end Fund committee reviews certain performance data reflecting, among other things, the premiums
and discounts at which the shares of the Nuveen closed-end funds have traded over specified periods throughout the year. In its review, the Board considers, among other things, changes to investment mandates
and guidelines, distribution policies, leverage levels and types; share repurchases and similar capital market actions; and effective communications programs to build greater awareness and deepen understanding of
closed-end funds. As applicable, the Board considered the impact of leverage on a Nuveen fund’s performance. The Board further acknowledged that performance results should include the distribution yields
of funds that seek to provide income as part of
37
Annual Investment Management Agreement Approval Process (continued)
(Unaudited)
their investment objective(s) to shareholders. In this regard, the Board considered that the use of leverage by various funds may have detracted from
total return performance of such funds over various periods in current market conditions, but the leverage also was accretive in helping to provide income.
The Board also evaluated Nuveen fund performance in light of various relevant factors which may include, among other things, general market conditions, issuer-specific information, asset class information, leverage and fund cash flows. The Board acknowledged that long-term performance could be impacted by even one period of significant outperformance or
underperformance and that a single investment theme could disproportionately affect performance. Further, the Board recognized that the market and economic conditions may significantly impact a fund’s performance, particularly over shorter
periods, and such performance may be more reflective of such economic or market events and not necessarily reflective of management skill. Although the Board reviews short-, intermediate- and longer-term performance data, the Board recognized that
longer periods of performance may reflect full market cycles.
In relation to recent general market conditions, the Board had recognized the general
market volatility and underperformance of the market in 2022 in considering Nuveen fund performance. The Board took into account the Adviser’s assessment of a fund’s performance during the recent period of significant market volatility. In
their review from year to year, the Board Members consider and may place different emphasis on the relevant information in light of changing circumstances in market and economic conditions. In evaluating performance, the Board focused particular
attention on funds with less favorable performance records. However, depending on the facts and circumstances including any differences between the respective fund and its benchmark and/or Performance Peer Group, the Board may be satisfied with a
fund’s performance notwithstanding that its performance may be below that of its benchmark and/or peer group for certain periods. With respect to any funds for which the Board has identified performance issues, the Board seeks to monitor such
funds closely until performance improves, discusses with the Adviser the reasons for such results, considers whether any steps are necessary or appropriate to address such issues, and reviews the results of any steps undertaken.
The Board’s determinations with respect to the Fund are summarized below.
The Board noted that although the Fund’s performance was below the performance of its benchmark for the three-year period ended December 31,
2022, the Fund outperformed its benchmark for the one-year period ended December 31, 2022 and ranked in the first quartile of its Performance Peer Group for the
one- and three-year periods ended December 31, 2022. In addition, the Fund outperformed its benchmark for the one- and three-year periods ended March 31, 2023
and ranked in the first quartile of its Performance Peer Group for the one-year period and third quartile for the three-year period ended March 31, 2023. In its review, the Board recognized that the
Performance Peer Group was classified as low for relevancy. Notwithstanding the foregoing, the Board noted that as a target term fund, the Fund had an investment objective that seeks to provide a high level of current income and to return its
original net asset value per common share on or about its termination date. The Board recognized that with the recent challenging market conditions, certain distressed portfolio holdings in the portfolio and limited reinvestment opportunities,
management anticipated that the Fund’s objective of returning its original net asset value would not be achieved by its termination date. The Board will continue to monitor the Fund through its scheduled termination on or about December 1,
2023.
| C. |
|
Fees, Expenses and Profitability |
As part of its annual review, the Board generally reviewed, among other things,
with respect to the Nuveen closed-end funds, the contractual management fee and actual management fee (i.e., the management fee after taking into consideration fee waivers and/or expense reimbursements,
if any) paid by a fund to the Adviser in light of the nature, extent and quality of the services provided. The Board also considered the total operating expense ratio of a fund (after any fee waivers and/or expense reimbursements). More
specifically, the Independent Board Members reviewed, among other things, each Nuveen closed-end fund’s actual management fee rate (after fee waivers and/or expense reimbursements, if any) and net total
expense ratio in relation to those of a comparable universe of funds (the “Peer Universe”) established by Broadridge. The Independent Board Members reviewed the methodology Broadridge employed to establish its Peer Universe and
recognized
38
that differences between the
applicable fund and its respective Peer Universe as well as changes to the composition of the Peer Universe from year to year may limit some of the value of the comparative data. The Independent Board Members take these limitations and differences
into account when reviewing comparative peer data. The Independent Board Members also considered a fund’s operating expense ratio as it more directly reflected the shareholder’s costs in investing in the respective fund.
In their review, the Independent Board Members considered, in particular, each Nuveen fund with a net total expense ratio (excluding investment-related
costs of leverage for closed-end funds) of six basis points or higher compared to that of its peer average (each, an “Expense Outlier Fund”) and an analysis as to the factors contributing to
each such fund’s higher relative net total expense ratio. In addition, although the Board reviewed a fund’s total net expenses both including and excluding investment-related expenses (i.e.,
leverage costs) for certain of the closed-end funds, the Board recognized that leverage expenses will vary across funds and in comparison to peers because of differences in the forms and terms of leverage
employed by the respective fund. Accordingly, in reviewing the comparative data between a fund and its peers, the Board generally considered the fund’s net total expense ratio and fees (excluding leverage costs and leveraged assets for the closed-end funds) to be higher if they were over 10 basis points higher, slightly higher if they were 6 to 10 basis points higher, in line if they were within approximately 5 basis points higher than the peer
average and below if they were below the peer average of the Peer Universe.
The Independent Board Members also considered, in relevant part, a
Nuveen fund’s management fee and net total expense ratio in light of its performance history, including reviewing certain funds identified by the Adviser and/or the Board as having a higher net total expense ratio or management fee compared to
their respective peers coupled with experiencing periods of challenged performance and considering the reasons for such comparative positions. In addition, with respect to closed-end funds that utilize
leverage, the Independent Board Members recognized that certain assets attributable to a fund’s use of leverage may be included in the amount of assets upon which the advisory fee or sub-advisory fee is
calculated. The Independent Board Members acknowledged the fact that a decision to employ leverage or increase a fund’s leverage which has the effect, all other things being equal, of increasing the assets upon which an advisory or sub-advisory fee is based (and, in turn, increasing the Adviser’s and applicable sub-adviser’s management fees), means that the Adviser and applicable sub-adviser may have a conflict of interest in determining whether to use or increase leverage. The Independent Board Members recognized, however, that the Adviser and
sub-advisers would seek to manage the potential conflict by recommending to the Board to leverage the applicable fund or increase such leverage when the Adviser and/or
sub-adviser, as applicable, has determined that such action would be in the best interests of the respective fund and its common shareholders and by periodically reviewing with the Board the fund’s
performance and the impact of the use of leverage on that performance.
In their review of the fee arrangements for the Nuveen funds, the Independent
Board Members also considered the management fee schedules, including the complex-wide and fund-level breakpoint schedules, as applicable. The Board noted that across
the Nuveen fund complex, the complex-wide fee breakpoints reduced fees by approximately $62.4 million and fund-level breakpoints reduced fees by approximately $76.1 million in 2022.
With respect to the Sub-Adviser, the Board also considered, among other things, the sub-advisory fee schedule paid to the Sub-Adviser in light of the sub-advisory services provided to the Fund and comparative data of
the fees the Sub-Adviser charges to other clients, if any. In its review, the Board recognized that the compensation paid to the Sub-Adviser is the responsibility of the
Adviser, not the Fund.
The Independent Board Members noted that the Fund had an actual management fee and a net total expense ratio that were below
the respective peer averages.
Based on its review of the information provided, the Board determined that the Fund’s management fees (as
applicable) to a Fund Adviser were reasonable in light of the nature, extent and quality of services provided to the Fund.
39
Annual Investment Management Agreement Approval Process (continued)
(Unaudited)
| |
2. |
|
Comparisons with the Fees of Other Clients |
In evaluating the appropriateness of fees, the Board
also considered information regarding the fee rates the respective Fund Advisers charged to certain other types of clients and the type of services provided to these other clients. With respect to the Adviser and/or the Sub-Adviser, such other clients may include: retail and institutional managed accounts sub-advised by the Sub-Adviser; hedge funds or
other structured products managed by the Sub-Adviser; investment companies offered outside the Nuveen family and sub-advised by the
Sub-Adviser; foreign investment companies offered by Nuveen and sub-advised by the Sub-Adviser; and collective investment trusts sub-advised by the Sub-Adviser. The Board further noted that the Adviser also advised, and the Sub-Adviser sub-advised, certain exchange-traded funds (“ETFs”) sponsored by Nuveen. The Board reviewed, among other things, the range of fees assessed for managed accounts, hedge funds (along with their
performance fee), foreign investment companies and ETFs offered by Nuveen, as applicable. The Board also reviewed the fee range and average fee rate of certain selected investment strategies offered in retail and institutional managed accounts sub-advised by the Sub-Adviser, the hedge funds advised by the Sub-Adviser (along with their performance fee) and non-Nuveen investment companies sub-advised by certain affiliated sub-advisers.
In considering the comparative fee data, the Board recognized that differences, including but not limited to, the amount, type and level of services
provided by the Adviser to the Nuveen funds compared to that provided to other clients as well as differences in investment policies; eligible portfolio assets and the manner of managing such assets; product structure; investor profiles; account
sizes; and regulatory requirements contribute to the variations in the fee schedules. Similarly, differences in the client base, governing bodies, distribution jurisdiction and operational complexities would also contribute to variations in
management fees assessed the Nuveen funds compared to foreign fund clients. Further, with respect to ETFs, the Board considered that the Nuveen ETFs that are designed to track the performance of a specified index (“Index ETFs”) were
passively managed compared to the active management of other Nuveen funds, which also contributed to the differences in fee levels between such Index ETFs and the actively managed funds. The Board acknowledged the wide range of services in addition
to investment management that the Adviser had provided to the Nuveen funds compared to other types of clients as well as the increased entrepreneurial, legal and regulatory risks that the Adviser incurs in sponsoring and managing the Nuveen funds.
In general, higher fee levels reflect higher levels of service provided by the Adviser, increased investment management complexity, greater product management requirements, and higher levels of business risk or some combination of these factors. The
Board further considered that the Sub-Adviser’s fee is essentially for portfolio management services and therefore more comparable to the fees it receives for retail wrap accounts and other external sub-advisory mandates. The Board concluded the varying levels of fees were justified given, among other things, the more extensive services, regulatory requirements and legal liabilities, and the entrepreneurial,
legal and regulatory risks incurred in sponsoring and advising a registered investment company compared to that required in advising other types of clients.
| |
3. |
|
Profitability of Fund Advisers |
In their review, the Independent Board Members considered
estimated profitability information of Nuveen as a result of its advisory services to the Nuveen funds as well as profitability data of other publicly traded asset management firms. Such profitability information included, among other things, gross
and net revenue margins (excluding distribution) of Nuveen Investments, Inc. (“Nuveen Investments”) for services to the Nuveen funds on a pre-tax and
after-tax basis for the 2022 and 2021 calendar years as well as the revenues earned (less any expense reimbursements/fee waivers) and expenses incurred by Nuveen Investments for its advisory activities to the
Nuveen funds (excluding distribution and certain other expenses) for the 2022 and 2021 calendar years. The Independent Board Members also considered a summary of some of the key factors that impacted Nuveen’s profitability in 2022. In addition,
the Board reviewed the revenues, expenses and operating margin (pre- and after-tax) the Adviser derived from its ETF product line for the 2022 and 2021 calendar years.
In developing the profitability data of the Adviser for its advisory services to the Nuveen funds, the Independent Board Members recognized the
subjective nature of calculating profitability as the information is not audited and is necessarily dependent on cost allocation methodologies to allocate expenses throughout the complex and among the various advisory products. Given there is no
perfect expense allocation methodology and that other reasonable and valid allocation methodologies could be employed and could lead to significantly different results, the Board reviewed, among other things, a description of the cost allocation
methodologies employed to develop the financial information, a summary of the history of
40
changes to the methodology over the
years from 2010 through 2022, and a historical expense analysis of Nuveen Investments’ revenues, expenses and pre-tax net revenue margins derived from its advisory services to the Nuveen funds (excluding
distribution) for the calendar years from 2017 through 2022. The Board had also appointed four Independent Board Members to serve as the Board’s liaisons, with the assistance of independent counsel, to meet with representatives of the Adviser
and review the development of the profitability data and to report to the full Board.
In addition, the Board considered certain comparative
operating margin data. In this regard, the Board reviewed the operating margins of Nuveen Investments compared to the adjusted operating margins of a peer group of asset management firms with publicly available data and the most comparable assets
under management (based on asset size and asset composition) to Nuveen. The Board recognized that the operating margins of the peers were adjusted generally to address that certain services provided by the peers were not provided by Nuveen. The
Board also reviewed, among other things, the net revenue margins (pre-tax) of Nuveen Investments on a company-wide basis and the net revenue margins (pre-tax) of Nuveen
Investments derived from its services to the Nuveen funds only (including and excluding distribution) compared to the adjusted operating margins of the peer group for each calendar year from 2012 to 2022. Although the total company operating margins
of Nuveen Investments were in the bottom half of the peer group range for 2022 and 2021, the Independent Board Members recognized the limitations of the comparative data given that peer data is not generally public and the calculation of
profitability is subjective and affected by numerous factors (such as types of funds a peer manages, its business mix, its cost of capital, the numerous assumptions underlying the methodology used to allocate expenses and other factors) that can
have a significant impact on the results.
Aside from Nuveen’s profitability, the Board recognized that the Adviser is a subsidiary of Nuveen,
LLC, the investment management arm of Teachers Insurance and Annuity Association of America (“TIAA”). Accordingly, the Board also reviewed a balance sheet for TIAA reflecting its assets, liabilities and capital and contingency
reserves for the 2022 and 2021 calendar years to consider the financial strength of TIAA. The Board recognized the benefit of an investment adviser and its parent with significant resources, particularly during periods of market volatility. The
Board also noted the reinvestments Nuveen, its parent and/or other affiliates made into its business through, among other things, the investment of seed capital in certain Nuveen funds and continued investments in enhancements to technological
capabilities.
In addition to Nuveen, the Independent Board Members considered the profitability of the
Sub-Adviser from its relationships with the respective Nuveen funds. In this regard, the Independent Board Members reviewed, among other things, the Sub-Adviser’s
revenues, expenses and net revenue margins (pre- and after-tax) for its advisory activities to the respective Nuveen funds for the calendar years ended December 31,
2022 and December 31, 2021. The Independent Board Members also reviewed a profitability analysis reflecting the revenues, expenses and revenue margin (pre- and
after-tax) by asset type for the Sub-Adviser for the calendar years ending December 31, 2022 and December 31, 2021.
In evaluating the reasonableness of the compensation, the Independent Board Members also considered any other ancillary benefits derived by the
respective Fund Adviser from its relationship with the Nuveen funds as discussed in further detail below.
Based on a consideration of all the
information provided, the Board noted that Nuveen’s and the Sub-Adviser’s level of profitability was acceptable and not unreasonable in light of the services provided.
| D. |
|
Economies of Scale and Whether Fee Levels Reflect These Economies of Scale |
The Board considered
whether there have been economies of scale with respect to the management of the Nuveen funds, whether these economies of scale have been appropriately shared with the funds and whether there is potential for realization of further economies of
scale. Although the Board recognized that economies of scale are difficult to measure with any precision and certain expenses may not decline with a rise in assets, the Board considered that Nuveen shares the benefits of economies of scale, if any,
in a number of ways including through the use of breakpoints in the management fee schedule, fee waivers and/or expense limitations, the pricing of funds at scale at inception and investments in Nuveen’s business which can enhance the services
provided to the funds for the fees paid. In this regard, the Board recognized that the management fee of the Adviser is generally comprised of a fund-level component and a complex-level component each with its own breakpoint schedule, subject to
certain exceptions. The Board reviewed the fund-level and complex-level fee schedules. With
41
Annual Investment Management Agreement Approval Process (continued)
(Unaudited)
this structure, the Board noted that the complex-level breakpoint schedule is designed to deliver the benefits of economies of scale to shareholders when
the eligible assets in the complex pass certain thresholds even if the assets of a particular fund are unchanged or have declined, and the fund-level breakpoint schedules are designed to share economies of scale with shareholders if the particular
fund grows. The Board noted, however, that although closed-end funds may make additional share offerings from time to time, the closed-end funds have a more limited
ability to increase their assets because the growth of their assets will occur primarily from the appreciation of their investment portfolios.
As
noted above, the Independent Board Members also recognized the continued reinvestment in Nuveen’s business to enhance its capabilities and services to the benefit of its various clients. The Board understood that many of these investments in
the Nuveen business were not specific to individual Nuveen funds but rather incurred across of a variety of products and services pursuant to which the family of Nuveen funds as a whole may benefit. In addition, the Board also considered that Nuveen
has provided, without raising advisory fees to the Nuveen funds, certain additional services, including, but not limited to, services required by new regulations and regulatory interpretations, and this was also a means of sharing economies of scale
with the funds and their shareholders.
Based on its review, the Board was satisfied that the current fee arrangements together with the reinvestment
in Nuveen’s business appropriately shared any economies of scale with shareholders.
The Independent Board Members received and considered information regarding
other benefits the respective Fund Adviser or its affiliates may receive as a result of their relationship with the Nuveen funds. The Board acknowledged that an affiliate of the Adviser may receive compensation for serving as a co-manager in the initial public offerings of new Nuveen closed-end funds (if any) and for serving as an underwriter on shelf offerings of existing Nuveen closed-end funds and reviewed the amounts paid for such services, if any, in 2021 and 2022.
In addition, the
Independent Board Members noted that the various sub-advisers to the Nuveen funds do not generally benefit from soft dollar arrangements with respect to Nuveen fund portfolio transactions.
Based on its review, the Board concluded that any indirect benefits received by a Fund Adviser as a result of its relationship with the Fund were
reasonable in light of the services provided.
The Independent Board Members did not identify any single factor discussed
previously as all-important or controlling. The Independent Board Members concluded that the terms of each Advisory Agreement were reasonable, that the respective Fund Adviser’s fees were reasonable in
light of the services provided to the Fund and that the Advisory Agreements be renewed for an additional one-year period.
42
Notes
43
Nuveen:
Serving Investors for Generations
Since 1898, financial professionals and their clients have relied on Nuveen to provide
dependable investment solutions through continued adherence to
proven, long-term investing
principles. Today, we offer a range of high quality solutions designed to
be integral components of a well-diversified core portfolio.
Focused on meeting investor needs.
Nuveen is the investment
manager of TIAA. We have grown into one of the world’s premier global asset managers, with specialist knowledge across all major asset classes and particular strength in solutions that provide income for investors and that draw on our expertise
in alternatives and responsible investing. Nuveen is driven not only by the independent investment processes across the firm, but also the insights, risk management, analytics and other tools and resources that a truly world-class platform provides.
As a global asset manager, our mission is to work in partnership with our clients to create solutions which help them secure their financial future.
Find
out how we can help you.
To learn more about how the products and services of Nuveen may be able to help you meet your financial goals, talk to your
financial professional, or call us at (800) 257-8787. Please read the information provided carefully before you invest. Investors should consider the investment objective and policies, risk
considerations, charges and expenses of any investment carefully. Where applicable, be sure to obtain a prospectus, which contains this and other relevant information. To obtain a prospectus, please contact your securities representative or Nuveen,
333 W. Wacker Dr., Chicago, IL 60606. Please read the prospectus carefully before you invest or send money.
Learn more about Nuveen Funds at:
www.nuveen.com/closed-end-funds
NOT FDIC INSURED MAY LOSE VALUE NO BANK GUARANTEE
|
|
|
|
|
| Nuveen Securities, LLC, member FINRA and SIPC | 333 West Wacker Drive Chicago, IL 60606 | www.nuveen.com |
|
|
|
ESA-E-0623P 3020121-INV-B-8/24 |
Not applicable to this filing.
| ITEM 3. |
AUDIT COMMITTEE FINANCIAL EXPERT. |
Not applicable to this filing.
| ITEM 4. |
PRINCIPAL ACCOUNTANT FEES AND SERVICES. |
Not applicable to this filing.
| ITEM 5. |
AUDIT COMMITTEE OF LISTED REGISTRANTS. |
Not applicable to this filing.
| ITEM 6. |
SCHEDULE OF INVESTMENTS. |
| (a) |
|
See Portfolio of Investments in Item 1. |
| ITEM 7. |
DISCLOSURE OF PROXY VOTING POLICIES AND PROCEDURES FOR CLOSED-END MANAGEMENT INVESTMENT COMPANIES.
|
Not applicable to this filing.
| ITEM 8. |
PORTFOLIO MANAGERS OF CLOSED-END MANAGEMENT INVESTMENT COMPANIES. |
Not applicable to this filing.
| ITEM 9. |
PURCHASES OF EQUITY SECURITIES BY CLOSED-END MANAGEMENT INVESTMENT COMPANY AND AFFILIATED PURCHASERS.
|
|
|
|
|
|
|
|
|
|
|
|
|
|
|
|
|
|
| Period* |
|
(a) TOTAL
NUMBER OF SHARES (OR
UNITS)
PURCHASED |
|
|
(b) AVERAGE
PRICE PAID
PER SHARE
(OR UNIT) |
|
|
(c)
TOTAL NUMBER OF SHARES (OR
UNITS) PURCHASED AS PART OF
PUBLICLY ANNOUNCED PLANS OR
PROGRAMS |
|
|
(d)*
MAXIMUM NUMBER (OR
APPROXIMATE DOLLAR VALUE) OF
SHARES (OR UNITS) THAT MAY
YET BE PURCHASED UNDER THE PLANS OR
PROGRAMS |
|
| JANUARY 1-31, 2023 |
|
|
15,728 |
|
|
|
9.1476 |
|
|
|
15,728 |
|
|
|
695,972 |
|
|
|
|
|
|
|
|
|
|
|
|
|
|
|
|
|
|
| FEBRUARY 1-28, 2023 |
|
|
4,772 |
|
|
|
9.1888 |
|
|
|
4,772 |
|
|
|
767,200 |
|
|
|
|
|
|
|
|
|
|
|
|
|
|
|
|
|
|
| MARCH 1-31, 2023 |
|
|
27,992 |
|
|
|
9.1735 |
|
|
|
27,992 |
|
|
|
739,208 |
|
|
|
|
|
|
|
|
|
|
|
|
|
|
|
|
|
|
| APRIL 1-30, 2023 |
|
|
5,416 |
|
|
|
9.2308 |
|
|
|
5,416 |
|
|
|
733,792 |
|
|
|
|
|
|
|
|
|
|
|
|
|
|
|
|
|
|
| MAY 1-31, 2023 |
|
|
12,388 |
|
|
|
9.2481 |
|
|
|
12,388 |
|
|
|
721,404 |
|
|
|
|
|
|
|
|
|
|
|
|
|
|
|
|
|
|
| JUNE 1-30, 2023 |
|
|
0 |
|
|
|
0.0000 |
|
|
|
0 |
|
|
|
721,404 |
|
|
|
|
|
|
|
|
|
|
|
|
|
|
|
|
|
|
| TOTAL |
|
|
66,296 |
|
|
|
|
|
|
|
|
|
|
|
|
|
| * |
|
The registrant’s repurchase program, for the repurchase of 780,000 shares, was authorized on August 3rd, 2022. Due to the change in cycle for annual renewals,
the program was reauthorized for a maximum repurchase amount of 770,000 shares on February 14th, 2023. Any repurchases made by the registrant pursuant to the program were made through open-market
transactions. |
| ITEM 10. |
SUBMISSION OF MATTERS TO A VOTE OF SECURITY HOLDERS. |
There have been no material changes to the procedures by which shareholders may recommend nominees to the registrant’s Board implemented after the
registrant last provided disclosure in response to this item.
| ITEM 11. |
CONTROLS AND PROCEDURES. |
| (a) |
|
The registrant’s principal executive and principal financial officers, or persons performing similar functions, have concluded that the registrant’s disclosure controls and procedures (as defined in Rule
30a-3(c) under the Investment Company Act of 1940, as amended (the “1940 Act”) (17 CFR 270.30a-3(c))) are effective, as of a date within 90 days of the filing date of this report that includes the disclosure required by this paragraph,
based on their evaluation of the controls and procedures required by Rule 30a-3(b) under the 1940 Act (17 CFR 270.30a-3(b)) and Rules 13a-15(b) or 15d-15(b) under the Securities Exchange Act of 1934, as amended (the “Exchange Act”) (17 CFR
240.13a-15(b) or 240.15d-15(b)). |
| (b) |
|
There were no changes in the registrant’s internal control over financial reporting (as defined in Rule 30a-3(d) under the 1940 Act (17 CFR 270.30a-3(d)) that occurred during the period covered by this report that
has materially affected, or is reasonably likely to materially affect, the registrant’s internal control over financial reporting. |
| ITEM 12. |
DISCLOSURE OF SECURITIES LENDING ACTIVITIES FOR CLOSED-END MANAGEMENT INVESTMENT COMPANIES.
|
Not applicable.
File the exhibits listed below as part of this Form.
(a)(1)
Any code of ethics, or amendment thereto, that is the subject of the disclosure required by Item 2, to the extent that the registrant intends to satisfy the Item 2 requirements through filing of an exhibit: Not applicable to this filing.
(a)(2) A separate certification for each principal executive officer and principal financial officer of the registrant as required
by Rule 30a-2(a) under the 1940 Act (17 CFR 270.30a-2(a)) in the exact form set forth below: See EX-99.CERT attached hereto.
(a)(3) Any written
solicitation to purchase securities under Rule 23c-1 under the 1940 Act (17 CFR 270.23c-1) sent or given during the period covered by the report by or on behalf of the registrant to 10 or more persons: Not applicable.
(a)(4) Change in the registrant’s independent public accountant. Not applicable.
(b) If the report is filed under Section
13(a) or 15(d) of the Exchange Act, provide the certifications required by Rule 30a-2 (b) under the 1940 Act (17 CFR 270.30a-2(b)), Rule 13a-14(b) or Rule 15d-14(b) under the Exchange Act (17 CFR 240.13a-14(b) or 240.15d-14(b)), and Section
1350 of Chapter 63 of Title 18 of the United States Code (18 U.S.C. 1350) as an Exhibit. A certification furnished pursuant to this paragraph will not be deemed “filed” for purposes of Section
18 of the Exchange Act (15 U.S.C. 78r), or otherwise subject to the liability of that section. Such certification will not be deemed to be incorporated by reference into any filing under the Securities Act of 1933 or the Exchange Act, except to the extent
that the registration specifically incorporates it by reference: See EX-99.906 CERT attached hereto.
SIGNATURES
Pursuant to the requirements of the Securities Exchange Act of 1934 and the Investment Company Act of 1940, the registrant has duly caused this report to be
signed on its behalf by the undersigned, thereunto duly authorized.
(Registrant) Nuveen Corporate Income 2023 Target Term Fund
|
|
|
| By (Signature and Title) |
|
/s/ Mark L. Winget |
|
|
Mark L. Winget |
|
|
Vice President and Secretary |
Date: September 6, 2023
Pursuant to the requirements of the Securities Exchange Act of 1934 and the Investment Company Act of 1940, this report has been signed below by the following
persons on behalf of the registrant and in the capacities and on the dates indicated.
|
|
|
| By (Signature and Title) |
|
/s/ David J. Lamb |
|
|
David J. Lamb |
|
|
Chief Administrative Officer |
|
|
(principal executive officer) |
Date: September 6, 2023
|
|
|
| By (Signature and Title) |
|
/s/ E. Scott Wickerham |
|
|
E. Scott Wickerham |
|
|
Vice President and Funds Controller |
|
|
(principal financial officer) |
Date: September 6, 2023
EX-99.CERT
CERTIFICATIONS PURSUANT TO SECTION 302 OF THE SARBANES-OXLEY ACT
CERTIFICATIONS
I, David J. Lamb, certify that:
1. I have reviewed this report on Form N-CSR of Nuveen Corporate Income 2023 Target Term Fund;
2. Based on my knowledge, this report does not contain any untrue statement of a material fact or omit to state a material fact necessary to
make the statements made, in light of the circumstances under which such statements were made, not misleading with respect to the period covered by this report;
3. Based on my knowledge, the financial statements, and other financial information included in this report, fairly present in all material
respects the financial condition, results of operations, changes in net assets, and cash flows (if the financial statements are required to include a statement of cash flows) of the registrant as of, and for, the periods presented in this report;
4. The registrant’s other certifying officer and I are responsible for establishing and maintaining disclosure controls and
procedures (as defined in Rule 30a-3(c) under the Investment Company Act of 1940) and internal control over financial reporting (as defined in Rule 30a-3(d) under the Investment Company Act of 1940) for the registrant and have:
| |
a) |
|
designed such disclosure controls and procedures, or caused such disclosure controls and procedures to be designed under our supervision, to ensure that material information relating to the registrant, including its
consolidated subsidiaries, is made known to us by others within those entities, particularly during the period in which this report is being prepared; |
| |
b) |
|
designed such internal control over financial reporting, or caused such internal control over financial reporting to be designed under our supervision, to provide reasonable assurance regarding the reliability of
financial reporting and the preparation of financial statements for external purposes in accordance with generally accepted accounting principles; |
| |
c) |
|
evaluated the effectiveness of the registrant’s disclosure controls and procedures and presented in this report our conclusions about the effectiveness of the disclosure controls and procedures, as of a date within
90 days prior to the filing date of this report based on such evaluation; and |
| |
d) |
|
disclosed in this report any change in the registrant’s internal control over financial reporting that occurred during the period covered by this report that has materially affected, or is reasonably likely to
materially affect, the registrant’s internal control over financial reporting; and |
5. The registrant’s other
certifying officer and I have disclosed to the registrant’s auditors and the audit committee of the registrant’s board of directors (or persons performing the equivalent functions):
| |
a) |
|
all significant deficiencies and material weaknesses in the design or operation of internal control over financial reporting which are reasonably likely to adversely affect the registrant’s ability to record,
process, summarize, and report financial information; and |
| |
b) |
|
any fraud, whether or not material, that involves management or other employees who have a significant role in the registrant’s internal control over financial reporting. |
|
|
|
| Date: September 6, 2023 |
|
/s/ David J. Lamb |
|
|
David J. Lamb |
|
|
Chief Administrative Officer |
|
|
(principal executive officer) |
I, E. Scott Wickerham, certify that:
1. I have reviewed this report on Form N-CSR of Nuveen Corporate Income 2023 Target Term Fund;
2. Based on my knowledge, this report does not contain any untrue statement of a material fact or omit to state a material fact necessary to
make the statements made, in light of the circumstances under which such statements were made, not misleading with respect to the period covered by this report;
3. Based on my knowledge, the financial statements, and other financial information included in this report, fairly present in all material
respects the financial condition, results of operations, changes in net assets, and cash flows (if the financial statements are required to include a statement of cash flows) of the registrant as of, and for, the periods presented in this report;
4. The registrant’s other certifying officer and I are responsible for establishing and maintaining disclosure controls and
procedures (as defined in Rule 30a-3(c) under the Investment Company Act of 1940) and internal control over financial reporting (as defined in Rule 30a-3(d) under the Investment Company Act of 1940) for the registrant and have:
| |
a) |
|
designed such disclosure controls and procedures, or caused such disclosure controls and procedures to be designed under our supervision, to ensure that material information relating to the registrant, including its
consolidated subsidiaries, is made known to us by others within those entities, particularly during the period in which this report is being prepared; |
| |
b) |
|
designed such internal control over financial reporting, or caused such internal control over financial reporting to be designed under our supervision, to provide reasonable assurance regarding the reliability of
financial reporting and the preparation of financial statements for external purposes in accordance with generally accepted accounting principles; |
| |
c) |
|
evaluated the effectiveness of the registrant’s disclosure controls and procedures and presented in this report our conclusions about the effectiveness of the disclosure controls and procedures, as of a date within
90 days prior to the filing date of this report based on such evaluation; and |
| |
d) |
|
disclosed in this report any change in the registrant’s internal control over financial reporting that occurred during the period covered by this report that has materially affected, or is reasonably likely to
materially affect, the registrant’s internal control over financial reporting; and |
5. The registrant’s other
certifying officer and I have disclosed to the registrant’s auditors and the audit committee of the registrant’s board of directors (or persons performing the equivalent functions):
| |
a) |
|
all significant deficiencies and material weaknesses in the design or operation of internal control over financial reporting which are reasonably likely to adversely affect the registrant’s ability to record,
process, summarize, and report financial information; and |
| |
b) |
|
any fraud, whether or not material, that involves management or other employees who have a significant role in the registrant’s internal control over financial reporting. |
|
|
|
| Date: September 6, 2023 |
|
/s/ E. Scott Wickerham |
|
|
E. Scott Wickerham |
|
|
Vice President and Funds Controller |
|
|
(principal financial officer) |
EX-99.906CERT
CERTIFICATIONS PURSUANT TO SECTION 906 OF THE SARBANES-OXLEY ACT
Certification Pursuant to 18 U.S.C. 1350, as adopted pursuant to Section 906 of the Sarbanes-Oxley Act of 2002; provided by the Chief Executive Officer
and Chief Financial Officer, based on each such officer’s knowledge and belief.
The undersigned officers of Nuveen Corporate Income 2023 Target Term
Fund (the “Registrant”), certify that, to the best of each such officer’s knowledge and belief:
| |
1. |
|
The Form N-CSR of the Registrant for the period ended June 30, 2023 (the “Report”) fully complies with the requirements of Section 13(a) or 15(d) of the Securities Exchange Act of 1934; and
|
| |
2. |
|
The information contained in the Report fairly presents, in all material respects, the financial condition and results of operations of the Registrant. |
Date: September 6, 2023
|
| /s/ David J. Lamb |
| David J. Lamb |
| Chief Administrative Officer |
| (principal executive officer) |
|
| /s/ E. Scott Wickerham |
| E. Scott Wickerham |
| Vice President and Funds Controller |
| (principal financial officer) |
Nuveen Corporate Income ... (NYSE:JHAA)
Historical Stock Chart
Von Dez 2024 bis Jan 2025

Nuveen Corporate Income ... (NYSE:JHAA)
Historical Stock Chart
Von Jan 2024 bis Jan 2025
