Pay vs Performance Disclosure - USD ($)
|
12 Months Ended |
Dec. 31, 2023 |
Dec. 31, 2022 |
Dec. 31, 2021 |
Dec. 31, 2020 |
| Pay vs Performance Disclosure |
|
|
|
|
| Pay vs Performance Disclosure, Table |
Pay Versus Performance Table The following table sets forth information concerning the relationship between executive compensation actually paid to our Principal Executive Officer (PEO) and to other NEOs and certain financial performance of the Company for the years ended December 31, 2023, 2022 and 2021. For further information concerning the Company’s variable pay-for-performance philosophy and how the Company aligns executive compensation with the Company’s performance, refer to “Executive Compensation – Compensation Discussion and Analysis”. | | (a) | | | (b) | | | (c) | | | (d) | | | (e) | | | (f) | | | (g) | | | (h) | | | (i) | | | | 2023 | | | 7,820,387 | | | 9,217,272 | | | 2,490,942 | | | 2,834,781 | | | 175.50 | | | 96.73 | | | 261 | | | 635 | | | | 2022 | | | 2,106,406 | | | 1,419,262 | | | 937,368 | | | 764,417 | | | 138.29 | | | 88.19 | | | 390 | | | 570 | | | | 2021 | | | 10,991,346(7) | | | 11,198,243(7) | | | 3,089,441(7) | | | 3,111,001(7) | | | 145.74 | | | 105.12 | | | 495 | | | 607 | | | | 2020 | | | 4,624,167 | | | (1,699,838) | | | 1,522,770 | | | 179,947 | | | —(8) | | | —(8) | | | 80 | | | 440 | |
(1)
| The dollar amounts reported in this column (c) represent the amount of “compensation actually paid” to Mr. Rabiller, as computed in accordance with Item 402(v) of Regulation S-K. The dollar amounts do not reflect the actual amount of compensation earned by or paid to Mr. Rabiller during the applicable year. In accordance with the requirements of Item 402(v) of Regulation S-K, the following adjustments were made to Mr. Rabiller’s total compensation for each applicable year to determine the compensation actually paid. The assumptions used for determining the fair values shown in this table do not differ materially from those used to determine the fair values disclosed as of the grant date of such awards. |
| | PEO Summary Compensation Table Total (b) | | | 7,820,387 | | | | Aggregate Change in Actuarial Present Value of Pension Benefits (-) | | | 130,490 | | | | Actuarial Present Value of Pension Benefits Attributable to Service (+) | | | 99,540 | | | | Grant Date Fair Value of Stock and Option Awards (-) | | | 4,286,321 | | | | Fair Value at Year End of Outstanding and Unvested Equity Awards Granted in Year (+) | | | 4,883,866 | | | | Year over Year Change in Fair Value of Outstanding and Unvested Equity Awards (+) | | | 772,115 | | | | Fair Value as of Vesting Date of Equity Awards Granted and Vested in Year (+) | | | — | | | | Year over Year Change in Fair Value of Equity Awards Granted in Prior Years that Vested in Year (+) | | | 58,175 | | | | Fair Value at the end of the Prior Year of Equity Awards that Fail to Meet Vesting Conditions (-) | | | — | | | | Dollar Value of Dividends or Earnings Paid on Equity Awards Not Otherwise Included in Total Compensation (+) | | | — | | | | Compensation Actually Paid to PEO (c) | | | 9,217,272 | |
(2)
| The names of each of the NEOs (excluding Mr. Rabiller) included for purposes of calculating the average amounts in 2020 are as follows: Messrs. Alessandro Gil, Peter Bracke, Balis, Mabru and Maironi. The names of each of the NEOs (excluding Mr. Rabiller) included for purposes of calculating the average amounts in 2021, 2022 and 2023 are as follows: Messrs. Deason, Mabru, Balis, and Maironi. |
(3)
| The dollar amounts reported in this column (e) represent the average amount of “compensation actually paid” to the NEOs as a group (excluding Mr. Rabiller), as computed in accordance with Item 402(v) of Regulation S-K. The dollar amounts do not reflect the actual average amount of compensation earned by or paid to the NEOs as a group (excluding Mr. Rabiller) during the applicable year. In accordance with the requirements of Item 402(v) of Regulation S-K, the following adjustments were made to average total compensation for the NEOs as a group (excluding Mr. Rabiller) for each year to determine the compensation actually paid, using the same methodology described above in Note 1. The assumptions used for determining the fair values shown in this table do not differ materially from those used to determine the fair values disclosed as of the grant date of such awards. |
| | Average Summary Compensation Table Total for Non-PEO NEOs (d) | | | 2,490,942 | | | | Aggregate Change in Actuarial Present Value of Pension Benefits (-) | | | 116,345 | | | | Actuarial Present Value of Pension Benefits Attributable to Service (+) | | | 101,529 | | | | Grant Date Fair Value of Stock and Option Awards (-) | | | 1,128,256 | | | | Fair Value at Year End of Outstanding and Unvested Equity Awards Granted in Year (+) | | | 1,285,543 | | | | Year over Year Change in Fair Value of Outstanding and Unvested Equity Awards (+) | | | 187,259 | | | | Fair Value as of Vesting Date of Equity Awards Granted and Vested in Year (+) | | | — | | | | Year over Year Change in Fair Value of Equity Awards Granted in Prior Years that Vested in Year (+) | | | 14,109 | | | | Fair Value at the end of the Prior Year of Equity Awards that Fail to Meet Vesting Conditions (-) | | | — | | | | Dollar Value of Dividends or Earnings Paid on Equity Awards Not Otherwise Included in Total Compensation (+) | | | — | | | | Average Compensation Actually Paid to Non-PEO NEOs (e) | | | 2,834,781 | |
(4)
| The peer group used for this purpose consists of Adient plc, Allison Transmission Holdings, Inc., American Axle & Manufacturing Holdings, Inc., Aptiv PLC, Autoliv Inc., BorgWarner Inc., Dana Incorporated, Gentex Corporation, Lear Corporation, Magna International Inc. and Visteon Corporation (the “Peer Group”), which are the peer group companies indicated in our Annual Report on Form 10-K for the year ended December 31, 2023 filed with the SEC on February 15, 2024. |
(5)
| The dollar amounts reported in this column (h) represent the amount of net income reflected in our audited financial statements for the applicable year. |
(6)
| Adjusted EBITDA is defined as our net income calculated in accordance with U.S. GAAP, plus the sum of interest expense net of interest income, tax expense and depreciation, further adjusted for capital structure transformation costs, stock compensation expense, non-operating income/expense, repositioning costs, discounting costs on factoring, and foreign exchange gain/loss on debt net of related hedging gains/losses. While the Company uses numerous financial and non-financial performance measures for the purpose of evaluating performance for the Company’s compensation programs, the Company has determined that Adjusted EBITDA is the financial performance measure that, in the Company’s assessment, represents the most important performance measure (that is not otherwise required to be disclosed in the table) used by the company to link compensation actually paid to the company’s NEOs, for the most recently completed fiscal year, to company performance. |
(7)
| The dollar amounts reported as compensation to our NEOs in 2021 is significantly larger than the compensation in 2020 or 2022 as a result of the Emergence Grants made to our NEOs in 2021. Each Emergence Grant was sized in excess of a standard annual grant in order to align incentives as of the Company’s Emergence and with the intention of covering equity grants for fiscal years 2021 and 2022. Accordingly, no equity grants were made for fiscal year 2022. |
(8)
| In accordance with SEC guidance, we have reported in columns (f) and (g) the cumulative TSR and weighted peer group TSR measured only from April 30, 2021, which is the date the Company began issuing the new class of common stock pursuant to the Revised Amended Plan of Reorganization following the Company’s Emergence, to December 31, 2022. |
|
|
|
|
| Company Selected Measure Name |
Adjusted EBITDA
|
|
|
|
| Named Executive Officers, Footnote |
(1)
| The dollar amounts reported in this column (c) represent the amount of “compensation actually paid” to Mr. Rabiller, as computed in accordance with Item 402(v) of Regulation S-K. The dollar amounts do not reflect the actual amount of compensation earned by or paid to Mr. Rabiller during the applicable year. In accordance with the requirements of Item 402(v) of Regulation S-K, the following adjustments were made to Mr. Rabiller’s total compensation for each applicable year to determine the compensation actually paid. The assumptions used for determining the fair values shown in this table do not differ materially from those used to determine the fair values disclosed as of the grant date of such awards. |
(2)
| The names of each of the NEOs (excluding Mr. Rabiller) included for purposes of calculating the average amounts in 2020 are as follows: Messrs. Alessandro Gil, Peter Bracke, Balis, Mabru and Maironi. The names of each of the NEOs (excluding Mr. Rabiller) included for purposes of calculating the average amounts in 2021, 2022 and 2023 are as follows: Messrs. Deason, Mabru, Balis, and Maironi. |
|
|
|
|
| Peer Group Issuers, Footnote |
(4)
| The peer group used for this purpose consists of Adient plc, Allison Transmission Holdings, Inc., American Axle & Manufacturing Holdings, Inc., Aptiv PLC, Autoliv Inc., BorgWarner Inc., Dana Incorporated, Gentex Corporation, Lear Corporation, Magna International Inc. and Visteon Corporation (the “Peer Group”), which are the peer group companies indicated in our Annual Report on Form 10-K for the year ended December 31, 2023 filed with the SEC on February 15, 2024. |
|
|
|
|
| PEO Total Compensation Amount |
$ 7,820,387
|
$ 2,106,406
|
$ 10,991,346
|
$ 4,624,167
|
| PEO Actually Paid Compensation Amount |
$ 9,217,272
|
1,419,262
|
11,198,243
|
(1,699,838)
|
| Adjustment To PEO Compensation, Footnote |
(1)
| The dollar amounts reported in this column (c) represent the amount of “compensation actually paid” to Mr. Rabiller, as computed in accordance with Item 402(v) of Regulation S-K. The dollar amounts do not reflect the actual amount of compensation earned by or paid to Mr. Rabiller during the applicable year. In accordance with the requirements of Item 402(v) of Regulation S-K, the following adjustments were made to Mr. Rabiller’s total compensation for each applicable year to determine the compensation actually paid. The assumptions used for determining the fair values shown in this table do not differ materially from those used to determine the fair values disclosed as of the grant date of such awards. |
| | PEO Summary Compensation Table Total (b) | | | 7,820,387 | | | | Aggregate Change in Actuarial Present Value of Pension Benefits (-) | | | 130,490 | | | | Actuarial Present Value of Pension Benefits Attributable to Service (+) | | | 99,540 | | | | Grant Date Fair Value of Stock and Option Awards (-) | | | 4,286,321 | | | | Fair Value at Year End of Outstanding and Unvested Equity Awards Granted in Year (+) | | | 4,883,866 | | | | Year over Year Change in Fair Value of Outstanding and Unvested Equity Awards (+) | | | 772,115 | | | | Fair Value as of Vesting Date of Equity Awards Granted and Vested in Year (+) | | | — | | | | Year over Year Change in Fair Value of Equity Awards Granted in Prior Years that Vested in Year (+) | | | 58,175 | | | | Fair Value at the end of the Prior Year of Equity Awards that Fail to Meet Vesting Conditions (-) | | | — | | | | Dollar Value of Dividends or Earnings Paid on Equity Awards Not Otherwise Included in Total Compensation (+) | | | — | | | | Compensation Actually Paid to PEO (c) | | | 9,217,272 | |
|
|
|
|
| Non-PEO NEO Average Total Compensation Amount |
$ 2,490,942
|
937,368
|
3,089,441
|
1,522,770
|
| Non-PEO NEO Average Compensation Actually Paid Amount |
$ 2,834,781
|
764,417
|
3,111,001
|
179,947
|
| Adjustment to Non-PEO NEO Compensation Footnote |
(3)
| The dollar amounts reported in this column (e) represent the average amount of “compensation actually paid” to the NEOs as a group (excluding Mr. Rabiller), as computed in accordance with Item 402(v) of Regulation S-K. The dollar amounts do not reflect the actual average amount of compensation earned by or paid to the NEOs as a group (excluding Mr. Rabiller) during the applicable year. In accordance with the requirements of Item 402(v) of Regulation S-K, the following adjustments were made to average total compensation for the NEOs as a group (excluding Mr. Rabiller) for each year to determine the compensation actually paid, using the same methodology described above in Note 1. The assumptions used for determining the fair values shown in this table do not differ materially from those used to determine the fair values disclosed as of the grant date of such awards. |
| | Average Summary Compensation Table Total for Non-PEO NEOs (d) | | | 2,490,942 | | | | Aggregate Change in Actuarial Present Value of Pension Benefits (-) | | | 116,345 | | | | Actuarial Present Value of Pension Benefits Attributable to Service (+) | | | 101,529 | | | | Grant Date Fair Value of Stock and Option Awards (-) | | | 1,128,256 | | | | Fair Value at Year End of Outstanding and Unvested Equity Awards Granted in Year (+) | | | 1,285,543 | | | | Year over Year Change in Fair Value of Outstanding and Unvested Equity Awards (+) | | | 187,259 | | | | Fair Value as of Vesting Date of Equity Awards Granted and Vested in Year (+) | | | — | | | | Year over Year Change in Fair Value of Equity Awards Granted in Prior Years that Vested in Year (+) | | | 14,109 | | | | Fair Value at the end of the Prior Year of Equity Awards that Fail to Meet Vesting Conditions (-) | | | — | | | | Dollar Value of Dividends or Earnings Paid on Equity Awards Not Otherwise Included in Total Compensation (+) | | | — | | | | Average Compensation Actually Paid to Non-PEO NEOs (e) | | | 2,834,781 | |
|
|
|
|
| Compensation Actually Paid vs. Total Shareholder Return |
Analysis of the Information Presented in the Pay versus Performance Table In accordance with Item 402(v) of Regulation S-K, the Company is providing the following descriptions of the relationships between information presented in the Pay versus Performance table. Cumulative TSR of the Company and Cumulative TSR of the Peer Group In accordance with SEC guidance, we have calculated our own cumulative TSR and the weighted peer group TSR from April 30, 2021 through December 31, 2021 and, further, through December 31, 2023. We use April 30, 2021 as the starting point because this is the date the Company began trading under its new class of common stock upon its Emergence. 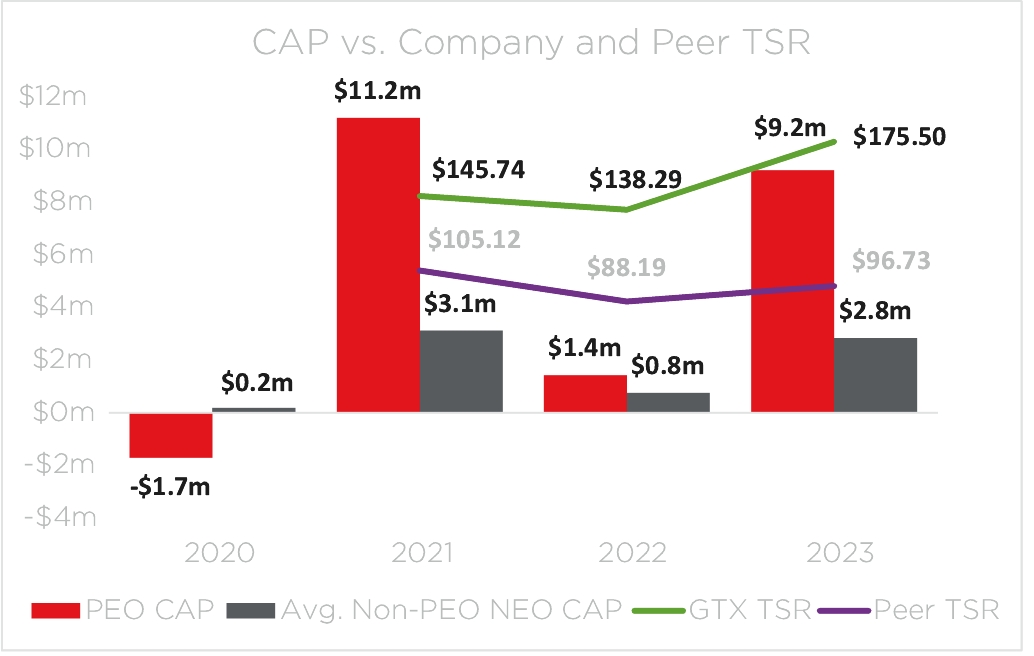
|
|
|
|
| Compensation Actually Paid vs. Net Income |
Analysis of the Information Presented in the Pay versus Performance Table In accordance with Item 402(v) of Regulation S-K, the Company is providing the following descriptions of the relationships between information presented in the Pay versus Performance table. Compensation Actually Paid and Net Income As demonstrated by the following table, the amount of compensation actually paid (CAP) to Mr. Rabiller and the average amount of compensation actually paid to the Company’s NEOs as a group (excluding Mr. Rabiller, “Avg. Non-PEO NEO CAP”) is generally aligned with the Company’s net income over the four years presented in the table. While the Company does not use net income as a performance measure in the overall executive compensation program, the measure of net income is correlated with the measure Adjusted EBITDA, which the Company does use for when setting goals in the Company’s short-term incentive compensation program and the performance-based RSUs that are awarded to the NEOs. 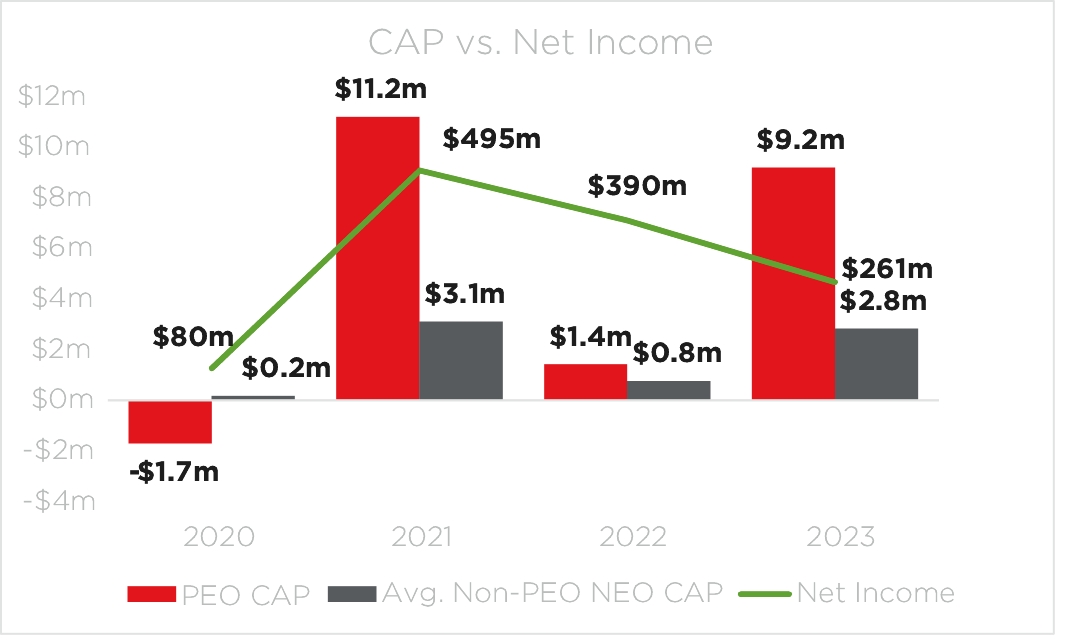
|
|
|
|
| Compensation Actually Paid vs. Company Selected Measure |
Analysis of the Information Presented in the Pay versus Performance Table In accordance with Item 402(v) of Regulation S-K, the Company is providing the following descriptions of the relationships between information presented in the Pay versus Performance table. Compensation Actually Paid and Adjusted EBITDA As demonstrated by the following graph, the amount of compensation actually paid to Mr. Rabiller and the average amount of compensation actually paid to the Company’s NEOs as a group (excluding Mr. Rabiller) is generally aligned with the Company’s Adjusted EBITDA over the four years presented in the table. 
|
|
|
|
| Total Shareholder Return Vs Peer Group |
Analysis of the Information Presented in the Pay versus Performance Table In accordance with Item 402(v) of Regulation S-K, the Company is providing the following descriptions of the relationships between information presented in the Pay versus Performance table. Cumulative TSR of the Company and Cumulative TSR of the Peer Group In accordance with SEC guidance, we have calculated our own cumulative TSR and the weighted peer group TSR from April 30, 2021 through December 31, 2021 and, further, through December 31, 2023. We use April 30, 2021 as the starting point because this is the date the Company began trading under its new class of common stock upon its Emergence.
|
|
|
|
| Tabular List, Table |
Financial Performance Measures As described in greater detail in “Executive Compensation – Compensation Discussion and Analysis,” the Company’s executive compensation program reflects a variable pay-for-performance philosophy. The metrics that the Company uses for both our long-term and short-term incentive awards are selected based on an objective of incentivizing our NEOs to increase the value of our enterprise for our shareholders. The following were the most important financial performance measures used by the Company to link executive compensation actually paid to the Company’s NEOs, for the most recently completed fiscal year, to the Company’s performance: • | Adjusted Free Cash Flow Conversion |
|
|
|
|
| Total Shareholder Return Amount |
$ 175.5
|
138.29
|
145.74
|
0
|
| Peer Group Total Shareholder Return Amount |
96.73
|
88.19
|
105.12
|
0
|
| Net Income (Loss) |
$ 261,000,000
|
$ 390,000,000
|
$ 495,000,000
|
$ 80,000,000
|
| Company Selected Measure Amount |
635,000,000
|
570,000,000
|
607,000,000
|
440,000,000
|
| PEO Name |
Mr. Rabiller
|
Mr. Rabiller
|
Mr. Rabiller
|
Mr. Rabiller
|
| Measure:: 1 |
|
|
|
|
| Pay vs Performance Disclosure |
|
|
|
|
| Name |
Adjusted EBITDA
|
|
|
|
| Measure:: 2 |
|
|
|
|
| Pay vs Performance Disclosure |
|
|
|
|
| Name |
Adjusted EBITDA Margin
|
|
|
|
| Measure:: 3 |
|
|
|
|
| Pay vs Performance Disclosure |
|
|
|
|
| Name |
Adjusted Free Cash Flow Conversion
|
|
|
|
| PEO | Aggregate Change in Actuarial Present Value of Pension Benefits [Member] |
|
|
|
|
| Pay vs Performance Disclosure |
|
|
|
|
| Adjustment to Compensation, Amount |
$ (130,490)
|
|
|
|
| PEO | Actuarial Present Value of Pension Benefits Attributable to Service [Member] |
|
|
|
|
| Pay vs Performance Disclosure |
|
|
|
|
| Adjustment to Compensation, Amount |
99,540
|
|
|
|
| PEO | Grant Date Fair Value of Stock and Option Awards [Member] |
|
|
|
|
| Pay vs Performance Disclosure |
|
|
|
|
| Adjustment to Compensation, Amount |
(4,286,321)
|
|
|
|
| PEO | Fair Value at Year End of Outstanding and Unvested Equity Awards Granted in Year [Member] |
|
|
|
|
| Pay vs Performance Disclosure |
|
|
|
|
| Adjustment to Compensation, Amount |
4,883,866
|
|
|
|
| PEO | Year over Year Change in Fair Value of Outstanding and Unvested Equity Awards [Member] |
|
|
|
|
| Pay vs Performance Disclosure |
|
|
|
|
| Adjustment to Compensation, Amount |
772,115
|
|
|
|
| PEO | Fair Value as of Vesting Date of Equity Awards Granted and Vested in Year [Member] |
|
|
|
|
| Pay vs Performance Disclosure |
|
|
|
|
| Adjustment to Compensation, Amount |
0
|
|
|
|
| PEO | Year over Year Change in Fair Value of Equity Awards Granted in Prior Years that Vested in Year [Member] |
|
|
|
|
| Pay vs Performance Disclosure |
|
|
|
|
| Adjustment to Compensation, Amount |
58,175
|
|
|
|
| PEO | Fair Value at the End of the Prior Year of Equity Awards that Fail to Meet Vesting Conditions [Member] |
|
|
|
|
| Pay vs Performance Disclosure |
|
|
|
|
| Adjustment to Compensation, Amount |
0
|
|
|
|
| PEO | Dollar Value of Dividends or Earnings Paid on Equity Awards not Otherwise Included in Total Compensation [Member] |
|
|
|
|
| Pay vs Performance Disclosure |
|
|
|
|
| Adjustment to Compensation, Amount |
0
|
|
|
|
| Non-PEO NEO | Aggregate Change in Actuarial Present Value of Pension Benefits [Member] |
|
|
|
|
| Pay vs Performance Disclosure |
|
|
|
|
| Adjustment to Compensation, Amount |
(116,345)
|
|
|
|
| Non-PEO NEO | Actuarial Present Value of Pension Benefits Attributable to Service [Member] |
|
|
|
|
| Pay vs Performance Disclosure |
|
|
|
|
| Adjustment to Compensation, Amount |
101,529
|
|
|
|
| Non-PEO NEO | Grant Date Fair Value of Stock and Option Awards [Member] |
|
|
|
|
| Pay vs Performance Disclosure |
|
|
|
|
| Adjustment to Compensation, Amount |
(1,128,256)
|
|
|
|
| Non-PEO NEO | Fair Value at Year End of Outstanding and Unvested Equity Awards Granted in Year [Member] |
|
|
|
|
| Pay vs Performance Disclosure |
|
|
|
|
| Adjustment to Compensation, Amount |
1,285,543
|
|
|
|
| Non-PEO NEO | Year over Year Change in Fair Value of Outstanding and Unvested Equity Awards [Member] |
|
|
|
|
| Pay vs Performance Disclosure |
|
|
|
|
| Adjustment to Compensation, Amount |
187,259
|
|
|
|
| Non-PEO NEO | Fair Value as of Vesting Date of Equity Awards Granted and Vested in Year [Member] |
|
|
|
|
| Pay vs Performance Disclosure |
|
|
|
|
| Adjustment to Compensation, Amount |
0
|
|
|
|
| Non-PEO NEO | Year over Year Change in Fair Value of Equity Awards Granted in Prior Years that Vested in Year [Member] |
|
|
|
|
| Pay vs Performance Disclosure |
|
|
|
|
| Adjustment to Compensation, Amount |
14,109
|
|
|
|
| Non-PEO NEO | Fair Value at the End of the Prior Year of Equity Awards that Fail to Meet Vesting Conditions [Member] |
|
|
|
|
| Pay vs Performance Disclosure |
|
|
|
|
| Adjustment to Compensation, Amount |
0
|
|
|
|
| Non-PEO NEO | Dollar Value of Dividends or Earnings Paid on Equity Awards not Otherwise Included in Total Compensation [Member] |
|
|
|
|
| Pay vs Performance Disclosure |
|
|
|
|
| Adjustment to Compensation, Amount |
$ 0
|
|
|
|