Osmosis Rally Intensifies With 77% Increase – Will OSMO Hit $2 This Month?
16 Dezember 2023 - 11:03AM
NEWSBTC
The price movement of OSMO has demonstrated significant volatility,
moving through a largely bearish trend for the most part of the
year. But in the last three months, the cryptocurrency has shown
signs of a strong comeback and is now entering a phase of strong
recovery. Currently, a wide range of technical indicators are
available to traders, each of which presents a complex picture of
the possible future paths for the OSMO price. Together, these
signals create a mosaic of information that help traders traverse
the complicated environment in which they must predict and react to
market movements. Osmosis Price Explodes In The Weekly
Timeframe Osmosis is a well-known player in the
cryptocurrency ecosystem and one of the main forces shaping the
market environment. Its native token, OSMO, has seen a significant
increase, crossing the $1 threshold and hitting its highest worth
since July. Related Reading: Why BONK Keeps On Rising, Price
Explodes 124% Today – Here’s The Scoop At the time of writing, OSMO
was trading at $1.46, up 14.1% in the last 24 hours, and tallied a
commanding 76.3% rally in the last seven days, data from Coingecko
shows. OSMO price action in the last 24 hours. Source: Coingecko
Osmosis’s successful merger with Umee, another prominent Cosmos
network with assets exceeding $17 million, is partly responsible
for the company’s strong performance. The token has experienced a
remarkable rise, rising by almost 380% from its lowest point in
2023, in accordance with the merger’s plans. Osmosis currently
trading at $1.4645 territory. Chart: TradingView.com With assets
over $142 million, Osmosis holds a strong position, according to
data from DeFi Llama. Furthermore, in the last 24 hours, the
platform has enabled transactions totaling more than $64 million in
token value, demonstrating its significant impact and activity in
the decentralized finance domain. A number of the Cosmos
ecosystem’s constituent parts are thriving. Notably, THORChain has
become one of the biggest players in the world of decentralized
exchanges, or DEXs, and has emerged as a major participant in this
space. OSMO seven-day price action. Source: CoinMarketCap Will OSMO
Reach $2? With a solid total value locked (TVL) of more
than $915 million and available liquidity of more than $336
million, THORChain has cemented its place as a major participant in
the independent financial market. The cumulative validator bond has
risen significantly, exceeding the remarkable $578 million mark.
Concurrently, the unique swapper community has expanded
tremendously, to include over 88,000 members. Related Reading:
Terra Luna Classic Rockets Over 300% And Collapses — More Pain
Ahead? In a related breakthrough, the Interblockchain Communication
Protocol (IBC) has secured assets worth over $30 billion spanning a
vast network of more than 100 chains, demonstrating its strong
functioning. This emphasizes how crucial the protocol is to
enabling smooth communication and interoperability across various
blockchain ecosystems. One notable newcomer to the Cosmos scene is
Namada, a layer-1 network with cutting-edge interchain privacy
capabilities. By introducing cutting-edge technologies to improve
privacy and increase the capabilities of interchain communication,
this introduction further improves the Cosmos ecosystem. With a
compelling 72% surge, the Osmosis rally is sparking speculation
about OSMO hitting $2 this month. Fueled by strategic mergers and a
resilient ecosystem, OSMO’s upward momentum is closely watched by
traders and enthusiasts, adding an exciting dimension to its
evolving narrative in the cryptocurrency market. Featured image
from Shutterstock
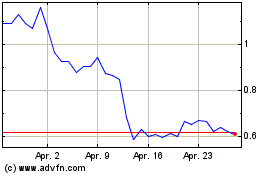
Terra (COIN:LUNAUSD)
Historical Stock Chart
Von Dez 2024 bis Jan 2025

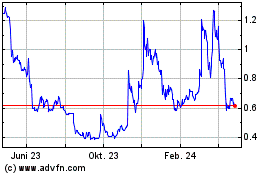
Terra (COIN:LUNAUSD)
Historical Stock Chart
Von Jan 2024 bis Jan 2025
