Investors Are Digging Gold, and Gold Miners, Again --Update
18 Oktober 2018 - 8:24PM
Dow Jones News
By Riva Gold
In times of market turmoil, investors often embrace gold. And
when that happens, gold-mining stocks tend to do even better.
That has certainly been the case so far this month. New York
gold futures are up about 3% so far in October versus a roughly 4%
decline for the S&P 500. Shares of many of the world's biggest
gold miners, meanwhile, have notched double-digit gains.
Companies like Toronto's Barrick Gold Corp, South Africa's
AngloGold Ashanti and Acacia Mining are all up around 15% to 19%
after a bruising summer. The VanEck Vectors Gold Miners
exchange-traded fund and the iShares MSCI Global Gold Miners fund
-- which track indexes of global gold-mining firms -- are up around
9% to 11% this month.
Gold-miner stocks allow investors to double down on bets the
gold price will rise. These companies have higher fixed-investment
costs and can become much more profitable when gold prices climb.
Many of these companies pay out hefty dividends, too.
An added bonus: Hopes for further consolidation are adding to
the momentum after Barrick Gold in September agreed to buy Randgold
Resources Ltd. for $6 billion.
Investors have poured $278 million into the VanEck gold miner
ETF over the past month, according to FactSet, while flows into
EPFR-tracked gold funds climbed to an 11-week high last week.
Gold miners' rapid ascent during the selloff marks a turnaround
from other recent episodes of market turbulence. While gold and
related assets have historically been used as safe places to invest
during times of economic or political stress, they found few fans
during the downturn at the start of the year or during the summer
turmoil in emerging markets.
Because concerns largely centered around the prospect of rising
U.S. interest rates, investors sought shelter in the U.S. dollar
instead, in turn making gold less attractive to overseas buyers.
The ICE Dollar Index rose about 9% between February and the middle
of August, while New York gold futures fell about 12% and the
VanEck gold miner fund fell about 20%. Rising rates also make
assets like gold less attractive, because they don't offer a
yield.
And both gold and miners haven't fared so well in recent years.
From highs in 2011, prices of the metal and the VanEck ETF are down
around 35% and 70%, respectively. The iShares fund has also tumbled
about 70% since its inception in 2012, and was hovering around its
lowest since 2016 in September.
This time is different. The ICE Dollar Index has barely budged
during this month's selloff, the Federal Reserve's plans for
interest rates are well telegraphed and investors have turned
skeptical that the dollar has much further room to rise.
Speculators' long positions on the dollar have been fairly
stable since August, data from the Commodity Futures Trading
Commission suggests.
"Given the strength of the U.S. dollar we've seen and slight
concern now about the fiscal position in the U.S. following
stimulus measures and tax reform, there's some concern around the
U.S. dollar as an ultimate safe haven," said Roger Jones, head of
equities at London & Capital.
The U.S. government ran its largest budget deficit in six years
during the fiscal year that ended last month, totaling $779
billion.
Meanwhile, "this [selloff] is more about a growth scare than
February-March, when it was more about a rate-hike scare," Mr.
Jones said. "If there's another slowdown in growth, gold-mining
stocks will be at the forefront of investors' minds."
Fund managers surveyed by Bank of America Merrill Lynch in
October were the most bearish on global growth since 2008.
Earlier this month, the International Monetary Fund lowered its
forecasts for global economic growth this year and next, citing a
rise in trade protectionism and concerns about emerging
markets.
Write to Riva Gold at riva.gold@wsj.com
(END) Dow Jones Newswires
October 18, 2018 14:09 ET (18:09 GMT)
Copyright (c) 2018 Dow Jones & Company, Inc.
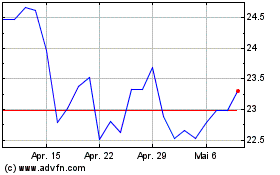
Barrick Gold (TSX:ABX)
Historical Stock Chart
Von Mär 2024 bis Apr 2024

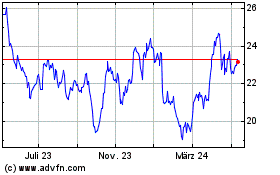
Barrick Gold (TSX:ABX)
Historical Stock Chart
Von Apr 2023 bis Apr 2024
