TransUnion today released the findings of its Q1 2023 Credit
Industry Insights Report (CIIR), which shows that the Canadian
credit market remains resilient despite the current high cost of
living and elevated interest rates.
As part of the CIIR, TransUnion maps consumer
credit market health with its Credit Industry Indicator (CII). The
CII is a country-specific measure of consumer credit health trends,
focusing on four pillars: demand, supply, consumer behaviour and
performance. The CII for Q1 of 2023 in Canada reached 106 in March
2023, hitting close to the pre-pandemic level observed in March
2019, and slightly above the prior year level in March 2022.
Canadian Credit Industry Indicator Q1 of
2023i
| Source: TransUnion Canada consumer credit
database. |
|
(i) |
|
A lower CII
number compared to the prior period represents a decline in credit
health, while a higher number reflects an improvement. The CII
number needs to be looked at in relation to the previous period(s)
and not in isolation. In March 2023, the CII of 106 represented an
improvement in credit health compared to the same month prior year
(March 2022) and a slight increase in credit health compared to the
prior quarter (December 2022). |
The slight year-over-year (YoY) increase in the
CII was driven by a 3.1% increase in the number of consumers
carrying a balance from the previous quarter (Q4 2022), as well as
continued growth in consumer credit balances. The positive impact
from overall balance growth was slightly offset by slowing overall
demand for new credit.
Origination growth and increased credit
participation drove increased balancesAs the cost of
living rose, many Canadians turned to credit to alleviate financial
pressures. Canadians continued to build debt, as total outstanding
balances across all products increased by 5.6%, reaching a new
record of $2.32 trillion. While overall debt continued to rise in
Canada, it is important to understand the composition of the
increased balances.
Credit participation (the number of Canadians
with access to credit) grew by 2.9% YoY, as the number of Canadians
with access to credit rose to 30.6 million in Q1 2023. At the same
time, the number of consumers carrying a credit balance rose 3.1%
YoY in Q1 2023. While the number of credit-active consumers
increased across most risk tiers, the number of subprime consumers
accounted for the largest increase, growing at 8.3% YoY. While this
riskier segment had the highest rate of growth, prime and better
consumers still represent nearly three-quarters of total consumers
with a balance, indicating a relatively healthy risk distribution
of the consumer credit population.
| Consumers
with a Balance By Risk Tier, as of Q1 2023 |
|
|
|
|
|
|
Risk Tier* |
Number of Consumerswith a Balance |
YoY Growth |
Percentage of TotalCredit Population |
|
Super prime |
11.6 M |
5.00% |
41.40% |
|
Prime plus |
4.2 M |
-5.6% |
14.90% |
|
Prime |
4.4 M |
3.50% |
15.60% |
|
Near prime |
5.3 M |
3.40% |
18.80% |
|
Subprime |
2.6 M |
8.30% |
9.30% |
Another key contributor to the increase in
overall debt is the growth in origination volumes – i.e. consumers
acquiring additional credit products. Origination volumes increased
6.2% YoY, primarily driven by a surge in credit card originations
to new-to-credit consumers (a combination of Gen Z consumers
entering the credit market and new Canadians) which grew by 85% YoY
in 2022. Overall, card originations were 20% higher YoY in Q4 2022,
driven by a 24% increase in originations by prime and above
consumers, with originations to below prime consumers having
increased by 9% YoY. Prime and above consumers accounted for
two-thirds of all new card originations during 2022.
Mortgage origination, which experienced record
growth rates through 2021 and early 2022, continued to decline,
dropping 32% YoY as increasing interest rates significantly slowed
demand for new mortgages, especially in the refinance market.
As credit activity increased,
performance moved closer to pre-pandemic levelsHigher
overall credit balances as well as higher interest rates also drove
higher minimum monthly payment obligations, requiring many
consumers to direct additional disposable income to cover the
minimum required payments – particularly on mortgages and lines of
credit. Both mortgages and lines of credit are particularly
sensitive to interest rate changes, and rising rates continue to
exert pressure on these borrowers. The average line of credit
monthly payment due increased to $436 (+43% YoY) and the average
monthly mortgage payment rose to $2,032 (+16% YoY). The impact of
rate increases will continue to put pressure on mortgage borrowers
over the next year as homeowners open or renew their mortgage terms
at higher rates.
While higher balances and rising interest rates
have increased payment obligations, aggregate excess payment (the
amount consumers pay on their revolving accounts over the minimum
required) recorded 7% higher YoY levels for below prime consumers
and 11% YoY higher levels for prime and better consumers in Q1
2023. These increases indicate that consumers are continuing to pay
more than the minimum required – the average payment for credit
cards is 2.6x over the minimum required. This is a positive sign
indicating healthy consumer behaviors towards their payment
obligations.
As the Canadian market has expanded and more
consumers have entered the credit market and built balances, a
corresponding uptick in delinquency would be expected. Overall
consumer-level serious delinquency (the percentage of consumers 90
or more days past due on any account) increased by 9 bps to 1.57%;
however, it is important to note that despite this increase,
overall delinquency levels remain below pre-pandemic levels.
Bankcard serious consumer-level delinquency
rates (90+ DPD) continued to increase, up 8 bps from prior year to
0.76%. It is important to take into account the significant
origination growth seen over the past several quarters as a driving
factor of this increase.
Unsecured personal loan delinquencies also
continued to trend higher: serious consumer-level delinquency rates
(60+ DPD) have exceeded pre-pandemic levels, up 71 bps YoY to 2.09%
in Q1 2023 (consumer 60+ DPD delinquency was 1.35% in Q1 2019).
Recent origination history for this product has been heavily
weighted to below prime consumers, which is likely driving
worsening performance.
Serious account-level delinquency (60+ DPD) for
auto reached 0.78% in Q1 2023, up 10 bps YoY, which is a relatively
low rate despite the increase, and still below pre-pandemic
levels.
“Overall, the financial position of Canadian
credit consumers improved coming out of the pandemic, bolstered by
higher savings accumulated through the pandemic and supported by a
strong labour market,” said Matt Fabian, Director of financial
services research and consulting at TransUnion in Canada.
“However, the longer the current conditions of
elevated inflation and higher interest rates persist, the more
likely it is that a segment of more vulnerable consumers may
increasingly feel the pinch. Especially impacted may be
variable-rate mortgage-holders as they reach their trigger rate,
and fixed-rate mortgage-holders near the end of their terms. As
available disposable incomes become more stretched, we expect a
segment of consumers will be more likely to miss payments, and as a
result, that delinquency rates will rise,” he added. “However, we
expect any rise in delinquency rates to be moderate and in line
with increased credit activity.”
What lies ahead for Canadian consumers
in 2023 and into 2024? Given the economic uncertainty and
to provide insights into what to expect for credit market health,
TransUnion recently forecasted origination, balance and delinquency
trends for the remainder of 2023 to Q1 2024, drawing on its
extensive data and research resources.
“We anticipate the next 12 months to be
characterized by a ‘continued resiliency meets financial fragility’
mindset. Trends for 2023 are likely to be mixed, based on
consumers’ risk profiles and the uneven impact of higher inflation
and interest rates, offset by softer than anticipated activity,
recession, and slight recovery in early 2024, as well as a strong
labour market,” Fabian said.
TransUnion forecasts growth in new account
originations across all products through 2024, driven by a
combination of increased demand and a stabilizing interest rate
environment. The forecast anticipates lenders to continue to pursue
profitable growth, i.e. that there will be continued expansion in
lending with strategically managed growth and risk.
The credit card segment will remain very
competitive as issuers compete for share with new offers in the
market. TransUnion forecasts continued growth for credit cards with
strong origination volumes through to Q1 2024 for both prime and
below (up +3.5% YoY) as well as above prime segments (+11.8% YoY),
and expects to see growth in balances. The forecast shows a slight
uptick in delinquency, back to pre-pandemic levels, to 2.19% in Q1
2024 (+16 bps YoY).
Auto loan growth is expected to be skewed toward
riskier borrowers – prime and below risk tiers – with originations
in that segment growing 4.3% as vehicle inventories continue to
return to normal. This demand and the continued shift toward higher
average purchase price will drive loan sizes up by 2.8% for prime
and below in Q1 2024, while above prime balance growth is likely to
remain relatively flat YoY. Delinquency rates are expected to
improve slightly in the prime and below segment – likely down 14
bps YoY to 2.27% – as more recent acquisitions have skewed away
from below prime borrowers.
The prospect of interest rates holding steady
and potentially lowering into 2024 is expected to help revitalize
the personal loan market, as a more favourable interest rate
environment will allow lenders to expand and grow their portfolios
following their caution coming out of the pandemic. Acquisition is
forecast to grow by 16% YoY in Q1 2024, driven by a return to below
prime lending. In addition, balance growth is likely to be up 7%
for below prime consumers and up 29% for prime and better. This
increased activity is likely to drive higher delinquencies, with
serious delinquency rates forecast to rise 13 bps to 2.27%.
As the Bank of Canada pauses interest rate
hikes, a resurgence in housing demand combined with continued low
inventory will drive increased activity in Canada’s housing market,
which will in turn drive mortgage origination volume and balance
growth. TransUnion expects a 38% increase in origination volumes
from the first quarter of 2023 to the first quarter of 2024, with
the concentration of new originations skewed to prime and better
consumers. In line with home values, outstanding mortgage average
balance growth of up to 5% is also forecast in the first quarter of
2024.
For more information about the Q1 2023 Credit Industry Insights
Report, please click here.
*According to TransUnion CreditVision® risk score: Subprime =
300-639; Near prime = 640-719; Prime = 720-759; Prime plus =
760-799; Super prime = 800+
About TransUnion (NYSE: TRU)
TransUnion is a global information and insights
company that makes trust possible in the modern economy. We do this
by providing an actionable picture of each person so they can be
reliably represented in the marketplace. As a result, businesses
and consumers can transact with confidence and achieve great
things. We call this Information for Good®. TransUnion provides
solutions that help create economic opportunity, great experiences
and personal empowerment for hundreds of millions of people in more
than 30 countries. Our customers in Canada comprise some of the
nation’s largest banks and card issuers, and TransUnion is a major
credit reporting, fraud, and analytics solutions provider across
the finance, retail, telecommunications, utilities, government and
insurance sectors.
For more information or to request an interview,
contact:
Contact: Emma TiessenE-mail
Emma.Tiessen@ketchum.comTelephone 647-523-1594
A photo accompanying this announcement is available at
https://www.globenewswire.com/NewsRoom/AttachmentNg/11c651e9-32a2-4b71-8c7f-c5e868eb8c2d
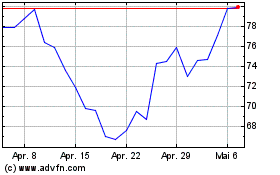
TransUnion (NYSE:TRU)
Historical Stock Chart
Von Mär 2024 bis Apr 2024

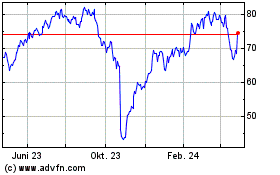
TransUnion (NYSE:TRU)
Historical Stock Chart
Von Apr 2023 bis Apr 2024
