Reserve Right Token Spikes Leaving Many In Euphoria, Eyes $0.01
23 September 2022 - 4:07PM
NEWSBTC
RSR price holds above daily 50 EMA as price eyes $0.01 Price
continues to look bullish, holding above key support areas RSR
price breaks out of daily asymmetric triangle with high buy
orders. Reserve Right (RSR) token price has had a rough time
in recent weeks breaking out of its range but could rally to $0.01
as price broke out with more buy orders against tether (USDT).
Despite the crypto market facing so much uncertainty as to where
the market is headed, the price of the Reserve Right (RSR) token
has shown a tremendous amount of strength as the price cracks
double-digit gains. (Data from Binance) Related Reading: Ripple
Gains While Bitcoin Remains Below $20,000 Reserve Right (RSR) Price
Analysis On The Weekly Chart Despite a decline in its price from
$0.1 to $0.0037, over 70% decline from its all-time high. The price
of RSR showed great strength as the price bounced from its weekly
low of $0.003, rallying to a high of $0.008 before facing a
rejection to break above that region to higher heights. The price
of RSR has continued to move in range as the price cannot break
above a weekly resistance of $0.008 for the price of RSR to trend
higher to a region of $0.01. RSR price needs to break and
close above $0.008 to have a better chance of trading higher. The
Fibonacci retracement ratio shows the price of RSR is faced with
resistance at 23.6%; flipping this area of resistance into support
will signal a more relief bounce for the price of RSR. If the
price of RSR fails to break this key region acting as resistance,
we could see the price of RSR retesting $0.0055, acting as a
support and demand zone for more buy orders. Weekly resistance for
the price of RSR – $0.008-$0.01. Weekly support for the price of
RSR – $0.0055. Price Analysis Of RSR On The Daily (1D) Chart The
daily timeframe for RSR prices continues to look strong as the
price broke out of an asymmetric triangle with strong volume.
Despite RSR being rejected from a high of $0.01, the price
continued in a range forming an asymmetric triangle before breaking
out with good buy volume. On the daily timeframe, the price of RSR
is currently trading at $0.0074, holding its price above the 50
Exponential Moving Average (EMA), acting as support for RSR price.
The price of RSR is trading below 200 EMA as it eyes $0.01, being a
major resistance. The price of $ and $0.0063 corresponds to the
support at 50 EMA, and $0.01 correspond to the resistance at 200
EMA for the price of RSR. The Relative Strength Index (RSI)
for SOL is above 40 on the daily chart, indicating more sell order
volume. Daily resistance for the RSR price – $0.01. Daily
support for the RSR price – $0.0063. Related Reading: Fall Of
Crypto King, A Canadian Driven-Lambo Records $35M Losses Featured
Image From zipmex, Charts From Tradingview
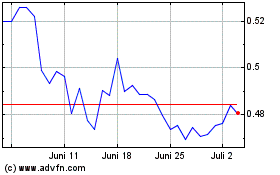
Ripple (COIN:XRPUSD)
Historical Stock Chart
Von Mär 2024 bis Apr 2024

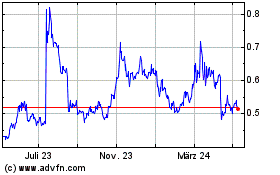
Ripple (COIN:XRPUSD)
Historical Stock Chart
Von Apr 2023 bis Apr 2024
