Polkadot (DOT) Under Sell Pressure As Bears Retaliate
04 Mai 2023 - 7:00PM
NEWSBTC
Over the last week, Polkadot (DOT) has had trouble gaining
traction, falling by 8.41% from April 30 to May 4. However, the
price is trading sideways and there might be a modest recovery next
week as investors take advantage of this dip to acquire more DOT.
According to CoinMarketCap, Polkadot ranks #11 among all
cryptocurrencies with a current market price of $5.75. Polkadot’s
24-hour trading volume is up by 29.40% in 24 hours, while its
market cap has also gained 1.57% within the same time frame.
Polkadot’s (DOT) Fear & Greed Index today is 46. This level
indicates that bulls are pushing the price up gradually, but the
bears are still in their positions. Over the last few days,
Polkadot (DOT) has been showing some bullish signs; so expect a
possible recovery within the next few weeks as investors take
advantage of the current momentum. DOT Price Analysis Polkadot
trades between the 200-day simple moving average and the 50-day
simple moving average (SMA). This indicates that the market is in a
neutral or consolidation phase. The price does not trend
significantly in either direction. During this phase, traders and
investors may use the 50-day and 200-day SMAs as support and
resistance levels while trading. Related Reading: Check Out This
Shocking Pepe Coin Versus Bitcoin Comparison However, if the price
exceeds the 50-day SMA, it could indicate a short-term uptrend,
giving investors a buying opportunity. The Relative Strength Index
(RSI) level of DOT is 41, indicating that its market is heading
towards the neutral zone and there’s indecision among investors.
But the 24-hour volume indicator shows that the trading activity is
gradually growing, which could mean investors are building interest
in the coin. This may increase liquidity and potential price
movement in favor of DOT. The chart above shows the key support and
resistance levels of Polkadot (DOT). Polkadot now trades between
$5.587 and $6.07 primary support and resistance levels. DOT’s first
important resistance level is $6.07. If the price rises above this
level, the next resistance levels are $7.970. Future Developments
For Polkadot Many upcoming developments on the Polkadot network
might push its adoption, usage, and price in the nearest future.
Related Reading: PEPE Goes To The Moon: Meme Coin Listed On OKX,
Binance Listing In the Works? For instance, the community voted to
onboard a Bridge Hub system parachain to Polkadot. Also, Mythical
Games plans to migrate its Mythical Chain to the Polkadot
blockchain. Furthermore, the developers are discussing
establishing Polkadot Hubs in South-East Asia, with Bali and
Indonesia as the first focus. These development
proposals and discussions depict the team’s effort to enhance the
network’s efficiency, connectivity, and interoperability. In time,
more adoption and activities may affect DOT prices positively.
Featured image from Pixabay and chart from Tradingview.com
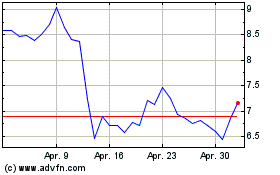
Polkadot (COIN:DOTUSD)
Historical Stock Chart
Von Mär 2024 bis Apr 2024

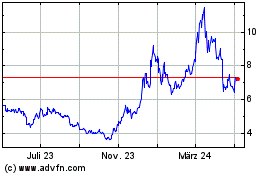
Polkadot (COIN:DOTUSD)
Historical Stock Chart
Von Apr 2023 bis Apr 2024
