SECURITIES AND EXCHANGE COMMISSION
Washington, D.C. 20549
FORM 6-K
Report of
Foreign Issuer
Pursuant to Rule 13a-16 or 15d-16
of the Securities Exchange Act of 1934
For the month of February 2016
Commission File Number: 001-13464
Telecom Argentina S.A.
(Translation of registrant’s name into English)
Alicia Moreau de Justo, No. 50, 1107
Buenos Aires, Argentina
(Address of principal executive offices)
Indicate by check mark whether the registrant files or will file annual reports under cover of Form 20-F or Form 40-F:
Indicate by check mark if the registrant is submitting the Form 6-K in paper as permitted by Regulation S-T
Rule 101(b)(1):
Indicate by check mark if the registrant is submitting the Form 6-K in paper as permitted by Regulation S-T
Rule 101(b)(7):
Indicate by check mark whether by furnishing the information contained in this Form, the Registrant is also
thereby furnishing the information to the Commission pursuant to Rule 12g3-2(b) under the Securities Exchange Act of 1934:
If “Yes” is marked, indicate below the file number assigned to the registrant in connection with
Rule 12g3-2(b): N/A
Telecom Argentina S.A.
TABLE OF CONTENTS
|
|
|
| FOR IMMEDIATE RELEASE |
|

|
| Buenos Aires, February 11, 2016 |
|
|
SECURITIES AND EXCHANGE COMMISSION
Dear Sirs,
Re.: Non-audited Preliminary Financial Information as of 12/31/15.-
I am writing to you as chairman of the Board of Directors of Telecom Argentina S.A. (“Telecom Argentina”), to inform the following:
At meetings held yesterday, the Board of Directors of Telecom Argentina and its subsidiary, Telecom Personal S.A., took into consideration certain
‘Non-audited Preliminary Financial Information’ as of December 31st, 2015 provided by Management. Today, the information is being presented to the regulators and
to the market, in compliance with Article 2, Chapter I, Title XII of the Argentine National Securities Commission (Comisión Nacional del Mercado de Valores or CNV) Rules (NT 2013), through the attached Press Release.
Sincerely,
|
|
|
| /s/ Oscar Cristianci |
|
|
| Oscar Cristianci |
|
|
| Chairman of the Board of Director |
|
|

FOR IMMEDIATE RELEASE
Market Cap P$46.6 billion
February 10th, 2016
Contacts:
Pedro Insussarry
Solange Barthe Dennin
(54 11) 4968-3743/3752
Telecom Argentina S.A.
announces consolidated preliminary results for the annual period (‘FY15’) and fourth quarter of fiscal year 2015
(‘4Q15’)*
| ¡
|
|
Consolidated Revenues amounted to P$40,496 million (+21.5% vs. FY14); Fixed Data +21.1% vs. FY14; Fixed Internet +40.0% vs. FY14;
and Mobile business in Argentina +20.9% vs. FY14. |
| ¡
|
|
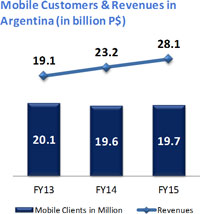
Mobile subscribers in Argentina: 19.7 million in FY15. |
| ¡
|
|
Mobile Value Added Services in Argentina (Internet and Data): +21.9% vs. FY14; 60.2% of Service Revenues.
|
| ¡
|
|
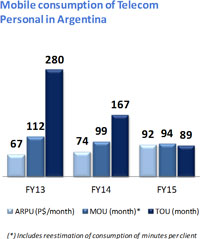
Mobile ARPU in Argentina increased to P$91.5 per month in FY15 (+23.2% vs. FY14). |
| ¡
|
|
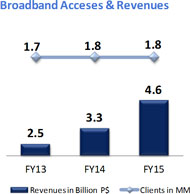
ADSL ARPU increased to P$207.4 per month in FY15 (+35.5% vs. FY14); monthly churn reached 1.4% in FY15.
|
| ¡
|
|
Consolidated Operating costs -including D&A and Results on disposal of PP&E and write-down of PP&E- totaled P$34,311
million (+22.8% vs. FY14). |
| ¡
|
|
Net Income amounted to P$3,435 million (-7.9% vs. FY14). Net Income attributable to Telecom Argentina amounted to P$3,403 million
(-7.4% vs. FY14). |
| ¡
|
|
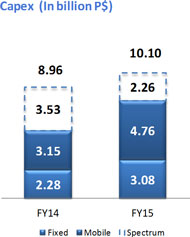
Capex increased to P$10,100 million in FY15 (+12.8% vs. FY14, considering the remaining payment of the spectrum during june 2015),
equivalent to 24.9% of Consolidated Revenues. |
| ¡
|
|
Net Cash Position (Debt): P$2,277 million, a decrease of P$3,022 million vs. FY14, after Telecom Argentina´s cash dividend
distribution and the 4G spectrum payment during fiscal year 2015. |
|
|
|
|
|
|
|
|
|
|
|
|
|
|
|
|
|
| |
|
As of December, 31 |
|
|
|
|
|
|
|
| (in million P$, except where noted) |
|
2015 |
|
|
2014 |
|
|
D$
|
|
|
D%
|
|
| Consolidated Revenues |
|
|
40,496 |
|
|
|
33,341 |
|
|
|
7,155 |
|
|
|
21.5% |
|
| Mobile Services |
|
|
29,760 |
|
|
|
24,782 |
|
|
|
4,978 |
|
|
|
20.1% |
|
| Fixed Services |
|
|
10,736 |
|
|
|
8,559 |
|
|
|
2,177 |
|
|
|
25.4% |
|
| Operating Income before D&A |
|
|
10,866 |
|
|
|
8,702 |
|
|
|
2,164 |
|
|
|
24.9% |
|
| Operating Income |
|
|
6,229 |
|
|
|
5,443 |
|
|
|
786 |
|
|
|
14.4% |
|
| Net Income attributable to Telecom Argentina |
|
|
3,403 |
|
|
|
3,673 |
|
|
|
(270) |
|
|
|
-7.4% |
|
| Shareholders’ equity attributable to Telecom Argentina |
|
|
17,194 |
|
|
|
14,418 |
|
|
|
2,776 |
|
|
|
19.3% |
|
| Net Financial Position - (Debt) / Cash |
|
|
(2,277) |
|
|
|
745 |
|
|
|
(3,022) |
|
|
|
- |
|
| CAPEX |
|
|
10,100 |
|
|
|
8,957 |
|
|
|
1,143 |
|
|
|
12.8% |
|
| Fixed lines in service (in thousand lines) |
|
|
4,043 |
|
|
|
4,093 |
|
|
|
(50) |
|
|
|
-1.2% |
|
| Mobile customers (in thousand) |
|
|
22,202 |
|
|
|
22,066 |
|
|
|
136 |
|
|
|
0.6% |
|
| Personal (Argentina) |
|
|
19,656 |
|
|
|
19,585 |
|
|
|
71 |
|
|
|
0.4% |
|
| Núcleo (Paraguay) -including Wimax customers- |
|
|
2,546 |
|
|
|
2,481 |
|
|
|
65 |
|
|
|
2.6% |
|
| Broadband accesses (in thousand) |
|
|
1,814 |
|
|
|
1,771 |
|
|
|
43 |
|
|
|
2.4% |
|
| Average Billing per user (ARBU) Fixed Telephony / voice (in P$) |
|
|
67.7 |
|
|
|
57.4 |
|
|
|
10.3 |
|
|
|
17.9% |
|
| Average Revenue per user (ARPU) Mobile Services in Arg. (in P$) |
|
|
91.5 |
|
|
|
74.2 |
|
|
|
17.2 |
|
|
|
23.2% |
|
| Average Revenue per user (ARPU) ADSL (in P$) |
|
|
207.4 |
|
|
|
153.0 |
|
|
|
54.4 |
|
|
|
35.5% |
|
*Unaudited data
Buenos Aires, February 10, 2016
- Telecom Argentina (‘Telecom’) - (NYSE: TEO; BASE: TECO2), one of Argentina’s leading telecommunications companies, announced today, that, according to its preliminary results,
Net Income amounted to P$3,435 million for the annual period ended December 31, 2015, or -7.9% when compared to the same period last year. Net income attributable to Telecom Argentina amounted to P$3,403 million (-7.4% vs. FY14).
|
|
|
|
|
|
|
|
|
| |
|
FY15 |
|
FY14 |
|
D
$ |
|
D
% |
| Consolidated Revenues (MMP$) |
|
40,496 |
|
33,341 |
|
7,155 |
|
21.5% |
| Net Income attributable to Telecom (MMP$) |
|
3,403 |
|
3,673 |
|
(270) |
|
(7.4%) |
| Earnings attributable to Telecom per Share (P$) |
|
3.5 |
|
3.8 |
|
(0.3) |
|
|
| Earnings attributable to Telecom per ADR (P$) |
|
17.6 |
|
18.9 |
|
(1.4) |
|
|
| Operating Income before D&A * |
|
26.8% |
|
26.1% |
|
|
|
|
| Operating Income * |
|
15.4% |
|
16.3% |
|
|
|
|
| Net Income* |
|
8.5% |
|
11.2% |
|
|
|
|
| *As a percentage of Consolidated Revenues |
|
|
|
|
|
|
|
|
| Note: As of FY15 and FY14, the average of ordinary shares
outstanding amounted to 969,159,605. |
During FY15, according to its preliminary results, Consolidated Revenues increased by 21.5%
to P$40,496 million (+P$7,155 million vs. FY14), mainly fueled by the Fixed Data, Broadband businesses and Mobile Services. Moreover, Operating Income reached P$6,229 million (+P$786 million or +14.4% vs. FY14).
Consolidated Operating Revenues
Mobile Services
During FY15 clients amounted to 22.2 million as of the end of December, 2015 vs. 22.1 million as of FY14.
Third parties Revenues amounted to P$29,760 million (+20.1% vs. FY14) thanks to innovative commercial offers that stimulates value
added services (‘VAS’) consumption and are tailor made to the needs of clients.
Telecom Personal in Argentina
As of December 31, 2015, Personal reached 19.7 million subscribers in Argentina vs. 19.6 million in FY14, where postpaid clients
represented 33% of the subscriber base.
In FY15, third parties Revenues reached P$28,054 million (+P$4,850 million or
+20.9% vs. FY14) while Service Revenues (excluding equipment sales) amounted to P$22,258 million (+21.7% vs. FY14), with 60.2% corresponding to VAS revenues (same as in FY14). VAS revenues amounted to P$13,410 million (+21.9% vs. FY14). Moreover,
equipment sales increased by +17.8% vs. FY14, reaching P$5,796 million, equivalent to 20.7% of total revenues.
During
FY15, the Average Monthly Revenue per User (‘ARPU’) reached P$91.5 (+23.2% vs. FY14) due to higher VAS consumption. Moreover, SMS traffic decreased due to clients’ preference for plans and packs with VAS content and browsing offer by
Personal.
*Unaudited data
Commercial Initiatives
The most significant event of 4Q15 related to the commercial offer was the launch of new ‘Data Centric’ plans, which
focus on data consumption. As of 2015, Personal continued deepening its 4G strategy, by expanding the deployment of the network and the LTE technology infrastructure reaching more than 335 cities of 18 provinces of Argentina and fulfilling one year
of release, more than 2 million clients have suitable devices.
During the fourth quarter, Personal continued
developing its commercial strategy for the 4G smartphone segment, with the focus on the high value platform, with an aggressive commercial campaign for Mother’s Day and Holidays where the change of devices was promoted, thereby increasing the
access of VAS of the customers.
In line with this strategy and with the aim to expand the portfolio of 4G devices,
Personal presented an evolution of its mobile internet offer with the Huawei 4G WI FI modem, that allows Personal’s clients to connect anywhere and to share mobile internet access via Wi Fi with up to 10 devices simultaneously, with a data plan
of up to 10 GB.
For prepaid customers, the benefit of Triple Credit was available on promotional days for all
recharges starting from $5. The bonus credit can be used for calls and SMS to any operator and to any destination in the country.
Additionally, as part of its international roaming agreements strategy, Personal presented its offer for 2016 summer season. With focus on data usage, the offer includes data per day for all its customers and a Total Connection
package for postpaid customers.
Moreover, as part of its entertainment strategy leveraged in Personal Play´s
comprehensive platform, for the third consecutive year the most important game developer conference in Argentina was presented, where amateurs and professionals enjoyed a unique space for sharing experiences, project dissemination and for keeping
abreast of industry’s new trends.
Telecom Personal in Paraguay (‘Núcleo’)
As of December 31, 2015, Nucleo’s subscriber base reached 2.5 million clients (+2.6% vs. FY14). Prepaid and postpaid
customers represented 80% and 20%, respectively.
Nucleo generated revenues from third parties equivalent to P$1,706
million during FY15 (+8.1% vs. FY14). VAS revenues amounted to P$880 million (+11.8% vs. FY14) representing 56.9% of FY15 service revenues (vs. 52.9% in FY14).
*Unaudited data
Fixed Services (Voice, Data & Internet)
|
|
|
| During FY15, revenues generated by fixed services amounted to P$10,736 million, +25.4% vs. FY14; with Data
revenues (+21.1% vs. FY14) and Internet (+40.0% vs. FY14) growing the most in the segment.
Voice
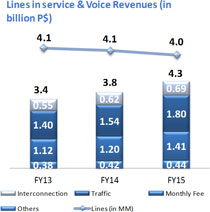
Total service revenues reached P$4,339 million in FY15 (+14.7% vs. FY14). A portion of this line of business (mainly monthly charge
and measured services), continued to be affected by frozen tariffs of regulated services enforced by the Argentine Government in 2002.
Revenues generated by measured services totaled P$1,800 million, an increase of P$259 million or +16.8% vs. FY14 mainly due to a
higher penetration of flat rate packs of local and national long distance calls.
Monthly charges and supplementary services reached P$1,406 million, an increase of P$203 million or +16.9% vs. FY14 due to higher
revenues in non-regulated supplementary services. The customer base remained stable at 4 million lines in service.
As a result of these increases, the average monthly revenue billed to user (ARBU) reached P$67.7 in FY15, +17.9% vs.
FY14. Fixed and mobile
interconnection revenues amounted to P$689 million (+11.0% vs. FY14). Meanwhile, other revenues totaled P$444 million (+6.5% vs. FY14).
Data and Internet
Data revenues (services mainly offered to Corporate segment and Government) amounted to P$1,780 million (+P$310 million or +21.1%
vs. FY14), strengthening the position of Telecom as an integrated ICT provider. This increase was mainly due to FX rate variations that affected those contracts that are adjusted by the $/U$S exchange rate and by the increase of the client base with
the Innovative services.
Revenues related to Internet totaled P$4,556 million (+P$1.302 million or +40.0% vs. FY14), mainly due to a commercial offer with
higher speeds, (ultra broadband or UBB), where 10Mb was the most demanded service and currently represents 27% of the total customer base. This was possible thanks to significant investments executed recently in the access network using FTTx
technology that allows to take fiber optics to the closest connection point to the customer.
As of December 31, 2015, Telecom reached 1.8 million ADSL accesses (+2.4% vs. FY14). These connections represented 44.9% of
Telecom’s fixed lines in service. In addition, ADSL ARPU reached P$207.4 in FY15, +35.5% when compared to FY14 and the monthly churn rate remained stable 1.4% in FY15 vs. 1.3% in FY14. |
|
|
*Unaudited data
|
|
|
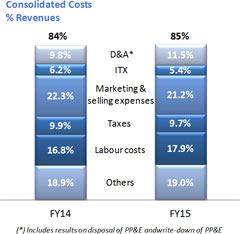
| Consolidated Operating Costs
Consolidated Operating Costs totaled P$34,311 million in FY15, an increase of P$6,366 million, or +22.8% vs. FY14 (including
‘Results on disposal of PP&E and write-down of PP&E’ that resulted in a loss of P$199 million in FY15 and a loss of P$16 million in FY14). This increase is mainly a consequence of higher labor costs and higher costs of more
sophisticated handsets. The cost
breakdown is as follows: - Employee
benefit expenses and severance payments totaled P$7,253 million (+29.7% vs. FY14), mainly affected by increases in salaries to unionized employees due to the new collective bargaining agreement signed at the beginning of 3Q15 as well as increases in
salaries to the non-unionized workforce, together with the social security contributions associated to such concepts. Total employees at the end of the period amounted to 16,224.
- Interconnection costs and other
telecommunication charges (including TLRD, Roaming, Interconnection, international settlement charges and lease of circuits) amounted to P$2,170 million, +4.6% vs. FY14. This increase resulted from higher costs related to the lease of circuits and
interconnection costs of fixed telephony associated to FX fluctuation, partially compensated by lower charges for roaming.
- Fees for services, maintenance and materials and supplies amounted to P$3,919 million (+17.6% vs. FY14), mainly due to
costs’ increases in technical maintenance and systems’ licenses partially associated to the effect of the devaluation of the Peso/ U$S FX rate, as well as higher fees for services as higher costs were recognized to suppliers in both the
fixed and mobile businesses. - Taxes
and fees with regulatory authorities reached P$3,943 million (+19.6% vs. FY14), impacted mainly by higher revenues, higher bank debit and credit taxes related to collection flows and vendor payments, and to the disbursement related to the issuance
of Notes in December 2015, as well as higher municipal taxes.
- Commissions (Commissions paid to agents, prepaid card commissions and others) totaled P$3,193 million (+28.0% vs. FY14), mainly
due to the increase in commissions paid to commercial channels as well as collection fees, both associated to the increase in more sophisticated equipment sales. Agent commissions capitalized as SAC amounted to P$1.172 million (+28.4% vs.
FY14). - Cost of handsets sold
totaled P$4,595 million (+10.9% vs. FY14), due to handsets sales with higher costs unit prices, impacted by a higher FX rate. This was partially compensated by a lower number of handsets sold. Deferred costs from SAC amounted to P$93 million (-9.7%
vs. FY14). The lower deferred costs were derived from the reduction in handset subsidies granted to clients.
- Advertising amounted to P$814 million (+2.8% vs. FY14), mainly due to slightly higher commercial expenses when compare to FY14,
related to marketing campaigns. |
|
|
*Unaudited data
|
|
|
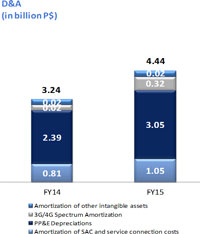
| - Depreciation and Amortization reached P$4,438 million (+36.8% vs. FY14). PP&E depreciation amounted to
P$3,046 million (+27.5% vs. FY14) resulting from the incorporation of assets related to the investment plan that the group has been executing; Amortization of SAC and service connection costs totaled P$1,045 million (+28.9% vs. FY14); and other
intangible assets reached P$347 million (+707.0% vs. FY14) due to the acquisition of 3G and 4G licenses.
- Other Costs totaled P$3,787 million (+27.9% vs. FY14). This increase was mainly due to VAS costs that totaled P$1,256 million
(+34.2% vs. FY14), related to the increase of sales of those services, especially in the mobile business. Bad debt expenses reached P$564 million (+33.0% vs. FY14) representing 1.6% of consolidated costs and 1.4% of consolidated revenues.
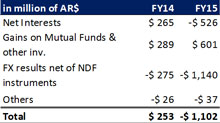
Consolidated Financial Results
Net Financial results amounted to a loss of P$1,102 million,
a decrease of P$1,355 million or -535.6% vs. FY14. This was mainly due to losses in net financial interest of P$526 million in FY15 (-P$791 million vs. FY14) and losses of FX results net of NDF instruments for P$1,140 million in FY15 (vs. a loss of
P$275 million in FY14) mainly due to the devaluation of the peso occurred during December 2015. Meanwhile, gains on mutual funds and other investments amounted to P$601 million (+P$312 million vs. FY14).
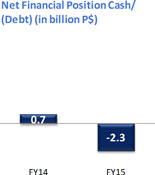
Consolidated Net Financial Position
As of December 31, 2015, Net Financial Position (Cash, Cash
Equivalents and financial Investments minus Loans) totaled P$2,277 million in debt, a decrease of P$3,022 million when compared to the Net Financial Position as of December 31, 2014, after the remaining payment of the 4G frequencies for an amount of
P$2,256 million and the cash dividend payment of $804 million. Capital Expenditures During FY15,
the Company invested P$10,100 million (+12.8% vs. FY14). Of this amount, P$3,079 million were allocated to Fixed Services and P$7,021 million to Mobile services, where P$2,256 million corresponded to the acquisition of the 4G frequencies. In
relative terms, Capex reached 24.9% of consolidated revenues vs. 26.9% in FY14.
The main capital expenditures in the fixed business were associated to the expansion of broadband services, in order to offer
higher download speeds, and thus to improve the navigation experience in Internet.
In the mobile business, the acquired 3G and 4G frequencies together with the executed investments allowed to improve coverage and
capacity of the access network, in order to sustain the increase in demand for Data and Internet, along with new VAS thus offering a better quality of service.
Transmission and transport networks were also expanded to meet the growing demand for services of fixed and mobile
customers. |
|
|
*Unaudited data
|
|
|
| Relevant Matters
Issuance of Notes by Telecom Personal SA
On December 10, 2015, Telecom Personal has
successfully completed the issuance of two series of Notes for a total nominal value of P$ 720.5 million. The issuance was as follows:
•Series I: with a maturity of 18 months from the date of issuance and settlement for a nominal value of P$ 571.5 million, at a
combine rate (fixed rate of 28.5% up to the 6th month and variable rate from the 7th month, BADLAR rate + 375bps).
•Series II: with a maturity of 36 months from the date of issue and settlement, with a nominal value of P$ 149 million, at a
combine rate (fixed rate of 28.75% up to the 9th month and variable rate from the 10th month, BADLAR rate + 400bps).
The funds will be used to refinance short term debt and to finance the investment plan of the Company for the next three years,
which is aimed at expanding the 4G LTE network, increased network transmission capacity and improved 3G and 2G services.
Telecom Personal was rated AA + (local rating) by Fix (Fitch Ratings), highlighting the credit quality and financial strength of
the Company. ENACOM creation and
amendments to the Law of Communication and Audiovisual Services and Argentina Digital Law
On January 4, 2016, Decree 267/15 (dated December 29th, 2015) was published, amending both Law 26,522 (Communication and
Audiovisual Services or Media) and Law 27,078 (Argentina Digital Law). The decree establishes the creation of a new regulatory entity called ENACOM (National Authority for Communications), which has been ascribed with all the powers and functions of
the mentioned laws, and depending hierarchically of the Ministry of Communications.
********* |
|
|
*Unaudited data
Telecom is the parent company of a leading telecommunications group in Argentina,
where it offers, either itself or through its controlled subsidiaries local and long distance fixed-line telephony, cellular, data transmission and Internet services, among other services. Additionally, through a controlled subsidiary, the Telecom
Group offers cellular services in Paraguay. The Company commenced operations on November 8, 1990, upon the Argentine government’s transfer of the telecommunications system in the northern region of Argentina.
|
|
|
|
|
|
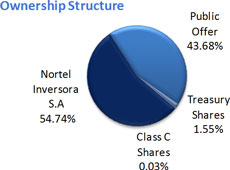
Nortel Inversora S.A. (“Nortel”), which acquired the majority of the Company from the Argentine
government, holds 54.74% of Telecom’s issued common stock. Nortel is a holding company whose common stock (approximately 78% of capital stock) is owned by Sofora Telecomunicaciones S.A. Additionally, Nortel capital stock is comprised of
preferred shares that are held by minority shareholders. As of December 31, 2015, Telecom continued to have 984,380,978 shares issued and 969,159,605 shares outstanding.
For more information, please contact Investor Relations: |
|
|
|
|
|
|
|
|
|
|
|
| Pedro Insussarry
(5411) 4968 3743 |
|
Solange Barthe Dennin
(5411) 4968 3752 |
|
Luis F. Rial Ubago
(5411) 4968 3718 |
|
Ruth Fuhrmann
(5411) 4968 4448 |
|
Antonella Papaleo
(5411) 4968 6236 |
|
|
Voice Mail: (5411) 4968 3628
Fax: (5411) 4968 3616
E-mail: relinver@ta.telecom.com.ar
For information about Telecom Group services, visit:
www.telecom.com.ar
www.personal.com.ar
www.personal.com.py
www.arnet.com.ar
Disclaimer
This document may contain statements that could constitute forward-looking
statements, including, but not limited to, the Company’s expectations for its future performance, revenues, income, earnings per share, capital expenditures, dividends, liquidity and capital structure; the effects of its debt restructuring
process; the impact of emergency laws enacted by the Argentine Government; and the impact of rate changes and competition on the Company’s future financial performance. Forward-looking statements may be identified by words such as
“believes,” “expects,” “anticipates,” “projects,” “intends,” “should,” “seeks,” “estimates,” “future” or other similar expressions. Forward-looking statements
involve risks and uncertainties that could significantly affect the Company’s expected results. The risks and uncertainties include, but are not limited to, the impact of emergency laws enacted by the Argentine government that have resulted in
the repeal of Argentina’s Convertibility law, devaluation of the peso, various changes in restrictions on the ability to exchange pesos into foreign currencies, and currency transfer policy generally, the “pesification” of tariffs
charged for public services, the elimination of indexes to adjust rates charged for public services and the Executive branch announcement to renegotiate the terms of the concessions granted to public service providers, including Telecom. Due to
extensive changes in laws and economic and business conditions in Argentina, it is difficult to predict the impact of these changes on the Company’s financial condition. Other factors may include, but are not limited to, the evolution of the
economy in Argentina, growing inflationary pressure and evolution in consumer spending and the outcome of certain legal proceedings. Readers are cautioned not to place undue reliance on forward-looking statements, which speak only as the date of
this document. The Company undertakes no obligation to release publicly the results of any revisions to forward-looking statements which may be made to reflect events and circumstances after the date of this press release, including, without
limitation, changes in the Company’s business or to reflect the occurrence of unanticipated events. Readers are encouraged to consult the Company’s Annual Report on Form 20-F, as well as periodic filings made on Form 6-K, which are filed
with or furnished to the United States Securities and Exchange Commission for further information concerning risks and uncertainties faced by Telecom.
(Financial tables follow)
*******
*Unaudited data
TELECOM ARGENTINA S.A.
Consolidated information
Annual Period and Fourth Quarter - Fiscal Year 2015
(In million of Argentine pesos)
|
|
|
|
|
|
|
|
|
|
|
|
|
|
|
|
|
|
|
| 1- |
|
Consolidated Balance Sheet |
|
|
|
|
|
|
|
|
|
|
|
|
|
|
|
|
| |
|
|
|
12/31/15 |
|
|
12/31/14 |
|
|
D $ |
|
|
D %
|
|
|
|
Cash and cash equivalents |
|
|
870 |
|
|
|
825 |
|
|
|
45 |
|
|
|
5.5% |
|
|
|
Investments |
|
|
1,430 |
|
|
|
53 |
|
|
|
1,377 |
|
|
|
- |
|
|
|
Trade receivables |
|
|
5,663 |
|
|
|
4,124 |
|
|
|
1,539 |
|
|
|
37.3% |
|
|
|
Other Receivables |
|
|
1,336 |
|
|
|
670 |
|
|
|
666 |
|
|
|
99.4% |
|
|
|
Inventories |
|
|
2,193 |
|
|
|
721 |
|
|
|
1,472 |
|
|
|
204.2% |
|
|
|
Total current assets |
|
|
11,492 |
|
|
|
6,393 |
|
|
|
3,763 |
|
|
|
58.9% |
|
|
|
Financial Investments |
|
|
332 |
|
|
|
300 |
|
|
|
32 |
|
|
|
10.7% |
|
|
|
Trade receivables |
|
|
481 |
|
|
|
143 |
|
|
|
338 |
|
|
|
- |
|
|
|
Property, plant and equipment |
|
|
17,963 |
|
|
|
13,809 |
|
|
|
4,154 |
|
|
|
30.1% |
|
|
|
Intangible assets |
|
|
7,659 |
|
|
|
5,331 |
|
|
|
2,328 |
|
|
|
43.7% |
|
|
|
Other Receivables |
|
|
538 |
|
|
|
341 |
|
|
|
197 |
|
|
|
57.8% |
|
|
|
Total non-current assets |
|
|
26,973 |
|
|
|
19,924 |
|
|
|
7,049 |
|
|
|
35.4% |
|
|
|
Total Assets |
|
|
38,465 |
|
|
|
26,317 |
|
|
|
10,812 |
|
|
|
41.1% |
|
|
|
Trade payables |
|
|
9,873 |
|
|
|
6,072 |
|
|
|
3,801 |
|
|
|
62.6% |
|
|
|
Deferred revenues |
|
|
477 |
|
|
|
507 |
|
|
|
(30) |
|
|
|
-5.9% |
|
|
|
Financial debt |
|
|
3,451 |
|
|
|
179 |
|
|
|
3,272 |
|
|
|
- |
|
|
|
Salaries and social security payables |
|
|
1,261 |
|
|
|
1,022 |
|
|
|
239 |
|
|
|
23.4% |
|
|
|
Income tax payables |
|
|
439 |
|
|
|
247 |
|
|
|
192 |
|
|
|
77.7% |
|
|
|
Other taxes payables |
|
|
1,153 |
|
|
|
824 |
|
|
|
329 |
|
|
|
39.9% |
|
|
|
Other liabilities |
|
|
53 |
|
|
|
47 |
|
|
|
6 |
|
|
|
12.8% |
|
|
|
Provisions |
|
|
207 |
|
|
|
199 |
|
|
|
8 |
|
|
|
4.0% |
|
|
|
Total current liabilities |
|
|
16,914 |
|
|
|
9,097 |
|
|
|
7,817 |
|
|
|
85.9% |
|
|
|
Trade payables |
|
|
52 |
|
|
|
- |
|
|
|
52 |
|
|
|
- |
|
|
|
Deferred revenues |
|
|
457 |
|
|
|
465 |
|
|
|
(8) |
|
|
|
-1.7% |
|
|
|
Financial debt |
|
|
1,449 |
|
|
|
254 |
|
|
|
1,195 |
|
|
|
- |
|
|
|
Salaries and social security payables |
|
|
157 |
|
|
|
150 |
|
|
|
7 |
|
|
|
4.7% |
|
|
|
Deferred income tax liabilities |
|
|
550 |
|
|
|
417 |
|
|
|
133 |
|
|
|
31.9% |
|
|
|
Income tax payables |
|
|
10 |
|
|
|
9 |
|
|
|
1 |
|
|
|
11.1% |
|
|
|
Other liabilities |
|
|
101 |
|
|
|
76 |
|
|
|
25 |
|
|
|
32.9% |
|
|
|
Provisions |
|
|
1,165 |
|
|
|
1,080 |
|
|
|
85 |
|
|
|
7.9% |
|
|
|
Total non-current liabilities |
|
|
3,941 |
|
|
|
2,451 |
|
|
|
1,490 |
|
|
|
60.8% |
|
|
|
TOTAL LIABILITIES |
|
|
20,855 |
|
|
|
11,548 |
|
|
|
9,307 |
|
|
|
80.6% |
|
|
|
|
|
|
|
|
|
Equity attributable to Telecom Argentina (Controlling Company) |
|
|
17,194 |
|
|
|
14,418 |
|
|
|
2,776 |
|
|
|
19.3% |
|
|
|
Non-controlling interest |
|
|
416 |
|
|
|
351 |
|
|
|
65 |
|
|
|
18.5% |
|
|
|
TOTAL EQUITY |
|
|
17,610 |
|
|
|
14,769 |
|
|
|
1,505 |
|
|
|
10.2% |
|
|
|
TOTAL LIABILITIES AND EQUITY |
|
|
38,465 |
|
|
|
26,317 |
|
|
|
10,812 |
|
|
|
41.1% |
|
|
2- |
|
Consolidated Loans |
|
|
|
|
|
|
|
|
|
|
|
|
|
|
|
|
| |
|
|
|
12/31/15 |
|
|
12/31/14 |
|
|
D $
|
|
|
D % |
|
|
|
Bank overdraft - principal Personal |
|
|
3,062 |
|
|
|
140 |
|
|
|
2,922 |
|
|
|
- |
|
|
|
Bank overdraft - principal Nucleo |
|
|
84 |
|
|
|
- |
|
|
|
84 |
|
|
|
- |
|
|
|
Bank overdraft - accrued interest Personal |
|
|
65 |
|
|
|
1 |
|
|
|
64 |
|
|
|
- |
|
|
|
Bank loans - accrued interest Personal |
|
|
10 |
|
|
|
- |
|
|
|
10 |
|
|
|
- |
|
|
|
Banks loans - principal Nucleo |
|
|
193 |
|
|
|
32 |
|
|
|
161 |
|
|
|
- |
|
|
|
Banks loans - accrued interest Nucleo |
|
|
8 |
|
|
|
6 |
|
|
|
2 |
|
|
|
33.3% |
|
|
|
Notes - accrued interest Personal |
|
|
29 |
|
|
|
- |
|
|
|
29 |
|
|
|
- |
|
|
|
Total Current Loans |
|
|
3,451 |
|
|
|
179 |
|
|
|
3,272 |
|
|
|
- |
|
|
|
Notes - principal Personal |
|
|
713 |
|
|
|
- |
|
|
|
713 |
|
|
|
- |
|
|
|
Banks loans - principal Personal |
|
|
509 |
|
|
|
- |
|
|
|
509 |
|
|
|
- |
|
|
|
Banks loans - principal Nucleo |
|
|
227 |
|
|
|
254 |
|
|
|
(27) |
|
|
|
-10.6% |
|
|
|
Total Non Current Loans |
|
|
1,449 |
|
|
|
254 |
|
|
|
1,195 |
|
|
|
- |
|
|
|
Total Loans |
|
|
4,900 |
|
|
|
433 |
|
|
|
4,467 |
|
|
|
- |
|
|
|
|
|
|
|
|
|
|
|
|
|
|
|
|
|
|
|
|
|
|
|
|
|
|
|
|
Cash and cash equivalents, and Financial Investments |
|
|
2,632 |
|
|
|
1,178 |
|
|
|
1,454 |
|
|
|
123.4% |
|
|
|
Net Financial Position - Cash / (Debt) |
|
|
(2,277) |
|
|
|
745 |
|
|
|
(3,022) |
|
|
|
- |
|
|
|
|
|
|
|
|
|
|
|
|
|
|
|
|
|
|
|
|
*Unaudited data
TELECOM ARGENTINA S.A.
Consolidated information
Annual Period and Fourth Quarter - Fiscal Year 2015
(In million of Argentine pesos)
| 3- |
Consolidated Income Statements |
|
|
|
|
|
|
|
|
|
|
|
|
|
|
|
|
|
| |
|
12/31/15 |
|
|
12/31/14 |
|
|
D $
|
|
|
D % |
|
|
|
|
|
|
| Revenues |
|
|
40,496 |
|
|
|
33,341 |
|
|
|
7,155 |
|
|
|
21.5% |
|
| Other income |
|
|
44 |
|
|
|
47 |
|
|
|
(3) |
|
|
|
-6.4% |
|
| Total Revenues & Other Income |
|
|
40,540 |
|
|
|
33,388 |
|
|
|
7,152 |
|
|
|
21.4% |
|
| Consolidated Operating Costs |
|
|
(34,311) |
|
|
|
(27,945) |
|
|
|
(6,366) |
|
|
|
22.8% |
|
| Operating income |
|
|
6,229 |
|
|
|
5,443 |
|
|
|
786 |
|
|
|
14.4% |
|
| Finance results, net |
|
|
(1,102) |
|
|
|
253 |
|
|
|
(1,355) |
|
|
|
- |
|
| Net income before income tax expense |
|
|
5,127 |
|
|
|
5,696 |
|
|
|
(569) |
|
|
|
-10.0% |
|
| Income tax expense |
|
|
(1,692) |
|
|
|
(1,967) |
|
|
|
275 |
|
|
|
-14.0% |
|
| Net income |
|
|
3,435 |
|
|
|
3,729 |
|
|
|
(294) |
|
|
|
-7.9% |
|
|
|
|
|
|
| Attributable to: |
|
|
|
|
|
|
|
|
|
|
|
|
|
|
|
|
| Telecom Argentina (Controlling Company) |
|
|
3,403 |
|
|
|
3,673 |
|
|
|
(270) |
|
|
|
-7.4% |
|
| Non-controlling interest |
|
|
32 |
|
|
|
56 |
|
|
|
(24) |
|
|
|
-42.9% |
|
|
|
|
|
|
| Operating income before D&A |
|
|
10,866 |
|
|
|
8,702 |
|
|
|
2,164 |
|
|
|
24.9% |
|
| As % of Revenues |
|
|
26.8% |
|
|
|
26.1% |
|
|
|
|
|
|
|
|
|
|
|
|
|
|
| Finance Income and Expenses |
|
12/31/15 |
|
|
12/31/14 |
|
|
D $
|
|
|
D %
|
|
| Finance Income |
|
|
|
|
|
|
|
|
|
|
|
|
|
|
|
|
| Interest on time deposits |
|
|
20 |
|
|
|
279 |
|
|
|
(259) |
|
|
|
-92.8% |
|
| Gains on other investments (notes and bonds) |
|
|
432 |
|
|
|
165 |
|
|
|
267 |
|
|
|
161.8% |
|
| Gains on Mutual Funds |
|
|
169 |
|
|
|
124 |
|
|
|
45 |
|
|
|
36.3% |
|
| Interest on receivables |
|
|
183 |
|
|
|
161 |
|
|
|
22 |
|
|
|
13.7% |
|
| Foreign currency exchange gains net of NDF instruments |
|
|
293 |
|
|
|
589 |
|
|
|
(296) |
|
|
|
-50.3% |
|
| Others |
|
|
10 |
|
|
|
2 |
|
|
|
8 |
|
|
|
- |
|
| Total finance income |
|
|
1,107 |
|
|
|
1,320 |
|
|
|
(213) |
|
|
|
-16.1% |
|
| Finance expenses |
|
|
|
|
|
|
|
|
|
|
|
|
|
|
|
|
| Interest on financial debt |
|
|
(566) |
|
|
|
(30) |
|
|
|
(536) |
|
|
|
- |
|
| Interest on salaries and social security, other taxes ana accounts payable |
|
|
(26) |
|
|
|
(27) |
|
|
|
1 |
|
|
|
-3.7% |
|
| Interest on provisions |
|
|
(137) |
|
|
|
(118) |
|
|
|
(19) |
|
|
|
16.1% |
|
| Present value effect of salaries and social security and other taxes payables and other liabilities |
|
|
(9) |
|
|
|
(5) |
|
|
|
(4) |
|
|
|
80.0% |
|
| Foreign currency exchange losses net of NDF instruments |
|
|
(1,433) |
|
|
|
(864) |
|
|
|
(569) |
|
|
|
65.9% |
|
| Quinquennial financial costs |
|
|
(28) |
|
|
|
(23) |
|
|
|
(5) |
|
|
|
- |
|
| Others |
|
|
(10) |
|
|
|
- |
|
|
|
(10) |
|
|
|
- |
|
| Total finance expenses |
|
|
(2,209) |
|
|
|
(1,067) |
|
|
|
(1,142) |
|
|
|
107.0% |
|
|
|
|
|
|
|
|
|
|
|
|
|
|
|
|
|
|
|
|
|
(1,102) |
|
|
|
253 |
|
|
|
(1,355) |
|
|
|
- |
|
| 4- |
Consolidated Income Statements |
|
|
|
|
|
|
|
|
|
|
|
|
|
|
|
|
|
| Three Months Comparison |
|
12/31/15 |
|
|
12/31/14 |
|
|
D $
|
|
|
D %
|
|
|
|
|
|
|
| Revenues |
|
|
11,906 |
|
|
|
9,158 |
|
|
|
2,748 |
|
|
|
30.0% |
|
| Other income |
|
|
29 |
|
|
|
7 |
|
|
|
22 |
|
|
|
- |
|
| Total Revenues & Other Income |
|
|
11,935 |
|
|
|
9,165 |
|
|
|
2,770 |
|
|
|
30.2% |
|
| Consolidated Operating Costs |
|
|
(10,165) |
|
|
|
(7,565) |
|
|
|
(2,600) |
|
|
|
34.4% |
|
| Operating income |
|
|
1,770 |
|
|
|
1,600 |
|
|
|
170 |
|
|
|
10.6% |
|
| Finance results, net |
|
|
(910) |
|
|
|
23 |
|
|
|
(933) |
|
|
|
- |
|
| Net income before income tax expense |
|
|
860 |
|
|
|
1,623 |
|
|
|
(763) |
|
|
|
-47.0% |
|
| Income tax expense |
|
|
(203) |
|
|
|
(578) |
|
|
|
375 |
|
|
|
-64.9% |
|
| Net income |
|
|
657 |
|
|
|
1,045 |
|
|
|
(388) |
|
|
|
-37.1% |
|
|
|
|
|
|
| Attributable to: |
|
|
|
|
|
|
|
|
|
|
|
|
|
|
|
|
| Telecom Argentina (Controlling Company) |
|
|
646 |
|
|
|
1,029 |
|
|
|
(383) |
|
|
|
-37.2% |
|
| Non-controlling interest |
|
|
11 |
|
|
|
16 |
|
|
|
(5) |
|
|
|
-31.3% |
|
|
|
|
|
|
| Operating income before D&A |
|
|
3,202 |
|
|
|
2,516 |
|
|
|
686 |
|
|
|
27.3% |
|
| As % of Revenues |
|
|
26.9% |
|
|
|
27.5% |
|
|
|
|
|
|
|
|
|
*Unaudited data
TELECOM ARGENTINA S.A.
Consolidated information
Annual Period and Fourth Quarter - Fiscal Year 2015
(In million of Argentine pesos)
| 5- |
Breakdown of the Income Statements |
|
|
|
|
|
|
|
|
|
|
|
|
|
|
|
|
|
|
|
|
|
|
| |
|
12/31/15 |
|
|
12/31/14 |
|
|
D $ |
|
|
D % |
|
| REVENUES FROM SERVICES |
|
|
34,480 |
|
|
|
28,278 |
|
|
|
6,202 |
|
|
|
21.9% |
|
|
|
|
|
|
| Fixed Services |
|
|
10,675 |
|
|
|
8,506 |
|
|
|
2,169 |
|
|
|
25.5% |
|
|
|
|
|
|
| Voice |
|
|
4,339 |
|
|
|
3,782 |
|
|
|
557 |
|
|
|
14.7% |
|
| Retail Voice |
|
|
3,304 |
|
|
|
2,853 |
|
|
|
451 |
|
|
|
15.8% |
|
| Monthly Charges |
|
|
1,406 |
|
|
|
1,203 |
|
|
|
203 |
|
|
|
16.9% |
|
| Measured Services |
|
|
1,800 |
|
|
|
1,541 |
|
|
|
259 |
|
|
|
16.8% |
|
| Others |
|
|
98 |
|
|
|
109 |
|
|
|
(11) |
|
|
|
-10.1% |
|
| Wholesale |
|
|
1,035 |
|
|
|
929 |
|
|
|
106 |
|
|
|
11.4% |
|
| Interconnection |
|
|
689 |
|
|
|
621 |
|
|
|
68 |
|
|
|
11.0% |
|
| Others |
|
|
346 |
|
|
|
308 |
|
|
|
38 |
|
|
|
12.3% |
|
| Data |
|
|
1,780 |
|
|
|
1,470 |
|
|
|
310 |
|
|
|
21.1% |
|
| Internet |
|
|
4,556 |
|
|
|
3,254 |
|
|
|
1,302 |
|
|
|
40.0% |
|
|
|
|
|
|
| Mobiles Sevices |
|
|
23,805 |
|
|
|
19,772 |
|
|
|
4,033 |
|
|
|
20.4% |
|
|
|
|
|
|
| Telecom Personal |
|
|
22,258 |
|
|
|
18,284 |
|
|
|
3,974 |
|
|
|
21.7% |
|
| Voice |
|
|
8,848 |
|
|
|
7,283 |
|
|
|
1,565 |
|
|
|
21.5% |
|
| Retail Voice |
|
|
6,964 |
|
|
|
5,330 |
|
|
|
1,634 |
|
|
|
30.7% |
|
| Monthly Charges |
|
|
4,009 |
|
|
|
3,074 |
|
|
|
935 |
|
|
|
30.4% |
|
| Measured Services |
|
|
1,977 |
|
|
|
1,654 |
|
|
|
323 |
|
|
|
19.5% |
|
| Roaming |
|
|
270 |
|
|
|
271 |
|
|
|
(1) |
|
|
|
-0.4% |
|
| Others |
|
|
708 |
|
|
|
331 |
|
|
|
377 |
|
|
|
113.9% |
|
| Wholesale |
|
|
1,884 |
|
|
|
1,953 |
|
|
|
(69) |
|
|
|
-3.5% |
|
| Interconnection (CPP and TLRD) |
|
|
1,548 |
|
|
|
1,611 |
|
|
|
(63) |
|
|
|
-3.9% |
|
| Roaming |
|
|
285 |
|
|
|
301 |
|
|
|
(16) |
|
|
|
-5.3% |
|
| Others |
|
|
51 |
|
|
|
41 |
|
|
|
10 |
|
|
|
24.4% |
|
| Data |
|
|
7,156 |
|
|
|
7,666 |
|
|
|
(510) |
|
|
|
-6.7% |
|
| Internet |
|
|
6,254 |
|
|
|
3,335 |
|
|
|
2,919 |
|
|
|
87.5% |
|
|
|
|
|
|
| Núcleo |
|
|
1,547 |
|
|
|
1,488 |
|
|
|
59 |
|
|
|
4.0% |
|
| Voice |
|
|
667 |
|
|
|
701 |
|
|
|
(34) |
|
|
|
-4.9% |
|
| Retail Voice |
|
|
561 |
|
|
|
575 |
|
|
|
(14) |
|
|
|
-2.4% |
|
| Monthly Charges |
|
|
206 |
|
|
|
211 |
|
|
|
(5) |
|
|
|
-2.4% |
|
| Measured Services |
|
|
257 |
|
|
|
312 |
|
|
|
(55) |
|
|
|
-17.6% |
|
| Roaming |
|
|
11 |
|
|
|
10 |
|
|
|
1 |
|
|
|
10.0% |
|
| Others |
|
|
87 |
|
|
|
42 |
|
|
|
45 |
|
|
|
107.1% |
|
| Wholesale |
|
|
106 |
|
|
|
126 |
|
|
|
(20) |
|
|
|
-15.9% |
|
| Interconnection (CPP and TLRD) |
|
|
78 |
|
|
|
118 |
|
|
|
(40) |
|
|
|
-33.9% |
|
| Roaming |
|
|
21 |
|
|
|
3 |
|
|
|
18 |
|
|
|
- |
|
| Others |
|
|
7 |
|
|
|
5 |
|
|
|
2 |
|
|
|
40.0% |
|
| Data |
|
|
313 |
|
|
|
331 |
|
|
|
(18) |
|
|
|
-5.4% |
|
| Internet |
|
|
567 |
|
|
|
456 |
|
|
|
111 |
|
|
|
24.3% |
|
|
|
|
|
|
| REVENUES FROM EQUIPMENT SALES |
|
|
6,016 |
|
|
|
5,063 |
|
|
|
953 |
|
|
|
18.8% |
|
| Fixed Services |
|
|
61 |
|
|
|
53 |
|
|
|
8 |
|
|
|
15.1% |
|
| Mobiles Sevices |
|
|
5,955 |
|
|
|
5,010 |
|
|
|
945 |
|
|
|
18.9% |
|
| Equipments (Personal) |
|
|
5,796 |
|
|
|
4,920 |
|
|
|
876 |
|
|
|
17.8% |
|
| Equipments (Núcleo) |
|
|
159 |
|
|
|
90 |
|
|
|
69 |
|
|
|
76.7% |
|
| REVENUES |
|
|
40,496 |
|
|
|
33,341 |
|
|
|
7,155 |
|
|
|
21.5% |
|
|
|
|
|
|
| OTHER INCOME |
|
|
44 |
|
|
|
47 |
|
|
|
(3) |
|
|
|
-6.4% |
|
| Fixed |
|
|
39 |
|
|
|
26 |
|
|
|
13 |
|
|
|
50.0% |
|
| Mobile |
|
|
5 |
|
|
|
21 |
|
|
|
(16) |
|
|
|
-76.2% |
|
|
|
|
|
|
| TOTAL REVENUES & OTHER INCOME |
|
|
40,540 |
|
|
|
33,388 |
|
|
|
7,152 |
|
|
|
21.4% |
|
Note: Reclassifications have been made in the breakdown of 4Q14 mobile service revenues as
changes were implemented in the allocation criteria of revenues between voice, data, and Internet items of postpaid plans.
*Unaudited data
TELECOM ARGENTINA S.A.
Consolidated information
Annual Period and Fourth Quarter - Fiscal Year 2015
(In million of Argentine pesos)
| 6- |
BREAKDOWN OF THE INCOME STATEMENTS |
|
|
|
|
|
|
|
|
|
|
|
|
|
|
|
|
|
|
|
|
|
|
| Three Months Comparison |
|
|
|
|
|
|
|
|
|
|
|
|
| |
|
12/31/15 |
|
|
12/31/14 |
|
|
D $ |
|
|
D % |
|
|
|
|
|
|
| REVENUES FROM SERVICES |
|
|
9,512 |
|
|
|
7,710 |
|
|
|
1,802 |
|
|
|
23.4% |
|
|
|
|
|
|
| Fixed Services |
|
|
2,999 |
|
|
|
2,308 |
|
|
|
691 |
|
|
|
29.9% |
|
|
|
|
|
|
| Voice |
|
|
1,226 |
|
|
|
992 |
|
|
|
234 |
|
|
|
23.6% |
|
| Retail Voice |
|
|
925 |
|
|
|
744 |
|
|
|
181 |
|
|
|
24.3% |
|
| Monthly Charges |
|
|
414 |
|
|
|
308 |
|
|
|
106 |
|
|
|
34.4% |
|
| Measured Services |
|
|
485 |
|
|
|
410 |
|
|
|
75 |
|
|
|
18.3% |
|
| Others |
|
|
26 |
|
|
|
26 |
|
|
|
- |
|
|
|
- |
|
| Wholesale |
|
|
301 |
|
|
|
248 |
|
|
|
53 |
|
|
|
21.4% |
|
| Interconnection |
|
|
205 |
|
|
|
168 |
|
|
|
37 |
|
|
|
22.0% |
|
| Others |
|
|
96 |
|
|
|
80 |
|
|
|
16 |
|
|
|
20.0% |
|
| Data |
|
|
490 |
|
|
|
407 |
|
|
|
83 |
|
|
|
20.4% |
|
| Internet |
|
|
1,283 |
|
|
|
909 |
|
|
|
374 |
|
|
|
41.1% |
|
|
|
|
|
|
| Mobiles Sevices |
|
|
6,513 |
|
|
|
5,402 |
|
|
|
1,111 |
|
|
|
20.6% |
|
|
|
|
|
|
| Telecom Personal |
|
|
6,095 |
|
|
|
5,012 |
|
|
|
1,083 |
|
|
|
21.6% |
|
| Voice |
|
|
2,344 |
|
|
|
1,997 |
|
|
|
347 |
|
|
|
17.4% |
|
| Retail Voice |
|
|
1,855 |
|
|
|
1,500 |
|
|
|
355 |
|
|
|
23.7% |
|
| Monthly Charges |
|
|
1,058 |
|
|
|
902 |
|
|
|
156 |
|
|
|
17.3% |
|
| Measured Services |
|
|
534 |
|
|
|
434 |
|
|
|
100 |
|
|
|
23.0% |
|
| Roaming |
|
|
61 |
|
|
|
56 |
|
|
|
5 |
|
|
|
8.9% |
|
| Others |
|
|
202 |
|
|
|
108 |
|
|
|
94 |
|
|
|
87.0% |
|
| Wholesale |
|
|
489 |
|
|
|
497 |
|
|
|
(8) |
|
|
|
-1.6% |
|
| Interconnection (CPP and TLRD) |
|
|
404 |
|
|
|
415 |
|
|
|
(11) |
|
|
|
-2.7% |
|
| Roaming |
|
|
60 |
|
|
|
72 |
|
|
|
(12) |
|
|
|
-16.7% |
|
| Others |
|
|
25 |
|
|
|
10 |
|
|
|
15 |
|
|
|
150.0% |
|
| Data |
|
|
1,780 |
|
|
|
1,974 |
|
|
|
(194) |
|
|
|
-9.8% |
|
| Internet |
|
|
1,971 |
|
|
|
1,041 |
|
|
|
930 |
|
|
|
89.3% |
|
|
|
|
|
|
| Núcleo |
|
|
418 |
|
|
|
390 |
|
|
|
28 |
|
|
|
7.2% |
|
| Voice |
|
|
146 |
|
|
|
172 |
|
|
|
(26) |
|
|
|
-15.1% |
|
| Retail Voice |
|
|
120 |
|
|
|
144 |
|
|
|
(24) |
|
|
|
-16.7% |
|
| Monthly Charges |
|
|
32 |
|
|
|
50 |
|
|
|
(18) |
|
|
|
-36.0% |
|
| Measured Services |
|
|
56 |
|
|
|
75 |
|
|
|
(19) |
|
|
|
-25.3% |
|
| Roaming |
|
|
3 |
|
|
|
3 |
|
|
|
- |
|
|
|
- |
|
| Others |
|
|
29 |
|
|
|
16 |
|
|
|
13 |
|
|
|
- |
|
| Wholesale |
|
|
26 |
|
|
|
28 |
|
|
|
(2) |
|
|
|
-7.1% |
|
| Interconnection (CPP and TLRD) |
|
|
21 |
|
|
|
27 |
|
|
|
(6) |
|
|
|
-22.2% |
|
| Roaming |
|
|
3 |
|
|
|
- |
|
|
|
3 |
|
|
|
- |
|
| Others |
|
|
2 |
|
|
|
1 |
|
|
|
1 |
|
|
|
100.0% |
|
| Data |
|
|
93 |
|
|
|
83 |
|
|
|
10 |
|
|
|
12.0% |
|
| Internet |
|
|
179 |
|
|
|
135 |
|
|
|
44 |
|
|
|
32.6% |
|
|
|
|
|
|
| REVENUES FROM EQUIPMENT SALES |
|
|
2,394 |
|
|
|
1,448 |
|
|
|
946 |
|
|
|
65.3% |
|
| Fixed Services |
|
|
13 |
|
|
|
9 |
|
|
|
4 |
|
|
|
44.4% |
|
| Mobiles Sevices |
|
|
2,381 |
|
|
|
1,439 |
|
|
|
942 |
|
|
|
65.5% |
|
| Equipments (Personal) |
|
|
2,328 |
|
|
|
1,405 |
|
|
|
923 |
|
|
|
65.7% |
|
| Equipments (Núcleo) |
|
|
53 |
|
|
|
34 |
|
|
|
19 |
|
|
|
55.9% |
|
| REVENUES |
|
|
11,906 |
|
|
|
9,158 |
|
|
|
2,748 |
|
|
|
30.0% |
|
|
|
|
|
|
| OTHER INCOME |
|
|
29 |
|
|
|
7 |
|
|
|
22 |
|
|
|
- |
|
| Fixed |
|
|
27 |
|
|
|
2 |
|
|
|
25 |
|
|
|
- |
|
| Mobile |
|
|
2 |
|
|
|
5 |
|
|
|
(3) |
|
|
|
-60.0% |
|
|
|
|
|
|
| TOTAL REVENUES & OTHER INCOME |
|
|
11,935 |
|
|
|
9,165 |
|
|
|
2,770 |
|
|
|
30.2% |
|
Note: Reclassifications have been made in the breakdown of 4Q14 mobile service
revenues as changes were implemented in the allocation criteria of revenues between voice, data, and Internet items of postpaid plans.
*Unaudited data
TELECOM ARGENTINA S.A.
Consolidated information
Annual Period and Fourth Quarter - Fiscal Year 2015
(In million of Argentine pesos)
| 7- |
Consolidated Income Statements |
|
|
|
|
|
|
|
|
|
|
|
|
|
|
|
|
|
| |
|
12/31/15 |
|
|
12/31/14 |
|
|
D $
|
|
|
D %
|
|
| Revenues |
|
|
40,496 |
|
|
|
33,341 |
|
|
|
7,155 |
|
|
|
21.5% |
|
| Other income |
|
|
44 |
|
|
|
47 |
|
|
|
(3) |
|
|
|
-6.4% |
|
| Total Revenues & Other Income |
|
|
40,540 |
|
|
|
33,388 |
|
|
|
7,152 |
|
|
|
21.4% |
|
| Employee benefit expenses and severance payments |
|
|
(7,253) |
|
|
|
(5,591) |
|
|
|
(1,662) |
|
|
|
29.7% |
|
| Interconnection costs and other telecommunication charges |
|
|
(2,170) |
|
|
|
(2,074) |
|
|
|
(96) |
|
|
|
4.6% |
|
| Fees for services, maintenance, materials and supplies |
|
|
(3,919) |
|
|
|
(3,333) |
|
|
|
(586) |
|
|
|
17.6% |
|
| Taxes and fees with the Regulatory Authority |
|
|
(3,943) |
|
|
|
(3,297) |
|
|
|
(646) |
|
|
|
19.6% |
|
| Commissions |
|
|
(3,193) |
|
|
|
(2,494) |
|
|
|
(699) |
|
|
|
28.0% |
|
| Cost of equipments and handsets |
|
|
(4,595) |
|
|
|
(4,143) |
|
|
|
(452) |
|
|
|
10.9% |
|
| Advertising |
|
|
(814) |
|
|
|
(792) |
|
|
|
(22) |
|
|
|
2.8% |
|
| Cost of Value Added Services |
|
|
(1,256) |
|
|
|
(936) |
|
|
|
(320) |
|
|
|
34.2% |
|
| Provisions |
|
|
(113) |
|
|
|
(84) |
|
|
|
(29) |
|
|
|
34.5% |
|
| Bad debt expenses |
|
|
(564) |
|
|
|
(424) |
|
|
|
(140) |
|
|
|
33.0% |
|
| Other operating expenses |
|
|
(1,854) |
|
|
|
(1,518) |
|
|
|
(336) |
|
|
|
22.1% |
|
| Subtotal Operating costs |
|
|
(29,674) |
|
|
|
(24,686) |
|
|
|
(4,988) |
|
|
|
20.2% |
|
| Operating income before D&A |
|
|
10,866 |
|
|
|
8,702 |
|
|
|
2,164 |
|
|
|
24.9% |
|
| D&A |
|
|
(4,438) |
|
|
|
(3,243) |
|
|
|
(1,195) |
|
|
|
36.8% |
|
| Results on disposal of PP&E and write-down of PP&E |
|
|
(199) |
|
|
|
(16) |
|
|
|
(183) |
|
|
|
- |
|
| Operating income |
|
|
6,229 |
|
|
|
5,443 |
|
|
|
786 |
|
|
|
14.4% |
|
| Finance Income |
|
|
1,107 |
|
|
|
1,320 |
|
|
|
(213) |
|
|
|
-16.1% |
|
| Finance Expenses |
|
|
(2,209) |
|
|
|
(1,067) |
|
|
|
(1,142) |
|
|
|
107.0% |
|
| Net income before income tax expense |
|
|
5,127 |
|
|
|
5,696 |
|
|
|
(569) |
|
|
|
-10.0% |
|
| Income tax expense |
|
|
(1,692) |
|
|
|
(1,967) |
|
|
|
275 |
|
|
|
-14.0% |
|
| Net Income |
|
|
3,435 |
|
|
|
3,729 |
|
|
|
(294) |
|
|
|
-7.9% |
|
|
|
|
|
|
|
|
|
|
|
|
|
|
|
|
|
|
| Attributable to: |
|
|
|
|
|
|
|
|
|
|
|
|
|
|
|
|
| Telecom Argentina (Controlling Company) |
|
|
3,403 |
|
|
|
3,673 |
|
|
|
(270) |
|
|
|
-7.4% |
|
| Non-controlling interest |
|
|
32 |
|
|
|
56 |
|
|
|
(24) |
|
|
|
-42.9% |
|
|
|
|
|
|
|
|
|
| *Unaudited data |
|
13 |
|
www.telecom.com.ar |
TELECOM ARGENTINA S.A.
Consolidated information
Annual Period and Fourth Quarter - Fiscal Year 2015
(In million of Argentine pesos)
| 8- |
CONSOLIDATED INCOME STATEMENTS |
|
|
|
|
|
|
|
|
|
|
|
|
|
|
|
|
|
| Three Months Comparison |
|
|
|
|
|
|
|
|
|
|
|
|
|
|
|
|
| |
|
12/31/15 |
|
|
12/31/14 |
|
|
D $
|
|
|
D %
|
|
| Revenues |
|
|
11,906 |
|
|
|
9,158 |
|
|
|
2,748 |
|
|
|
30.0% |
|
| Other income |
|
|
29 |
|
|
|
7 |
|
|
|
22 |
|
|
|
- |
|
| Total Revenues & Other Income |
|
|
11,935 |
|
|
|
9,165 |
|
|
|
2,770 |
|
|
|
30.2% |
|
| Employee benefit expenses and severance payments |
|
|
(1,961) |
|
|
|
(1,589) |
|
|
|
(372) |
|
|
|
23.4% |
|
| Interconnection costs and other telecommunication charges |
|
|
(611) |
|
|
|
(538) |
|
|
|
(73) |
|
|
|
13.6% |
|
| Fees for services, maintenance, materials and supplies |
|
|
(1,059) |
|
|
|
(851) |
|
|
|
(208) |
|
|
|
24.4% |
|
| Taxes and fees with the Regulatory Authority |
|
|
(1,102) |
|
|
|
(898) |
|
|
|
(204) |
|
|
|
22.7% |
|
| Commissions |
|
|
(998) |
|
|
|
(707) |
|
|
|
(291) |
|
|
|
41.2% |
|
| Cost of equipments and handsets |
|
|
(1,804) |
|
|
|
(1,024) |
|
|
|
(780) |
|
|
|
76.2% |
|
| Advertising |
|
|
(223) |
|
|
|
(280) |
|
|
|
57 |
|
|
|
-20.4% |
|
| Cost of Value Added Services |
|
|
(346) |
|
|
|
(257) |
|
|
|
(89) |
|
|
|
34.6% |
|
| Provisions |
|
|
61 |
|
|
|
18 |
|
|
|
43 |
|
|
|
- |
|
| Bad debt expenses |
|
|
(154) |
|
|
|
(97) |
|
|
|
(57) |
|
|
|
58.8% |
|
| Other operating expenses |
|
|
(536) |
|
|
|
(426) |
|
|
|
(110) |
|
|
|
25.8% |
|
| Subtotal Operating costs |
|
|
(8,733) |
|
|
|
(6,649) |
|
|
|
(2,084) |
|
|
|
31.3% |
|
| Operating income before D&A |
|
|
3,202 |
|
|
|
2,516 |
|
|
|
686 |
|
|
|
27.3% |
|
| D&A |
|
|
(1,284) |
|
|
|
(889) |
|
|
|
(395) |
|
|
|
44.4% |
|
| Results on disposal of PP&E and write-down of PP&E |
|
|
(148) |
|
|
|
(27) |
|
|
|
(121) |
|
|
|
- |
|
| Operating income |
|
|
1,770 |
|
|
|
1,600 |
|
|
|
170 |
|
|
|
10.6% |
|
| Finance Income |
|
|
534 |
|
|
|
11 |
|
|
|
523 |
|
|
|
- |
|
| Finance Expenses |
|
|
(1,444) |
|
|
|
12 |
|
|
|
(1,456) |
|
|
|
- |
|
| Net income before income tax expense |
|
|
860 |
|
|
|
1,623 |
|
|
|
(763) |
|
|
|
-47.0% |
|
| Income tax expense |
|
|
(203) |
|
|
|
(578) |
|
|
|
375 |
|
|
|
-64.9% |
|
| Net Income |
|
|
657 |
|
|
|
1,045 |
|
|
|
(388) |
|
|
|
-37.1% |
|
|
|
|
|
|
|
|
|
|
|
|
|
|
|
|
|
|
| Attributable to: |
|
|
|
|
|
|
|
|
|
|
|
|
|
|
|
|
| Telecom Argentina (Controlling Company) |
|
|
646 |
|
|
|
1,029 |
|
|
|
(383) |
|
|
|
-37.2% |
|
| Non-controlling interest |
|
|
11 |
|
|
|
16 |
|
|
|
(5) |
|
|
|
-31.3% |
|
|
|
|
|
|
|
|
|
| *Unaudited data |
|
14 |
|
www.telecom.com.ar |
SIGNATURES
Pursuant to the requirements of the Securities Exchange Act of 1934, the registrant has duly caused this report to be signed on its behalf by
the undersigned, thereunto duly authorized.
|
|
|
|
|
|
|
|
|
|
|
|
|
Telecom Argentina S.A. |
|
|
|
|
| Date: February 12, 2016 |
|
|
|
By: |
|
/s/ Oscar Carlos Cristianci |
|
|
|
|
|
|
Name: |
|
Oscar Carlos Cristianci |
|
|
|
|
|
|
Title: |
|
Chairman of the Board of Directors |
Telecom Argentina (NYSE:TEO)
Historical Stock Chart
Von Mär 2024 bis Apr 2024

Telecom Argentina (NYSE:TEO)
Historical Stock Chart
Von Apr 2023 bis Apr 2024
